
TLDR; You can use the corrtable package (see CRAN or Github)!
In most (observational) research papers you read, you will probably run into a correlation matrix. Often it looks something like this:

In Social Sciences, like Psychology, researchers like to denote the statistical significance levels of the correlation coefficients, often using asterisks (i.e., *). Then the table will look more like this:

Regardless of my personal preferences and opinions, I had to make many of these tables for the scientific (non-)publications of my Ph.D..
I remember that, when I first started using R, I found it quite difficult to generate these correlation matrices automatically.
Yes, there is the cor function, but it does not include significance levels.

Then there the (in)famous Hmisc package, with its rcorr function. But this tool provides a whole new range of issues.
What’s this storage.mode, and what are we trying to coerce again?

Soon you figure out that Hmisc::rcorr only takes in matrices (thus with only numeric values). Hurray, now you can run a correlation analysis on your dataframe, you think…
Yet, the output is all but publication-ready!
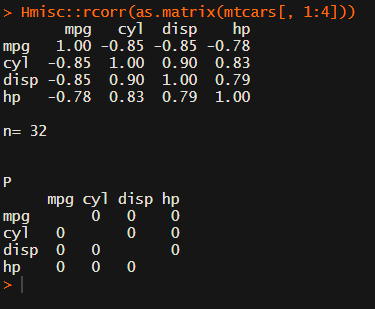
You wanted one correlation matrix, but now you have two… Double the trouble?
[UPDATED] To spare future scholars the struggle of the early day R programming, Laura Lambert and I created an R package corrtable, which includes the helpful function correlation_matrix.
This correlation_matrix takes in a dataframe, selects only the numeric (and boolean/logical) columns, calculates the correlation coefficients and p-values, and outputs a fully formatted publication-ready correlation matrix!

You can specify many formatting options in correlation_matrix.
For instance, you can use only 2 decimals. You can focus on the lower triangle (as the lower and upper triangle values are identical). And you can drop the diagonal values:

Or maybe you are interested in a different type of correlation coefficients, and not so much in significance levels:

For other formatting options, do have a look at the source code on github.
Now, to make matters even easier, the package includes a second function (save_correlation_matrix) to directly save any created correlation matrices:

Once you open your new correlation matrix file in Excel, it is immediately ready to be copy-pasted into Word!

If you are looking for ways to visualize your correlations do have a look at the packages corrr, corrplot, or ppsr.

I hope this package is of help to you!
Do reach out if you get to use them in any of your research papers!
Sign up to keep up to date on the latest R, Data Science & Tech content:

Fantastic, finally!
THANK YOU!
LikeLiked by 1 person
Please one worked put example or vignette, thanks
LikeLike
There are examples listed in the article and in the code Duleep. They work with the datasets already included in R: iris or mtcars.
LikeLike
This is so cool! Thank you.
LikeLiked by 1 person
Great, thank you! One question, can you use this package to calculate the correlation matrix split by groups? I have some experimental results with different treatments, and I am interested in the correlation matrix by treatment.
Thanks!
Gerardo
LikeLiked by 1 person
Hi Gerardo. I am not currently in reach of a computer. Yet I think something like `lapply(split(df, group_var), correlation_matrix)` should work.
Split first splits your df into a list with seperate dfs per group on the group_var, and then lapply applies the correlation_matrix function to each list element (split df), returning seperate correlation matrices in a list. Have a look at the split and lapply base function documentation for how they precisely work.
LikeLike
Hi Paul,
thank you for providing this great code. I was wondering, I too am trying to split up my correlation table (consisting of several health parameters, e.g., Diet, Check Up…), by a group variable (affective disorder vs. healthy control). For this purpose, I generated the following code:
psychometric <- data.frame(df$DT_Mach_total,
df$DT_Nar_total, df$DT_Psy_total,
df$HB_Diet, df$HB_Substance,
df$HB_CheckUp, df$HB_Activity,
df$MEDAS_total,
df$PSM_total, df$VAX_total,
df$PHQ_total)
correlation_matrix(psychometric, type = "pearson", digits = 2, use = 'upper', replace_diagonal = TRUE)
splitdf 1 column
I cannot find a solution for this problem, but would really like to print a table, as there are many variables… Can you maybe help me out?
Thanks so much in advance!
Elena
LikeLike
…sorry, some of the text seems to have vansihed. So I this code and it works fine, I can generate two correlation matrices by group. However, when trying to save the tables using the “save_correlation_matrix” command like this:
save_correlation_matrix(df = splitdf, filename = ‘psychometric_table.csv’, digits =2)
R gives me the following error message:
Dropping non-numeric/-boolean column(s): X1.df.DT_Mach_total., X1.df.DT_Nar_total., X1.df.DT_Psy_total., X1.df.HB_Diet., X1.df.HB_Substance., X1.df.HB_CheckUp., X1.df.HB_Activity., X1.df.MEDAS_total., X1.df.PSM_total., X1.df.VAX_total., X1.df.PHQ_total., X2.df.DT_Mach_total., X2.df.DT_Nar_total., X2.df.DT_Psy_total., X2.df.HB_Diet., X2.df.HB_Substance., X2.df.HB_CheckUp., X2.df.HB_Activity., X2.df.MEDAS_total., X2.df.PSM_total., X2.df.VAX_total., X2.df.PHQ_total.
Error in Hmisc::rcorr(x, type = ) : must have >1 column
However, all the colums are numeric vectors…
LikeLike
Hi Elena, I wish I could solve your problem here by just looking at the code you posted, but I can’t. Unfortunately, I do not have the luxury of time to solve your issue for you, so I suggest you try to play around with the code some more. For instance, you can open up the functions’ source code and just paste that in your R script. Maybe running it line by line on your dataset, you can figure out where the code breaks for your particular example. Alternatively, you can open up a GitHub issue for the package with some replicable examples and we can look into it when we get the time.
I hope you figure it out!
LikeLike
Is there a problem with columns containing only one level or value such as `correlation_matrix(dplyr::mutate(mtcars, aa=0) %>% as.data.frame())`?
LikeLike
Hi Jimbou! I had accounted for error-handling in case of missing correlations (when there is no variation in one of the variables).
I have changed the code and the function can now handle such cases. The respective correlation matrix column/row will contain NaNs. Moreover, I’ve improved the function slightly to make all correlation value strings equally long.
I should really stop posting code on my website and open github repositories with change requests ; )
Thanks for noticing this error though!
LikeLike
Hey there, great work on this! I just had one issue, similar to some of your images (e.g. https://paulvanderlaken.files.wordpress.com/2020/07/image-9.png) I am having the symbols ” ” appear in all fields. Do you know what causes this or how to remove them?
LikeLike
Hi BM, could you share the exact code you used? I can’t see the exact issue based on this information.
LikeLike
I copied the provided code for the function into an r markdown sheet and used to following code to produce the correlation matrix:
correlation_matrix(mydata.BM.morning.sleep, show_significance = TRUE, digits = 2, use = “lower”, replace_diagonal = TRUE, replacement = “”)
LikeLike
I still can’t deduce the issue here. What happens if you try using the function without providing all the arguments? If you give it just your data? The data is numeric right?
LikeLike
Yeah, I’ve tried it without any arguments and it’s exactly the same. It looks like these images:
The “” don’t appear when using save_correlation_matrix though.
LikeLike
Yeah those “” are supposed to appear, as they indicate that the correlation coefficients are stored as textual (character) values in R. That is necessary as they are a combination of the numerical coefficients and the textual significance indicators (***). Once you export them to Excel, the “” dissappear as Excel does not use them to indicate that data is textual. Does this clarify your issue?
If you want to create a correlation table in R markdown without the “” you can look into further manipulating the output correlation matrix using the gt package to turn it into a pretty table.
LikeLike
Ah, yep! That completely makes sense and it’s not an issue as it doesn’t appear in the saved output. Thank you so much for coding this – it’s great!
LikeLiked by 1 person
Hi Paul, this is so great! Was searching for a easy-to-use method for this issue and this one is fantastic! Thanks a lot for this work and especially for sharing with others, this is how it works!
LikeLike
Hi, this works amazing, thank you! However, I had to tweak one little thing and let you know about it: to my understanding, the fuction does not feed “type” adequately into rcorr, which made me unable to run spearman correlations. I changed “[…] type = )” to “[…]type = type)” and then it worked. 🙂
LikeLike
I am having the same problem but can’t figure out how to get it to work.
Here is my code: corrtable::correlation_matrix(df, type = “spearman”)
LikeLike
You need to change it inside the functions source code Jason. Hope you manage, otherwise maybe ask ChatGPT for help
LikeLike
A massive thank you for the function! However the save matrix function doesn’t seem to work properly… it was pasted as one single chunk without being split into separate cols, any ideas how to fix that? Thank you!
LikeLike
Hi Vi, then you probably have a different default seperator/delimiter set on your OS. You can change the inner writing function to write.csv() and I think that will fix it for you
LikeLike
Are your numeric columns typed as numeric data? If they are characters or factors, you might have some issues. I will need a reproducible error to help you further.
LikeLike
Thanx for the fast response! In my database there is a variety of character or factor variables but the majority is nummeric:
See a excerpt from a couple of numeric variables(via str(database):
$ T1_MEA_ADP_AUC : num 95 28 116 24 70 72 25 74 45 71 …
$ T1_MEA_ADP_Aggr : num 158.3 53.6 222.8 55.9 134.3 …
$ T1_MEA_ADP_Vel : num 21.3 8 23 5.9 14.1 15.3 7.1 15.5 9.6 17.8 …
$ T1_MEA_ASPI_AUC : num 18 14 15 8 23 49 34 43 6 29 …
$ T1_MEA_ASPI_Aggr : num 40.9 34.9 40.5 18.8 77.3 …
$ T1_MEA_ASPI_Vel : num 5.4 4.3 5.2 4.1 9.4 11.9 9.7 11.4 2.5 6.9 …
$ T1_MEA_TRAP_AUC : num 119 107 172 66 123 70 55 94 121 17.8 …
LikeLike
It should not drop those columns. But I can’t help you if I don’t have a reproducible example: https://www.google.com/search?q=reproducible+example
Else I can’t see what goes wrong.
LikeLike
rm(list=ls(all=TRUE))
library(data.table)
library(MBESS)
library(QuantPsyc)
library(readr)
library(lattice)
library(VIM)
library(tableone)
library(foreign)
library(gdata)
library(lattice)
library(nlme)
library(psych)
library(ggplot2)
library(car)
library(effects)
library(papeR)
library(JM)
library(lme4)
library(haven)
library(rms)
library(mice)
library(data.table)
library(lattice)
library(VIM)
library(tableone)
library(readxl)
dput(my.data3)
my.data <-dput(my.data3)
#loading correlation_matrixt script
correlation_matrix(my.data3, use ='lower', type ='spearman', show_significance = FALSE)
outcome.matrix <- Dropping non-numeric/-boolean column(s): Study_number, Incl_age, Incl_abd_surg, Incl_ascal, Excl_IC, Excl_life_exp, Excl_thromb_ther, Excl_Gibleed, Excl_plat_dis, Excl_surg_trau, Excl_Hb, Informed_consent, Sex, Family_burden_CVD, Smoking, MH_hypertension, MH_Atrium_fibrillation, MH_Cong_HF, MH_Angina_pectoris, MH_Aorta_valve_stenosis, MH_Myocardial_Infarction, MH_MI_PCI, MH_Cardiac_surgery, MH_Cardiacsurgery_specified, MH_pacemaker, MH_dyslipidemia, MH_Diabetes, MH_TIA_CVA, MH_COPD, MH_dialysis, MH_renal_insufficiency, MH_peripheral_vascular_disease, Vascsurgery, MH_PAD_surgery, NYHA_class, Rev_Cardiac_Risk_Index_surg, Rev_Cardiac_Risk_Index_isch_heart, Rev_Cardiac_Risk_Index_CHF, Rev_Cardiac_Risk_Index_CVA, Rev_Cardiac_Risk_Index_DMins, Rev_Cardiac_Risk_Index_creat, Med_aspirin, Dose_aspirin, Med_P2Y12, Med_VitK, Med_NOAC, Med_NSAID, Med_dipyridamole, Med_betablocker, Med_CA_ant, Med_ACE_inh, Med_Diuretics, Med_Digoxin, Med_Statin, Med_prednisone, T1_blood_collection_date, T1_blood_collection_time, T1_collection_mechanism, T2_blood_collection_date, T2_blood_collection_time, T2_collection_mechanism, T3_blood_collection_date, T3_blood_collection_time, T3_collection_mechanism, T4_blood_collection_date, T4_blood_collection_time, T4_collection_mechanism, T1_MEA_time, Transcombined, MI_type, FU_Other_intervention_specified, FU_infection_specified, FU_arrhythmia_specified, Outlierdeselect, filter_.
Age_inclusion Body_length Body_weight BMI_calc Alcohol Packyears MH_Avs_Grad MH_Avs_AVA MH_LVEF
Age_inclusion " 1.000" "" "" "" "" "" "" "" ""
Body_length "-0.089" " 1.000" "" "" "" "" "" "" ""
Body_weight " 0.024" " 0.400" " 1.000" "" "" "" "" "" ""
Rev_Cardiac_Risk_Index_TOTAL T1_MEA_ADP_AUC T1_MEA_ADP_Aggr T1_MEA_ADP_Vel T1_MEA_ASPI_AUC T1_MEA_ASPI_Aggr
Age_inclusion "" "" "" "" "" ""
Body_length "" "" "" "" "" ""
Body_weight "" "" "" "" "" ""
T1_MEA_ASPI_Vel T1_MEA_TRAP_AUC T1_MEA_TRAP_Aggr T1_MEA_TRAP_Vel T2_MEA_ADP_AUC T2_MEA_ADP_Aggr T2_MEA_ADP_Vel
Age_inclusion "" "" "" "" "" "" ""
Body_length "" "" "" "" "" "" ""
Body_weight "" "" "" "" "" "" ""
T2_MEA_ASPI_AUC T2_MEA_ASPI_Aggr T2_MEA_ASPI_Vel T2_MEA_TRAP_AUC T2_MEA_TRAP_Aggr T2_MEA_TRAP_Vel T3_MEA_ADP_AUC
Age_inclusion "" "" "" "" "" "" ""
Body_length "" "" "" "" "" "" ""
Body_weight "" "" "" "" "" "" ""
T3_MEA_ADP_Aggr T3_MEA_ADP_Vel T3_MEA_ASPI_AUC T3_MEA_ASPI_Aggr T3_MEA_ASPI_Vel T3_MEA_TRAP_AUC T3_MEA_TRAP_Aggr
Age_inclusion "" "" "" "" "" "" ""
Body_length "" "" "" "" "" "" ""
Body_weight "" "" "" "" "" "" ""
T3_MEA_TRAP_Vel T4_MEA_ADP_AUC T4_MEA_ADP_Aggr T4_MEA_ADP_Vel T4_MEA_ASPI_AUC T4_MEA_ASPI_Aggr T4_MEA_ASPI_Vel
Age_inclusion "" "" "" "" "" "" ""
Body_length "" "" "" "" "" "" ""
Body_weight "" "" "" "" "" "" ""
T4_MEA_TRAP_AUC T4_MEA_TRAP_Aggr T4_MEA_TRAP_Vel T1_CK_r T1_CK_k T1_CK_angle T1_CK_MA T1_CK_LY30 T1_CRT_r T1_CRT_k
Age_inclusion "" "" "" "" "" "" "" "" "" ""
Body_length "" "" "" "" "" "" "" "" "" ""
Body_weight "" "" "" "" "" "" "" "" "" ""
T1_CRT_angle T1_CRT_MA T1_CRT_LY30 T1_CRT_TEGACT T1_CKH_r T1_CKH_k T1_CKH_angle T1_CKH_MA T1_CFF_MA T1_CFF_FLEV T2_CK_r
Age_inclusion "" "" "" "" "" "" "" "" "" "" ""
Body_length "" "" "" "" "" "" "" "" "" "" ""
Body_weight "" "" "" "" "" "" "" "" "" "" ""
T2_CK_k T2_CK_angle T2_CK_MA T2_CK_LY30 T2_CRT_r T2_CRT_k T2_CRT_angle T2_CRT_MA T2_CRT_LY30 T2_CRT_TEGACT T2_CKH_r
Age_inclusion "" "" "" "" "" "" "" "" "" "" ""
Body_length "" "" "" "" "" "" "" "" "" "" ""
Body_weight "" "" "" "" "" "" "" "" "" "" ""
T2_CKH_k T2_CKH_angle T2_CKH_MA T2_CFF_MA T2_CFF_FLEV T3_CK_r T3_CK_k T3_CK_angle T3_CK_MA T3_CK_LY30 T3_CRT_r T3_CRT_k
Age_inclusion "" "" "" "" "" "" "" "" "" "" "" ""
Body_length "" "" "" "" "" "" "" "" "" "" "" ""
Body_weight "" "" "" "" "" "" "" "" "" "" "" ""
T3_CRT_angle T3_CRT_MA T3_CRT_LY30 T3_CRT_TEGACT T3_CKH_r T3_CKH_k T3_CKH_angle T3_CKH_MA T3_CFF_MA T3_CFF_FLEV T4_CK_r
Age_inclusion "" "" "" "" "" "" "" "" "" "" ""
Body_length "" "" "" "" "" "" "" "" "" "" ""
Body_weight "" "" "" "" "" "" "" "" "" "" ""
T4_CK_k T4_CK_angle T4_CK_MA T4_CK_LY30 T4_CRT_r T4_CRT_k T4_CRT_angle T4_CRT_MA T4_CRT_LY30 T4_CRT_TEGACT T4_CKH_r
Age_inclusion "" "" "" "" "" "" "" "" "" "" ""
Body_length "" "" "" "" "" "" "" "" "" "" ""
Body_weight "" "" "" "" "" "" "" "" "" "" ""
T4_CKH_k T4_CKH_angle T4_CKH_MA T4_CFF_MA T4_CFF_FLEV T1_VerifyNow_ARU T2_VerifyNow_ARU T3_VerifyNow_ARU T4_VerifyNow_ARU
Age_inclusion "" "" "" "" "" "" "" "" ""
Body_length "" "" "" "" "" "" "" "" ""
Body_weight "" "" "" "" "" "" "" "" ""
T1_Psel_TRAP T1_Psel_noTRAP T1_ratio T2_Psel_TRAP T2_Psel_noTRAP T2_ratio T3_Psel_TRAP T3_Psel_noTRAP T3_ratio
Age_inclusion "" "" "" "" "" "" "" "" ""
Body_length "" "" "" "" "" "" "" "" ""
Body_weight "" "" "" "" "" "" "" "" ""
T4_Psel_TRAP T4_Psel_noTRAP T4_ratio T1_ECG_findings T2_ECG_findings T3_ECG_findings T4_ECG_findings T1_Hemoglobin
Age_inclusion "" "" "" "" "" "" "" ""
Body_length "" "" "" "" "" "" "" ""
Body_weight "" "" "" "" "" "" "" ""
T1_Hematocrit T1_Leukocytecount T1_Monocytecount T1_Plateletcount T1_MPV T1_PDW T1_PT T1_aPTT T1_fibrinogeen
Age_inclusion "" "" "" "" "" "" "" "" ""
Body_length "" "" "" "" "" "" "" "" ""
Body_weight "" "" "" "" "" "" "" "" ""
T1_cephotest T1_hsCRP T1_hscTnT T1_Urea T1_creatinine T1_proBNP T2_Hemoglobin T2_Hematocrit T2_Leukocytecount
Age_inclusion "" "" "" "" "" "" "" "" ""
Body_length "" "" "" "" "" "" "" "" ""
Body_weight "" "" "" "" "" "" "" "" ""
T2_Monocytecount T2_Plateletcount T2_MPV T2_PDW T2_PT T2_aPTT T2_fibrinogeen T2_cephotest T2_hsCRP T2_hscTnT
Age_inclusion "" "" "" "" "" "" "" "" "" ""
Body_length "" "" "" "" "" "" "" "" "" ""
Body_weight "" "" "" "" "" "" "" "" "" ""
T2_Urea T2_creatinine T2_proBNP T3_Hemoglobin T3_Hematocrit T3_Leukocytecount T3_Monocytecount T3_Plateletcount T3_MPV
Age_inclusion "" "" "" "" "" "" "" "" ""
Body_length "" "" "" "" "" "" "" "" ""
Body_weight "" "" "" "" "" "" "" "" ""
T3_PDW T3_PT T3_aPTT T3_fibrinogeen T3_cephotest T3_hsCRP T3_hscTnT T3_Urea T3_creatinine T3_proBNP T4_Hemoglobin
Age_inclusion "" "" "" "" "" "" "" "" "" "" ""
Body_length "" "" "" "" "" "" "" "" "" "" ""
Body_weight "" "" "" "" "" "" "" "" "" "" ""
T4_Hematocrit T4_Leukocytecount T4_Monocytecount T4_Plateletcount T4_MPV T4_PDW T4_PT T4_aPTT T4_fibrinogeen
Age_inclusion "" "" "" "" "" "" "" "" ""
Body_length "" "" "" "" "" "" "" "" ""
Body_weight "" "" "" "" "" "" "" "" ""
T4_cephotest T4_hsCRP T4_hscTnT T4_Urea T4_creatinine T4_proBNP Surgery_date Surgery_duration Epidural
Age_inclusion "" "" "" "" "" "" "" "" ""
Body_length "" "" "" "" "" "" "" "" ""
Body_weight "" "" "" "" "" "" "" "" ""
Peroperative_heparin Transf_ery Transf_trombo Transf_plasma No_hypotensive_episodes Blood_loss Cell_saver FU_Postop_MI
Age_inclusion "" "" "" "" "" "" "" ""
Body_length "" "" "" "" "" "" "" ""
Body_weight "" "" "" "" "" "" "" ""
FU_CAG_or_PCI FU_Other_Intervention FU_Stroke FU_renalinsufficiency FU_infection FU_sepsis FU_arrhythmia FU_mortality
Age_inclusion "" "" "" "" "" "" "" ""
Body_length "" "" "" "" "" "" "" ""
Body_weight "" "" "" "" "" "" "" ""
Date_discharge dayshospitilization DeltatropT1 DeltatropT2 DeltatropT3 DeltatropT4 DeltatropT2T3 DeltatropT2T4 MINSdelta
Age_inclusion "" "" "" "" "" "" "" "" ""
Body_length "" "" "" "" "" "" "" "" ""
Body_weight "" "" "" "" "" "" "" "" ""
Peakdeltatrop MINSabs Deltacreat12 Deltacreat13 Deltacreat14 Smokingbinair VerifyNowcateg GFR_1 GFR_2 GFR_3
Age_inclusion "" "" "" "" "" "" "" "" "" ""
Body_length "" "" "" "" "" "" "" "" "" ""
Body_weight "" "" "" "" "" "" "" "" "" ""
GFR_4 GFRdelta11 GFRdelta12 GFRdelta13 GFRdelta14 ARUgreater550 ARUgrT1 ARUgrT2 ARUgrT3 ARUgrT4 tropbaselinehigh
Age_inclusion "" "" "" "" "" "" "" "" "" "" ""
Body_length "" "" "" "" "" "" "" "" "" "" ""
Body_weight "" "" "" "" "" "" "" "" "" "" ""
ASPI40T2 ASPI40T3 ASPI40T4 Peak_troponin Peak_Psel Corres_Peak_trombocytes Peak_trombocytes Corres_Peak_Verifynow
Age_inclusion "" "" "" "" "" "" "" ""
Body_length "" "" "" "" "" "" "" ""
Body_weight "" "" "" "" "" "" "" ""
Peak_Verifynow Corres_Peak_multiplate_ADP Peak_multiplate_ADP Corres_Peak_multiplate_TRAP Peak_Multiplate_TRAP
Age_inclusion "" "" "" "" ""
Body_length "" "" "" "" ""
Body_weight "" "" "" "" ""
Corres_Peak_multiplate_ASPI Peak_Multiplate_ASPI Corres_Peak_Fibrinogen Peak_Fibrinogen
Age_inclusion "" "" "" ""
Body_length "" "" "" ""
Body_weight "" "" "" ""
[ reached getOption("max.print") — omitted 261 rows ]
Warning message:
In sqrt(npair – 2) : NaNs produced
#The right variables seem to be dropped this time, but only few nummeric correlations appear as you can see. What might be the issue?
LikeLiked by 1 person
Dear Paul, thanx for the nice script. I am running into a problem when using your script on the database:
the script seems to drop almost all the nummeric variables(according to the str(..function) and provides the following errors:
Warning messages:
1: In sqrt(npair – 2) : NaNs produced
2: In pt(abs(h) * sqrt(npair – 2)/sqrt(pmax(1 – h * h, 0)), npair – :
NaNs produced
Do i need to prepare my database in a different way? What to do to resolve this issue?
Thanks in advance,
Regards
LikeLike
Though thisis still not a reproducible example, I can guess where it goes wrong. You are calculating spearmans correlation coefficient, which is a coefficient for ordinal variables. Your numeric variables are continuous though. Could this be the problem?
LikeLike
ah thanx! I see that the max omitted was low thus only 3 variable were shown! How do I best can see the whole matrix? Just just option(max.print=etc? Is there a better way to have an overview of the whole matrix? As still a majority of the nummerical variables are not appearing.
I do still get the warning signs:
1: In sqrt(npair – 2) : NaNs produced
2: In pt(abs(h) * sqrt(npair – 2)/sqrt(pmax(1 – h * h, 0)), npair – :
NaNs produced
LikeLike
Hi Paul, I am a newbie R user here and it looks like this is exactly what I need for my research. I just have one question (and it might be a stupid one) but how do I install the package to be able to use the script?
LikeLike
Hi Gijs, this is exactly a great question, and I see how it was not directly clear.
I did not “package” this function up unfortunately.
If you want to use this in your project, I suggest you copy all the code blocks into a new R script, which you can name “correlation.R” or something like that.
Then, in your actual script, you “source” in these correlation matrix functions using `source(“your_directory_path_here/correlation.R”)`. R then runs the script with these functions in it, and they will appear in your environment for you to use in your analysis.
Hope this helps!
LikeLike
Beautiful! Thanks you so much for the speedy reply!
LikeLike
Another question. Any idea how I can add the p-values corresponding to each *, **, ***?
LikeLike
What do you mean? The correlation_matrix function already adds those stars, I believe. You can change what significance levels and what symbols (*) are used in the code there. If you want to add textual representation of what * ** and *** are, I would do so in R markdown, or manually.
LikeLike
Ah sorry if I wasnt clear. I actually want to know what p-value corresponds to what *. I have *, ** and *** in my table but don’t know which they are. Or is it a standard? so ie: * < 0.1, **<0.05 and ***<0.01?
LikeLike
Jep, but you can double check and even change it in the code. Have a look at the correlation_matrix function.
LikeLike
Ah yes, that makes sense. Did not think to look there. Thank you so much for all your help.
LikeLiked by 1 person
Hi, how do I get an output in R without the quotation marks (“)? example below
a254 “1.000 ” “0.970 ” “-0.055” “0.973 ” “0.432 ” “-0.773” “0.704 ” “0.735 ” “-0.755” “0.738 ” “-0.749”
E2_E3 “0.970 ” “1.000 ” “-0.226” “0.986 ” “0.332 ” “-0.711” “0.534 ” “0.558 ” “-0.583” “0.771 ” “-0.624”
E4_E6 “-0.055” “-0.226” “1.000 ” “-0.136” “0.555 ” “-0.261” “0.549 ” “0.515 ” “-0.492” “0.064 ” “-0.352”
LikeLike
R needs the quotation marks to identify that the data are text strings. The data need to be text strings in order to be able to display the numbers in this specific format (3 decimals + significance signs).
There is a trick to print data without the quotation marks. You can use the cat() function. But I think you would need to write a for loop of some sort with spacing logic in order to retain the matrix table structure…
LikeLike
Hi Paul,
As a new R user this is a really useful function, thank you!
I have successfully created my correlation table, however, I am encountering an error when trying to use the save_correlation_matrix function.
I created my correlation table using the following command:
save_correlation_matrix(dum.cor.table,
filename = “Dummy data correlation table.csv”,
digits = 3,
use = “lower”)
I then tried to save the table using the following command:
save_correlation_matrix(df = dum.cor.table,
filename = “dummy-data-correlation-table.csv”,
digits = 3,
use = “lower”)
And I receive the following error:
Error in Hmisc::rcorr(x, type = type) : must have >4 observations
Any help would be greatly appreciated!
LikeLike
Hi Ben! It seems to me that one of your correlation analyses has less than 4 observations to work with. If your dataset is larger, than this is probably due to missing values in either of the respective colums. This is not something I knew would produce an error. The error does not come from my function, but from the rcorr funnction that belongs to the Hmisc package. I don’t know how to solve this except by removing one of the respective columns. Sorry 😦
LikeLike
Thanks for the great functions! Can you provide a citation so I can credit your work in a publication? Sorry if I missed this before while looking for one.
LikeLike
Hi Evan, thanks for your nice words and asking for a reference. I’d use the formats listed here: https://www.easybib.com/guides/citation-guides/how-do-i-cite-a/how-to-cite-a-blog/#:~:text=Author's%20Last%20Name%2C%20Author's%20First,section%20name%20(if%20applicable).
So something like: van der Laken, P.A. (2020, July 28). Create a publication-ready correlation matrix, with significance levels, in R. paulvanderlaken.com. https://paulvanderlaken.com/2020/07/28/publication-ready-correlation-matrix-significance-r/comment-page-1/#comment-27232
LikeLike
I really appreciate your function! I would love if you made it available as a package or on a github page so we can call it directly
Cheers!
LikeLike
Great suggestion Lucas! Let me put packaging this up on my to-do list. Don’t expect anything soon though! 😉
LikeLike
Hi Paul,
I am having some issuse with R picking up the correlation matrix function in the Hmisc package..I am using Rmarkdown
“`{r}
library(ggcorrplot)
library(dplyr)
library(Hmisc)
library(corrplot)
library(corrr)
library(tidyverse)
“`
#Data
“`{r}
my_dat<-dat[,c(6:28)]
str(my_dat)
“`
“`{r}
cor(my_dat[,c(1:23)], use="complete.obs")
“`
“`{r}
Hmisc::rcorr(as.matrix(my_dat[,1:23]))
“`
“`{r}
correlation_matrix(my_dat[,1:23], digits=2, use="lower",replace_diagonal=TRUE)
“`
Error in correlation_matrix(my_dat[, 1:23], digits = 2, use = "lower", :
could not find function "correlation_matrix"
LikeLike
Hi Wani, this function is not part of the HMisc package. You either need to run the code above, or put it in a seperate .R file and source() it in.
LikeLike
Thank you so much!! You saved me so much time and mental struggle to format the tables! Appreciate it so so much!
LikeLike
Hi, I just to here to say thank you for your job. It save me to finish my paper. You can’t image how long I Google this question … BTW, I wish you can add the usage method in post if you can, I scroll many reply to see how to use it. anyway, appreciate your jobs again!
LikeLike
And I want to ask another question: I made a csv file, and there are annoying “;” in the file, and all data were listed in one column. Here is the pic.
https://imgtu.com/i/OyCE6g
LikeLike
That’s because of the different file formats on Windows/OS & US/European computers. You can either use Excel’s TEXT TO DATA feature or its IMPORT DATA feature. You can probably find how-to’s on google!
LikeLike
Wow! Thanks a lot! I follow your method and it success! Bravo jobs!
BTW, I found the sjPlot package could also export correlation table but it just html format. You can check it out if you want.
Cheers! Best wish!
LikeLike
Hi, I am still having trouble with correlation_matrix. Sometimes it works but most times it gives an error saying ” could not find function “correlation_matrix”” when i reach that code, so i ran it in a clean r script as below and still get the error
library(ggcorrplot)
library(dplyr)
library(Hmisc)
library(corrplot)
library(corrr)
library(tidyverse)
library(readxl)
#Data
dat <- read_excel("LHISTHO20_R analysis.xlsx",
sheet = "harvest data")
dat % mutate(across(c(1:5), factor))
str(dat)
my_dat<-dat[,c(6:111)]
str(my_dat)
cor(my_dat[,c(1:106)],use="complete.obs")
Hmisc::rcorr(as.matrix(my_dat[,1:106]))
correlation_matrix(my_dat)
correlation_matrix(my_dat[,1:106],digits=2,use="lower",replace_diagonal = TRUE)
save_correlation_matrix(df=my_dat, filename="Harvest-correlation-matrix2.csv", digits=2,use="lower")
LikeLike
Hi Wani, you need to run or source the function’s code. Otherwise R does not know what correlation_matrix is. It is not a function that is included in Hmisc
LikeLike
Hi Paul,
I am sorry, I am a bit new to R so could you help me out a bit more here… what is the source code of this function? …
LikeLike
The code you see in this blog post. You need to copy it into your r script. All of it
LikeLike
You are a legend! Thanks.
LikeLike
Thank you very much for sharing your code. I have many time series groups (30 groups, each with 3 series) and this is very helpful to analyse this in a much faster way 😉 I investigating the within group correlation and for that I use your function with the following code:
# 1. generate a list with 30 dataframes, each with 3 columns
lst1 <- list()
for (i in seq(30)) {
lst1[[i]] = data.frame(x=runif(100), y=rnorm(100), z=rnorm(100))
}
#this works fine, I get for every group the correlation matrix
cor <- lapply(Filter(\(x) ncol(x) == 3, lst1), \(x) list(correlation_matrix(x[1:3], use = "upper")))
cor
#but here is the problem. It just export one, the last, dataframe. It is possible to export a lists of results with your function?
lapply(Filter(\(x) ncol(x) == 3, lst1), \(x) list(save_correlation_matrix(x[1:3], filename = "cortest.csv")))
LikeLike
Great to hear you are liking the package.
I hadn’t thought about this use case when I designed the package, unfortunately.
Maybe, if you need to save multiple correlation matrixes, you include the save matrix in the lapply or in your loop? Or loop over the list with results from your apply and save each correlation matrix individually?
I’m not sure how to solve this sorry.
LikeLike
Hi! This code was very useful to me and helped me figure out how to format polychoric correlation matrices I had already made. Many many thanks for this!
I wonder if anyone has figured out a way to have R print a table like this in the plot viewer? (like stargazer and sjplot can do for model objects)
Sometimes you just need to show your supervisor a bunch of correlation patterns and discuss them.
I’d like to make the process of saving the matrix, opening it in excel or numbers, copying it and pasting it in powerpoint, and adjusting the size more efficient, but I’m not sure how to save tables as plots in R.
LikeLike