
Having trouble understanding how to interpret distribution plots? Or struggling with Q-Q plots? Sven Halvorson penned down a visual tutorial explaining distributions using visualisations of their quantiles.

Because each slice of the distribution is 5% of the total area and the height of the graph is changing, the slices have different widths. It’s like we’re trying to cut a strange shaped cake into 20 equal pieces using parallel cuts. The slices at the center must be thinner since the distribution is denser (taller) than on the edges.
Sven on distribution signatures
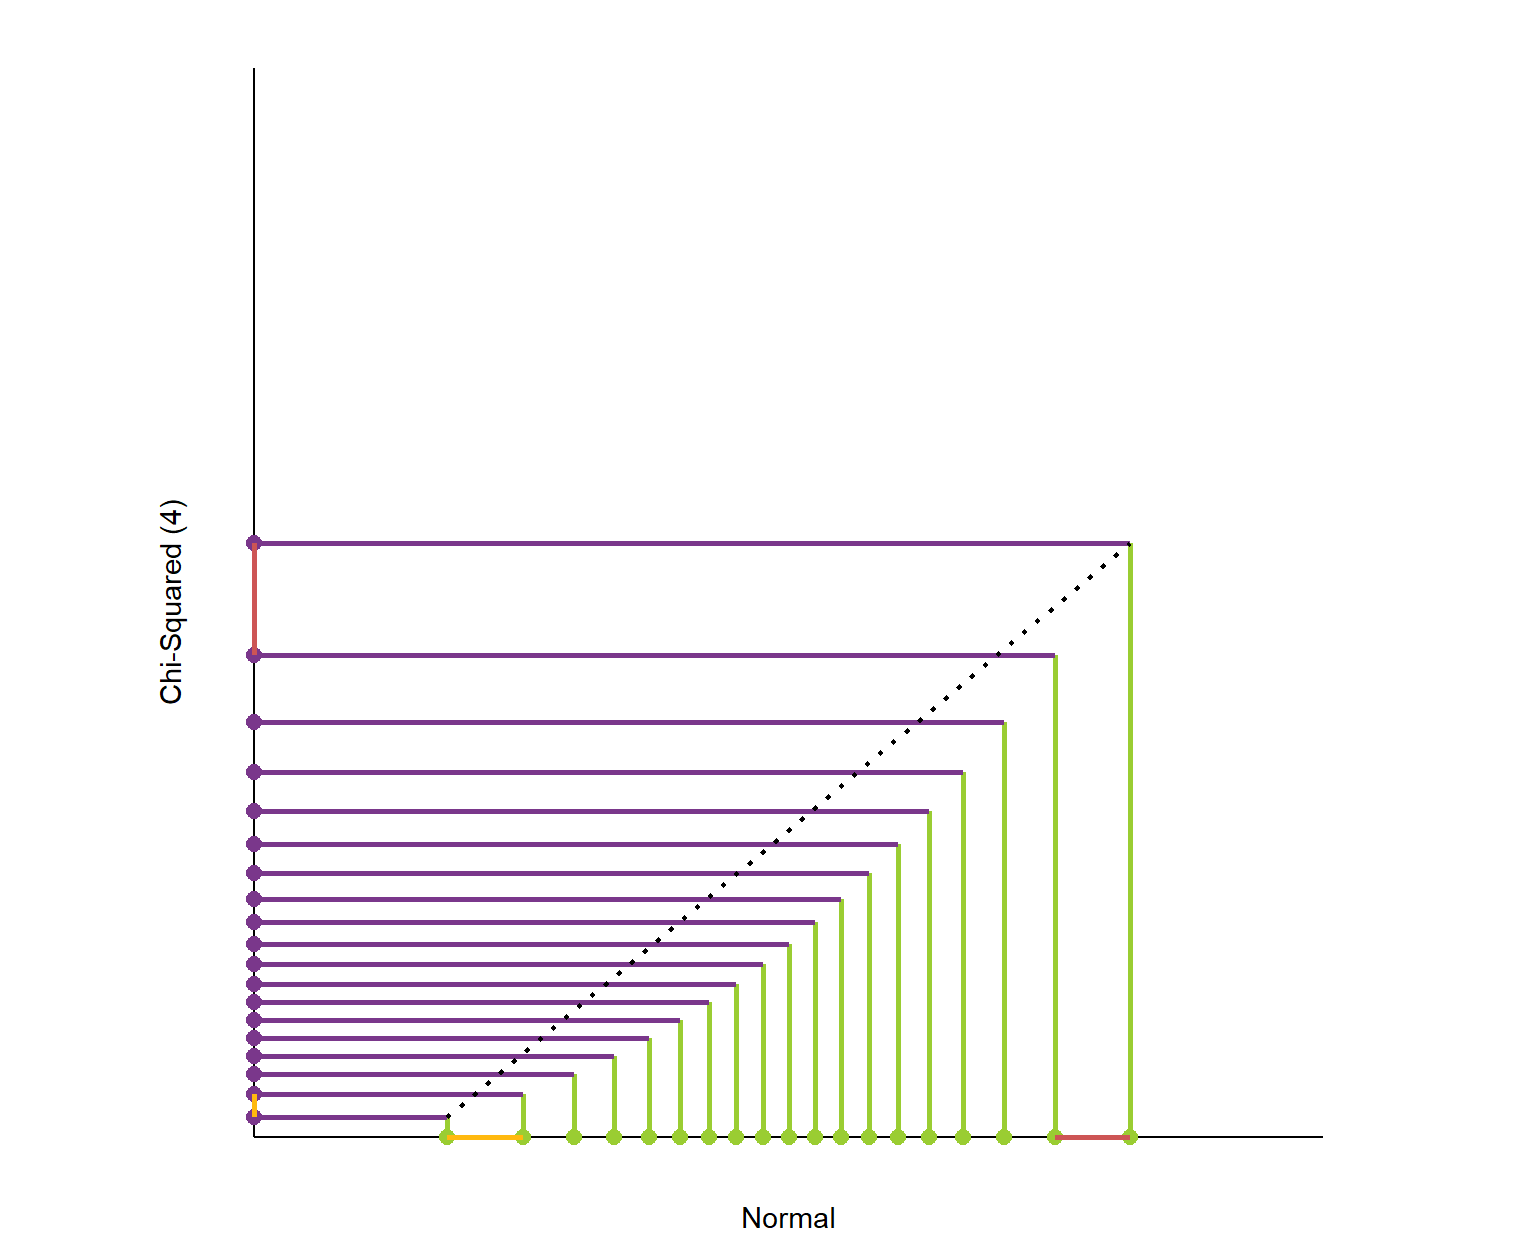
Here is the plot of matching the quantiles of the chi-squared(4) and normal distributions. I’ve again plotted these quantiles over 98% of each distribution’s range. The chi-squared distribution is skewed so its quantiles are packed into a smaller portion of its axis.
What is this graph telling us? It shows that the exchange rate between the quantiles of the two distributions is not constant.
Sven on distribution signatures
Here’s the link to the original article, and the R markdown code on github to generate the webpage.
