Computerphile is a Youtube sister channel of Numberphile. Where Numberphile’s videos are about the magic behind match and numbers, Computerphile’s videos are all about computers and computer stuff. I recommend both channels in general, and have watched many of their videos already.
Yet, over the past weeks I specifically enjoyed what seems to be several series of videos on Cyber Security related topics.
What makes a good password?
One series is all about passwords.
What are strong passwords, which are bad? How can hackers crack yours? And how do websites secure user passwords?
The videos below are in somewhat of the right order and they make for an interesting insight in the world of password management. They give you advice on how to pick you password, and even a nice tool to check whether your password has ever been leaked.
Probably, you will want to change your password afterwards!
Hacking and attacking
If you are up to no good, please do not watch this second series, which revolves all around hacks and computer attacks.
How do people get access to a websites database? How can we prevent it? How can we recognize security dangers?
You might know of SQL injections, but do you know what a slow loris attack is? Or how ransomware works? Or what exploitX is?
These videos nicely continue the line of a previous post on Try Hack Me’s Cyber Security Challenges, where you can learn how computers work and where there vulnerabilities lie.
The R programming language has seen the integration of many languages; C, C++, Python, to name a few, can be seamlessly embedded into R so one can conveniently call code written in other languages from the R console. Little known to many, R works just as well with JavaScript—this book delves into the various ways both languages can work together.
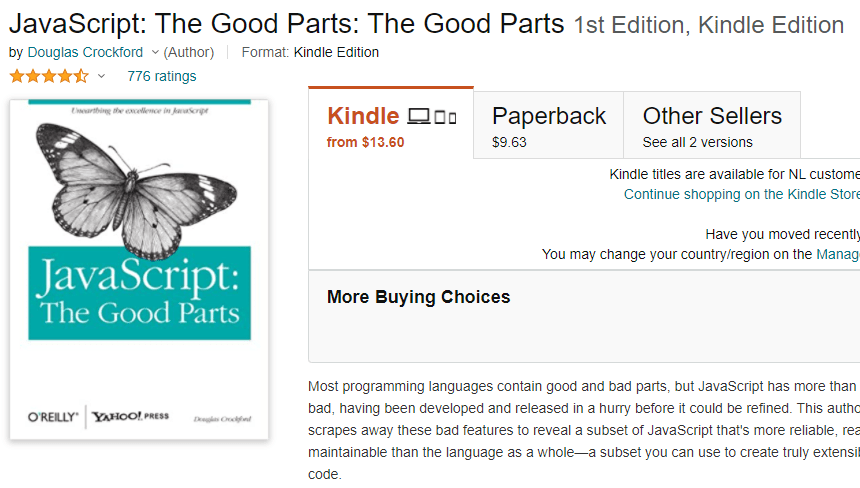
John Coene is an well-known R and JavaScript developer. He recently wrote a book on JavaScript for R users, of which he published an online version free to access here.
The book is definitely worth your while if you want to better learn how to develop front-end applications (in JavaScript) on top of your statistical R programs. Think of better understanding, and building, yourself Shiny modules or advanced data visualizations integrated right into webpages.
A nice step on your development path towards becoming a full stack developer by combining R and JavaScript!
Yet most R developers are not familiar with one of web browsers’ core technology: JavaScript. This book aims to remedy that by revealing how much JavaScript can greatly enhance various stages of data science pipelines from the analysis to the communication of results.
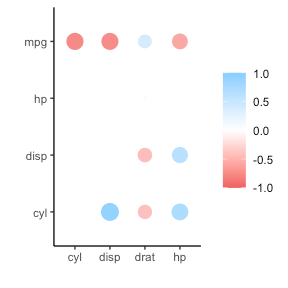
In most (observational) research papers you read, you will probably run into a correlation matrix. Often it looks something like this:
In Social Sciences, like Psychology, researchers like to denote the statistical significance levels of the correlation coefficients, often using asterisks (i.e., *). Then the table will look more like this:
Regardless of my personal preferences and opinions, I had to make many of these tables for the scientific (non-)publications of my Ph.D..
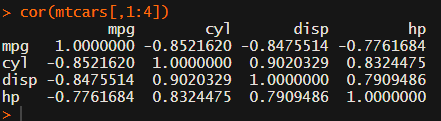
I remember that, when I first started using R, I found it quite difficult to generate these correlation matrices automatically.
Yes, there is the cor function, but it does not include significance levels.
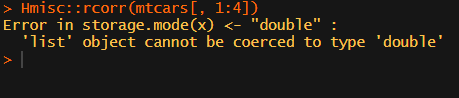
Then there the (in)famous Hmisc package, with its rcorr function. But this tool provides a whole new range of issues.
What’s this storage.mode, and what are we trying to coerce again?
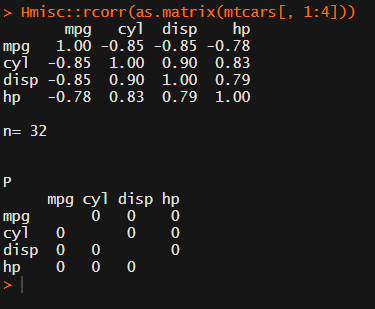
Soon you figure out that Hmisc::rcorr only takes in matrices (thus with only numeric values). Hurray, now you can run a correlation analysis on your dataframe, you think…
Yet, the output is all but publication-ready!
You wanted one correlation matrix, but now you have two… Double the trouble?
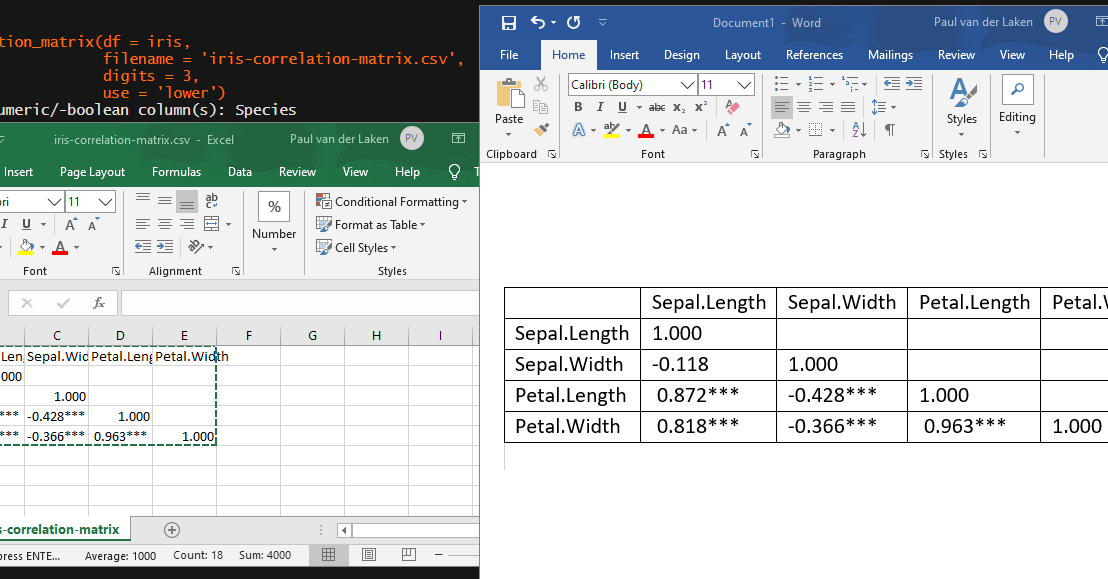
[UPDATED] To spare future scholars the struggle of the early day R programming, Laura Lambert and I created an R package corrtable, which includes the helpful function correlation_matrix.
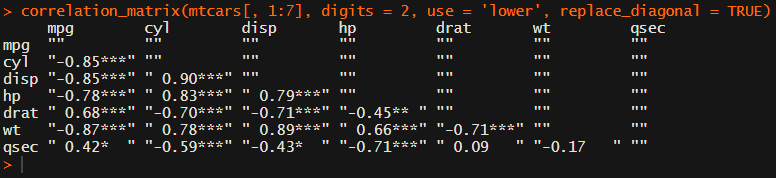
This correlation_matrix takes in a dataframe, selects only the numeric (and boolean/logical) columns, calculates the correlation coefficients and p-values, and outputs a fully formatted publication-ready correlation matrix!
For instance, you can use only 2 decimals. You can focus on the lower triangle (as the lower and upper triangle values are identical). And you can drop the diagonal values:
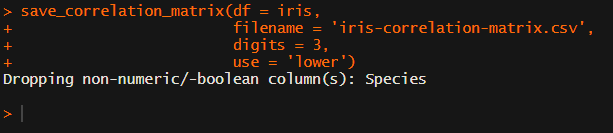
Or maybe you are interested in a different type of correlation coefficients, and not so much in significance levels:
David Robinson (aka drob) is one of the best known R programmers.
Since a couple of years David has been sharing his knowledge through streaming screencasts of him programming. It’s basically part of R’s #tidytuesday movement.
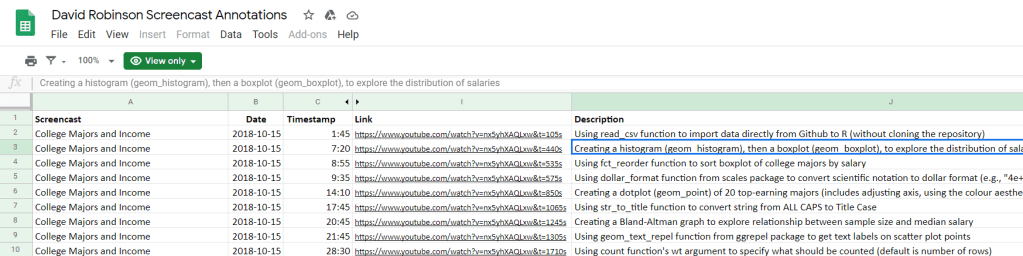
Alex Cookson decided to do us all a favor and annotate all these screencasts into a nice overview.
Here you can search for video material of David using a specific function or method. There are already over a thousand linked fragments!
Very useful if you want to learn how to visualize data using ggplot2 or plotly, how to work with factors in forcats, or how to tidy data using tidyr and dplyr.
For instance, you could search for specific R functions and packages you want to learn about:
Thanks David for sharing your knowledge, and thanks Alex for maintaining this overview!