Cover image via wikihow.com/Read-a-Scientific-Paper
Reddit is a treasure trove of random stuff. However, every now and then, in the better groups, quite valuable topics pop up. Here’s one I came across on r/statistics:
Particularly the advice by grandzooby seemed worth a like, and he linked to several useful resources which I’ve summarized for you below.
An 11-step guide to reading a paper
Jennifer Raff — assistant professor at the University of Kansas — wrote this 3-page guide on how to read papers. It elaborates on 11 main pieces of advice for reading academic papers:
- Begin by reading the introduction, skip the abstract.
- Identify the general problem: “What problem is this research field trying to solve?”
- Try to uncover the reason and need for this specific study.
- Identify the specific problem: “What problems is this paper trying to solve?”
- Identify what the researchers are going to do to solve that problem
- Read & identify the methods: draw the studies in diagrams
- Read & identify the results: write down the main findings
- Determine whether the results solve the specific problem
- Read the conclusions and determine whether you agree
- Read the abstract
- Find out what others say about this paper
Jennifer also dedicated a more elaborate blog post to the matter (to which u/grandzooby refers).
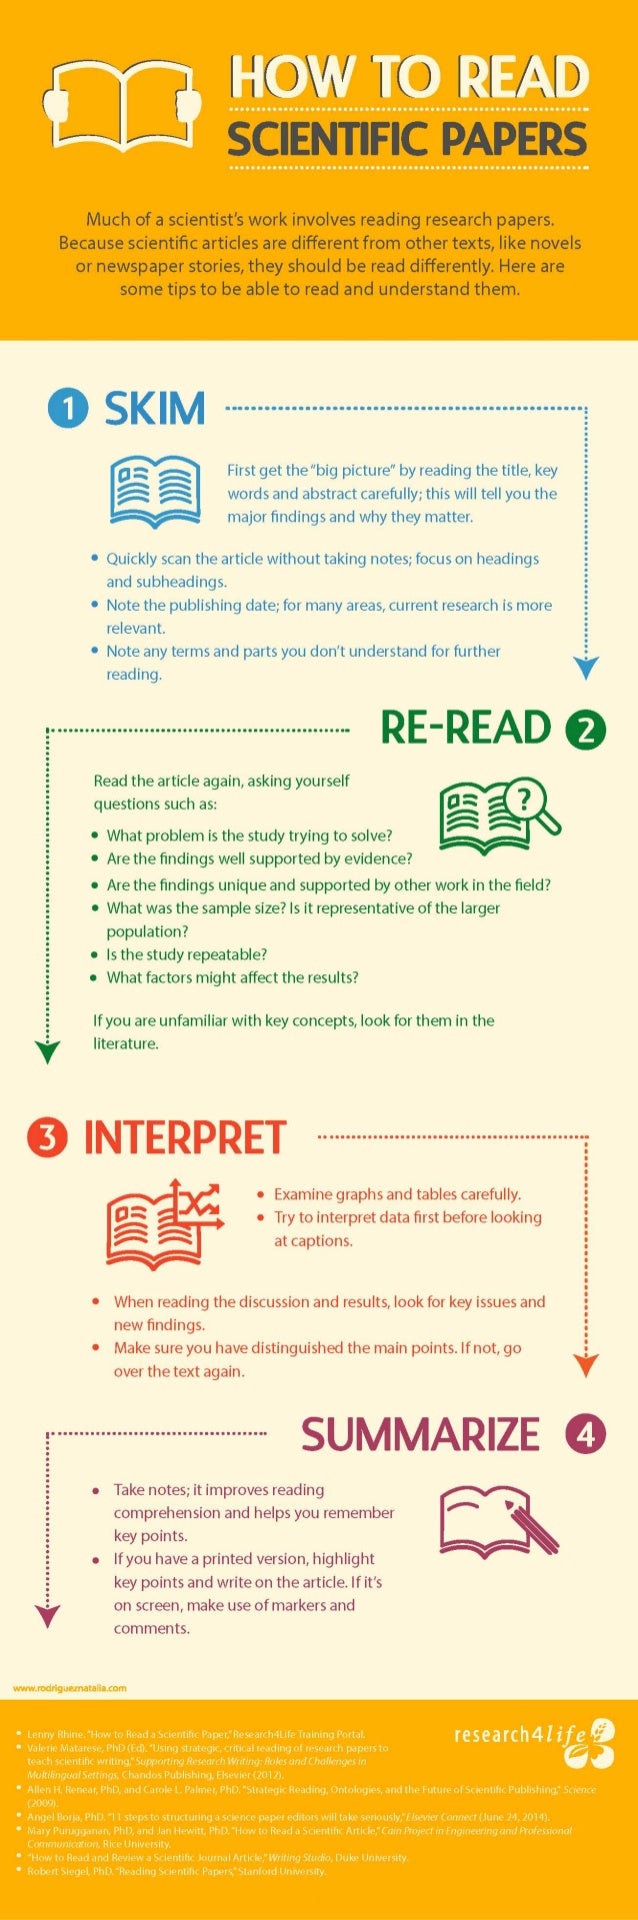
4-step Infographic
Natalia Rodriguez made a beautiful infographic with some general advice for Elsevier:
How to take notes while reading
Mary Purugganan and Jan Hewitt of Rice University propose slightly different steps for reading academic papers. Though they seem more general pointers to keep in mind to me:
- Skim the article and identify its structure
- Distinguish its main points
- Generate questions before and during reading
- Draw inferences while reading
- Take notes while reading
Regarding the note taking Mary and Jan propose the following template which may proof useful:
- Citation:
- URL:
- Keywords:
- General subject:
- Specific subject:
- Hypotheses:
- Methodology:
- Results:
- Key points:
- Context (in the broader field/your work):
- Significance (to the field/your work):
- Important figures/tables (description/page numbers):
- References for further reading:
- Other comments:
Scholars sharing their experiences
Science Magazine dedicated a long read to how to seriously read scientific papers, in which they asked multiple scholars to share their experiences and tips.
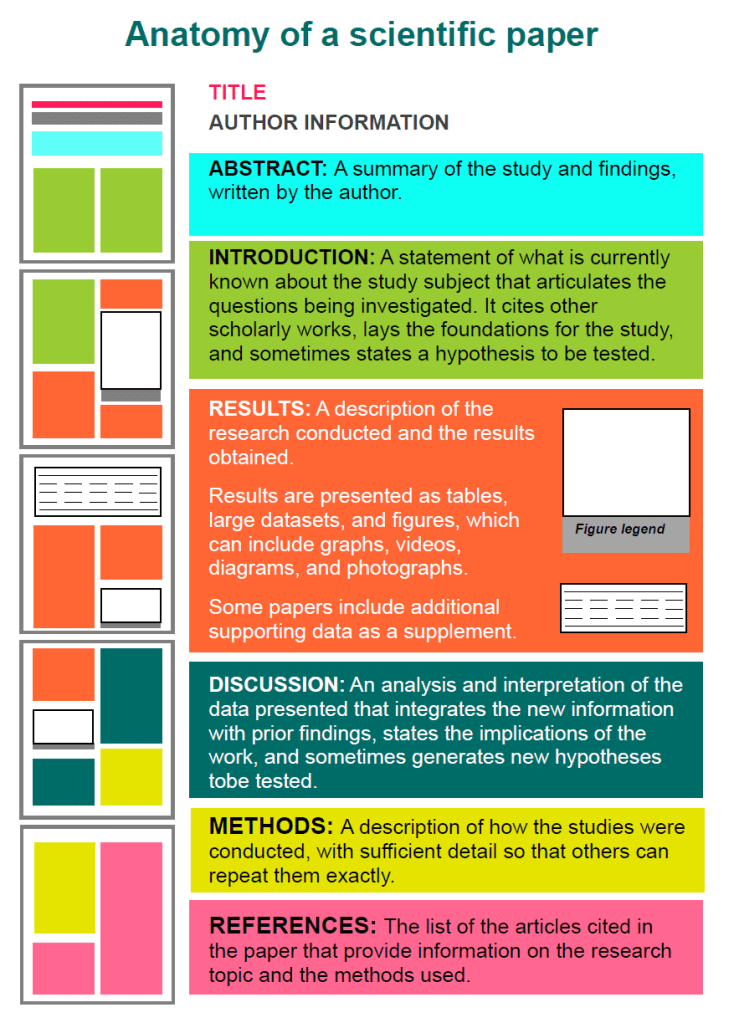
Anatomy of a scientific paper
This 13-page guide by the American Society of Plant Biologists was recommended by some, but I personally don’t find it as useful as the other advices here. Nevertheless, for the laymen, it does include a nice visualization of the anatomy of scientific papers:
Learning How to Learn
One reddit user recommend this Coursera course, Learning How to Learn: Powerful mental tools to help you master tough subjects. It’s free, and can be taken in English, but also Portuguese, Spanish, or Chinese.
This course gives you easy access to the invaluable learning techniques used by experts in art, music, literature, math, science, sports, and many other disciplines. We’ll learn about the how the brain uses two very different learning modes and how it encapsulates (“chunks”) information. We’ll also cover illusions of learning, memory techniques, dealing with procrastination, and best practices shown by research to be most effective in helping you master tough subjects.
https://www.coursera.org/learn/learning-how-to-learn