Tracey Weissgerber, Natasa Milic, Stacey Winham, and Vesna Garovic wrote this interesting 2015 paper on bar graphs. By a systematic review of physiology research, they demonstrate we need to reconsider how we present continuous data in small samples.
Bar and line plots are commonly used to display continuous data. This is problematic, as many different data distributions can lead to the same bar or line graph. Nevertheless, the rarely used scatterplots, box plots, and histograms much better allow users to critically evaluate continuous data.
They provide many interesting visuals that underline their argument.
For instance, the four datasets below (B, C, D, and E) will all result in the same barplot (A), whereas they demonstrate quite different characteristics.
Alternatively, bar plots are often used for to display group means when observations within groups may not be independent. For instance, it could be that the bars below represent two measurement occassians, and that each of our sampled observations occurs in both. In that case, the scatterplots with connected dots may be more suitable. While the bars in plot A would represent datasets B, C, and D, these are clearly different when viewed in scatterplots.
Also, a lot of meaningful information is typically lost in bar plots. For instance, the number of observations in a group. But also the distribution of values. While the former can be added (see B below), the latter can much better be shown in a scatter plot like C (below).
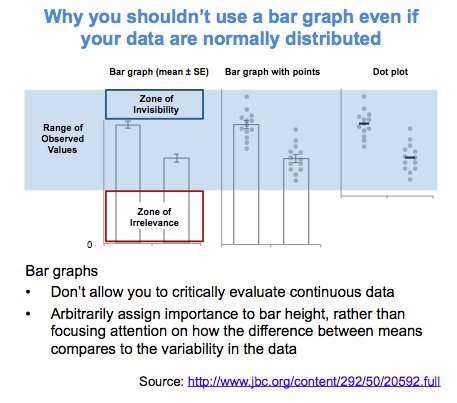
Actually, in a later blog post, lead researcher Tracey Weissgerber shares the below visual. It highlights the distractive irrelevance of bar plot and the information that is lost (becomes invisible) when opting for a bar chart.
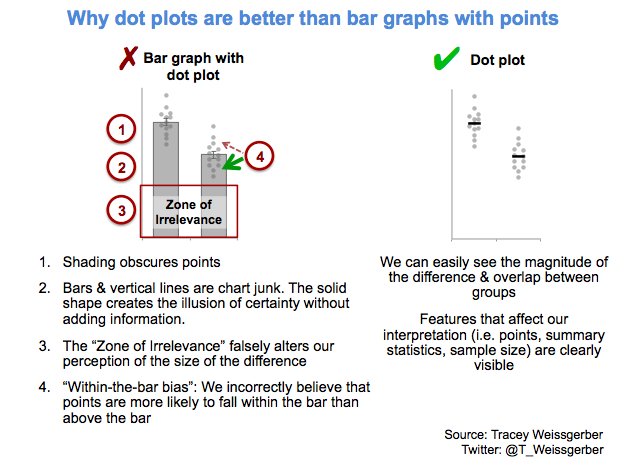
Tracey refactored this into a similar visual of her own:
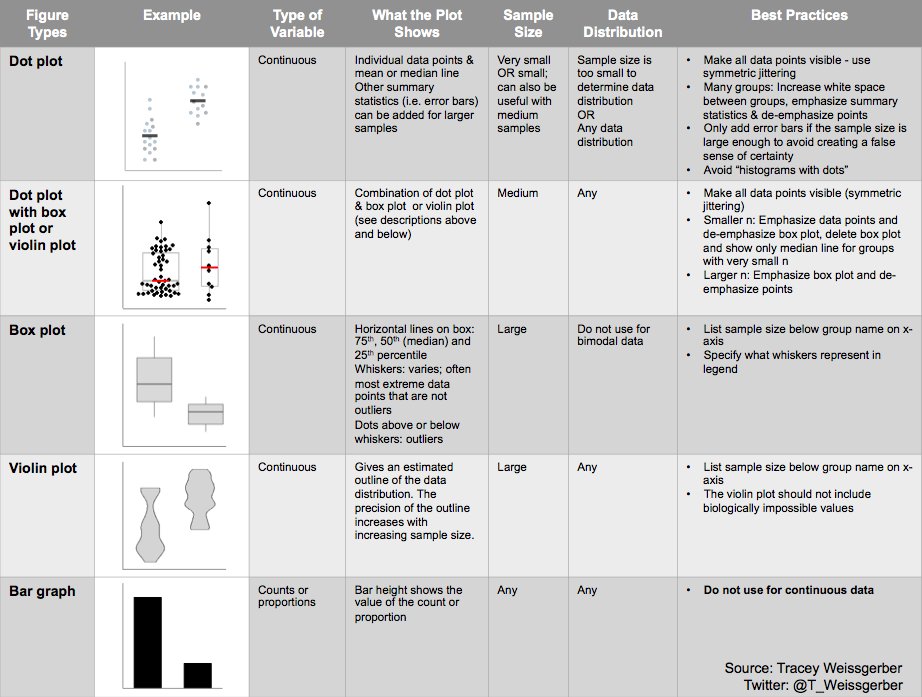
So what can you do instead, you may ask yourself. To this question too, Tracey has an answer, sharing the below overview of alternatives options:
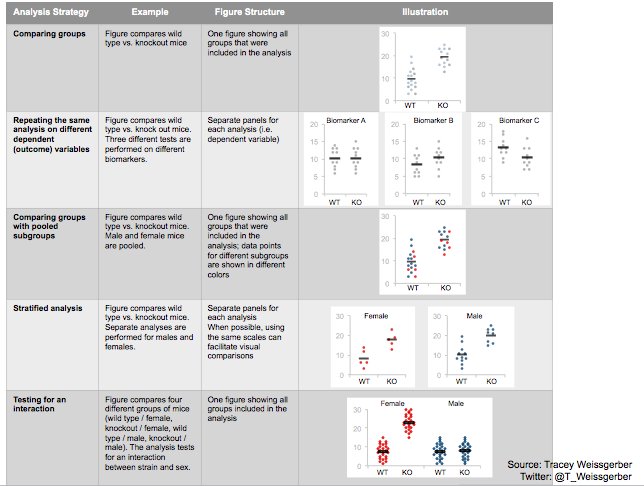
She made another overview which may help you pick the best visual for your data. This one takes your intention behind the visual as a starting point, though is unfortunately a bit low quality: