
Hugo Toscano wrote a great blog providing an overview of all the helpful functionalities of the R forcats package. The package includes functions that help handling categorical data, by setting a random or fixed order, and by recategorizing or anonymizing. These functions are specifically helpful when visualizing data with R’s ggplot2.
A comprehensive overview is provided in the form of the RStudio forcats cheat sheet, but, on his blog, Hugo demonstrates some of its functionalities using a dataset on suicides and people’s ages:
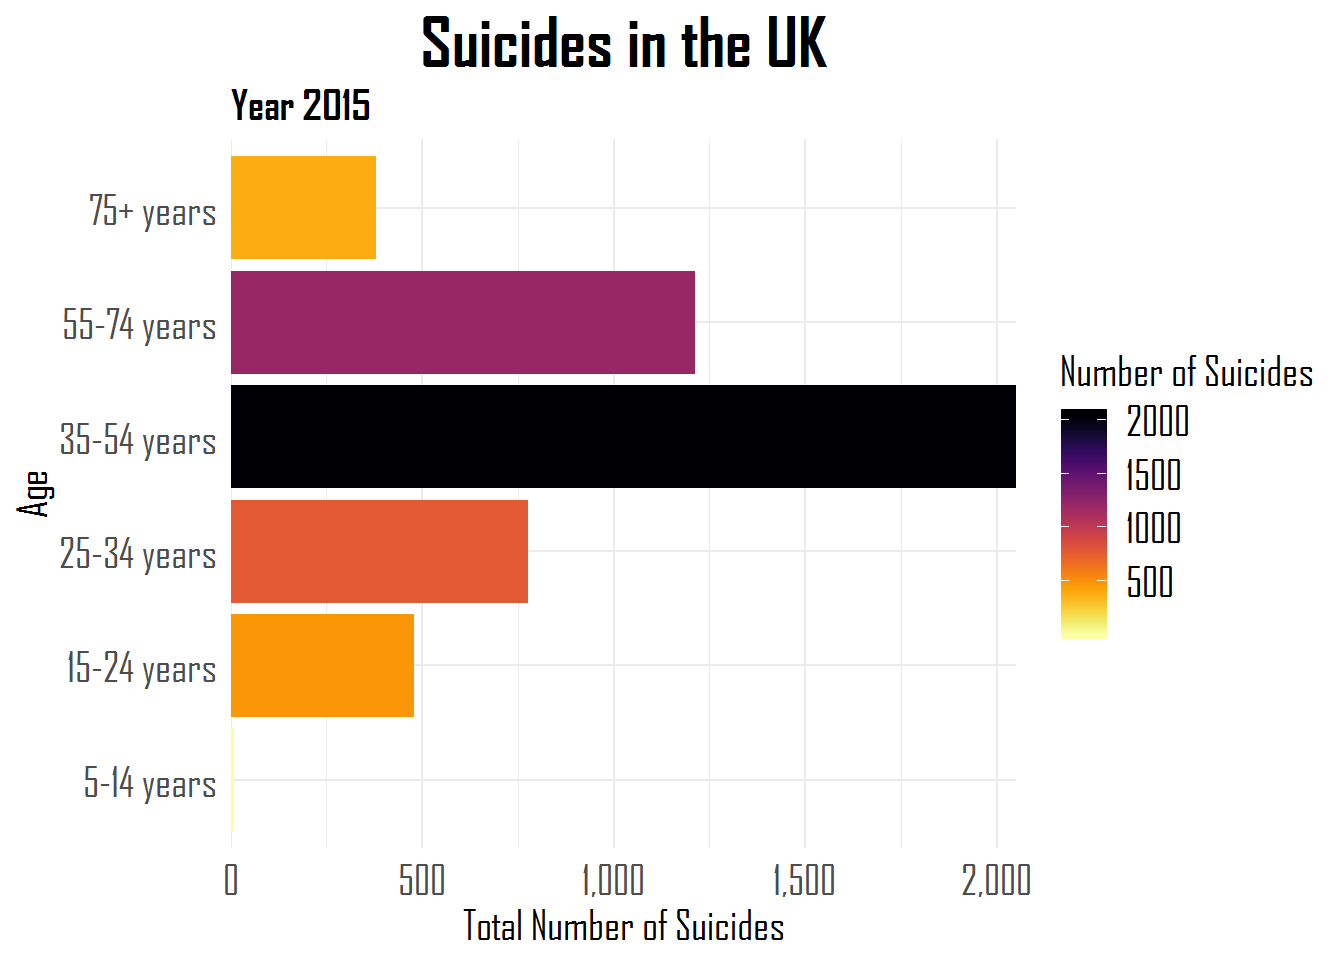
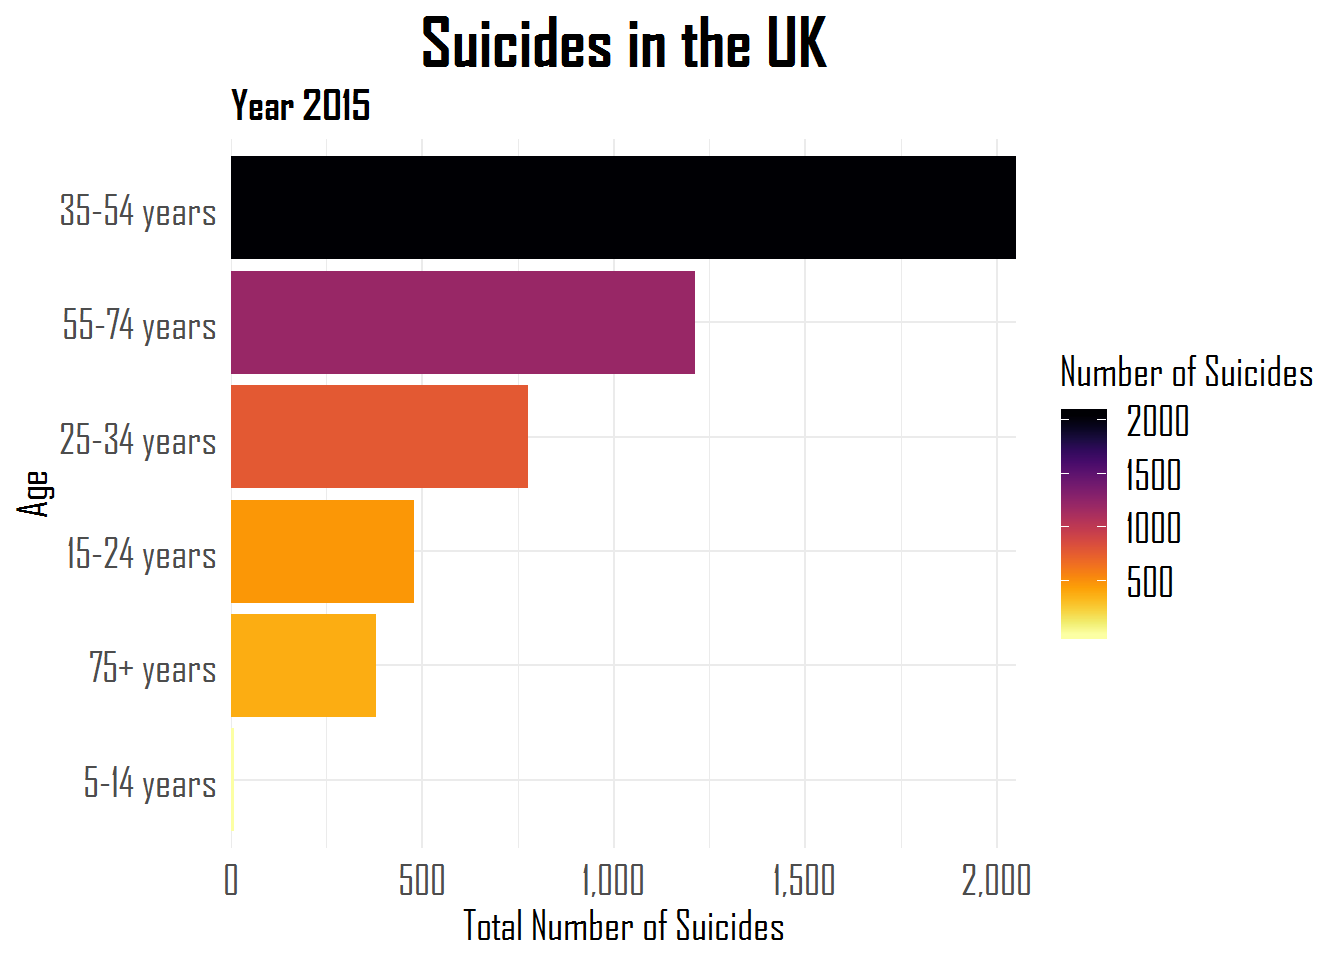
For instance, you might want to reorder the categories using forcats::fct_reorder.
Other functions can be used to automatically surpress infrequent categories, to reverse the order of categories, to shuffle or shift categories, to quickly relabel or anonimize categories, and many more…
Have a look at Hugo’s original blog: https://toscano84.github.io/2019/05/factors-in-r-forcats-to-help/
Alternatively, the tidyverse helppage is also a good starting point: https://forcats.tidyverse.org/
