I’ve been blogging for just over three years now. Writing my first blogs in January 2017 in a small café in London out of pastime, I had never imagined that I would actually attract a readership. And while my blog grew in visitors and followers, it always remained just a hobby for me to summarize and post stuff I was reading or working on at the time.
Still, I want to make sure that you — my readership — get the most out of the time I invest in my blogs. Some blogs are more interesting than others, I am aware. However, I notice that it’s not only the content, but also the time and momentum of posting that draws in you readers.
Hence, I propose the following: Rather than erratically posting everything at the time of writing, I’m going to provide you with some regularity. As of today…
I will post a new blog every Tuesday, at 15:00 GMT+1
“Why that specific time?” I hear you asking. Well, it’s the perfect time as all my followers are still awake on the same day!
My Asian followers can read the blog just before or in bed,
My African and European readers can look forward to their commute home, and
My North- and South-American fans can enjoy it with their morning coffee!
Join 383 other subscribers
Over the course of last year, I posted nearly 100 blogs. If you do some quick maths, you will conclude that 1 post every Tuesday is a lot less.
And this is where you come in:
Please let me know at what time you would prefer to have me post a second blog every (other) week. You can do so in the comments, by sending me a direct message, or by reaching out to me on twitter or LinkedIn.
This blog by Gordon Shotwell has passed my Twitter feed a couple of times now and I thought I’d share it here: blog.shotwell.ca/posts/why_i_use_r
It in, Gordon present his reasons for using R, describing R’s four unique selling point, and outlining a discussion full of perfectly quotable thoughts and opinions.
Do have a look at the original blog as well, but here’s my 3-minute summary:
Gordon finds that there are four main features of the R programming language that are essential to his work and in a sense unique to the R language. Here they are, along with quotes by Gordon explaining R’s unique selling points in his words:
(1) Native data science structures
It’s relatively easy to do data science in R without any external libraries. You can read data from a csv into a data frame, plot and clean that data, and analyse it using built-in statistical models.
(2) Non-standard evaluation
Non-standard evaluation lets you do things like use a variable name in a plot title, or evaluate a user-supplied expression in a different environment.
[…]
For example, R lets you specify models with a formula interface like this: lm(mtcars, mpg ~ cyl). This is a natural way for statisticians to specify statistical models because they’re usually familliar with the syntax, but without NSE there’s no way to make that function work as written because mpg and cylare not objects in the calling environment.
(3) Packaging concensus
R let me get up and running, installing packages, filtering data, and printing plots in under 20 minutes, which meant that I stayed interested in the language and eventually started using it professionally. I had actually started to learn Python at around the same time but just found it too difficult. […]
The user that I care the most about only has 20 minutes of attention and no real programming skill, so the only thing they can “just” do is copy and paste one line of code into a console. If that doesn’t work, I’ve lost them, and they’ll spend another lonely year renewing their SPSS licenses.
(4) Functional programming
I really like this pattern of [functional] programming because breaking complicated jobs down into small functional bricks gives me confidence that the overall solution is correct. I can work on the small functions, verify that they’re correct through tests, and then know that combining those building blocks together won’t change their behaviour.
Although I personally do not fully agree with these four points (e.g., I very much like to leverage functional programming in Python and it works like a charm!) I very much liked the outline Gordon provides. I’d love to hear your thoughts as well, so do share them in the comments.
For now, let’s end with some other lovely quotes by Gordon:
The thing is, I don’t use R out of some blind brand loyalty but because I don’t like working hard.
I came to R from an Excel background, and for a long time I had internalized the feeling that serious engineers used Python, while analysts or researchers could use languages like R. Over time I’ve realized that the people making that statement often aren’t really informed. They rarely know anything about R, and often don’t really write production-quality code themselves.
In contrast, most of the very senior engineers I’ve met understand that all programming languages are basically just bundles of trade-offs, and so no single language is going to be globally superior to another. There really are no production languages – only production engineers.
Brandon Rohrer — (former) data scientist at Microsoft, iRobot, and Facebook — asked his network on Twitter and LinkedIn to share their favorite resources on A/B testing. It produced a nice list, which I summarized below.
Hey Twitter, a contact just asked me about A/B testing. Do you have any posts or tutorials you would recommend for them?
Norm Matloff is a professor of Computer Science at University College Davis. He recently updated his viewpoint on whether R or Python is the best language for Data Science. While I normally hate those opinionated comparisons, Norm’s outline of the two languages’ (dis)advantages is actually quite balanced and well-versed.
I can mostly agree with Norm, although the blog reads as if he has a (slight) bias in favor of R. In his original blog, Norm discusses many different programming topics and provides detailed information on why he considers certain topics big wins, slight edges, or ties between the two programming languages.
In the table below, I’ve tried to summarize Norm’s opinions by converting his words to 0-100 scores per topic for a quicker overview. I’ve converted Norm’s words to scores: his huge win became 100-0, a big win 80-20, a win 70-30, an edge 60-40, and a tie 50-50.
Python
R
Elegance
100
Learning curve
100
Data Science libraries
40
60
Machine Learning
60
40
Statistical correctness
20
80
Parallel computing
50
50
C/C++ interface
40
60
Object orientation, metaprogramming
40
60
Language unity
100
Linked data structures
70
30
Online help
20
80
I personally started my career with R, so that’s definitely my favorite programming language. However, I think that Python is more convenient and faster on certain topics, and closer to more mainstream programming languages, which I why I’m currently learning it next to using R.
PS. This tweet by John summarizes the whole discussion quite well.
Someone asked me "R vs. Python", so: 1. It depends what you're trying to do 2. If you're trying to capitalise the letter r, I'd go with R, but if you're trying to strangle a woodland animal, I'd say python 3. Java is better than either. It's a huge island! Tropical rainforests!
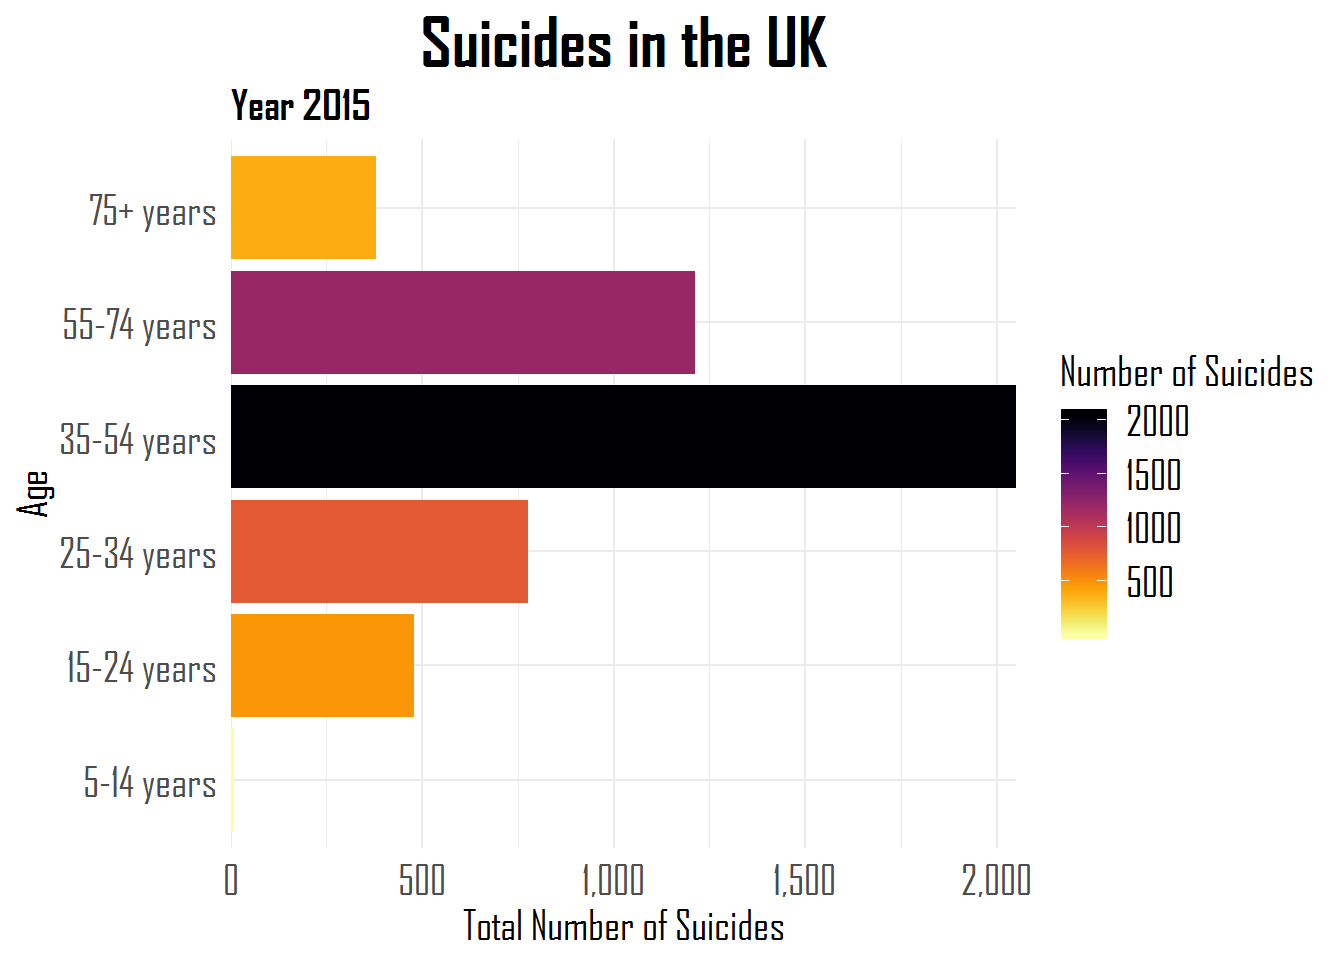
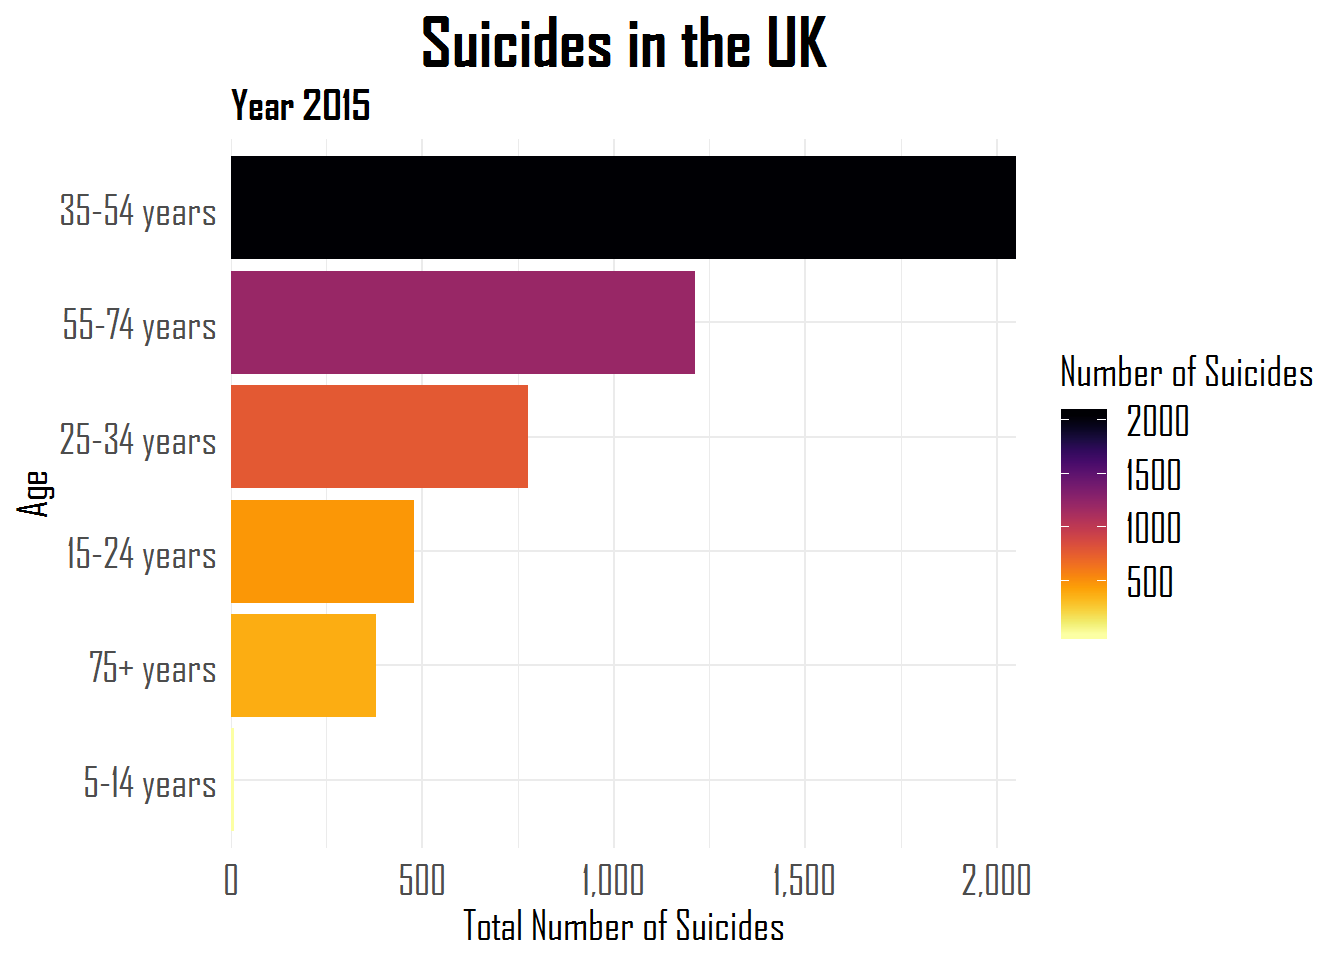
Hugo Toscano wrote a great blog providing an overview of all the helpful functionalities of the R forcats package. The package includes functions that help handling categorical data, by setting a random or fixed order, and by recategorizing or anonymizing. These functions are specifically helpful when visualizing data with R’s ggplot2.
A comprehensive overview is provided in the form of the RStudio forcats cheat sheet, but, on his blog, Hugo demonstrates some of its functionalities using a dataset on suicides and people’s ages:
Other functions can be used to automatically surpress infrequent categories, to reverse the order of categories, to shuffle or shift categories, to quickly relabel or anonimize categories, and many more…
In a hilarious experiment the anonymous mathematician behind the website Possibly Wrong estimated that s/he only needed to open “about 400-500” packs of Skittles to find an identifical pack.
From January 12th up to April 6th, s/he put it to the test and counted the contents of an astonishing 468 packs, containing over 27.000 individual Skittles! Read all about the experiment here.


