Tag: programming

Time Series Analysis 101

Time Series Analysis 101

A time series can be considered an ordered sequence of values of a variable at equally spaced time intervals. To model such data, one can use time series analysis (TSA). TSA accounts for the fact that data points taken over time may have an internal structure (such as autocorrelation, trend, or seasonal variation) that should be accounted for.

TSA has several purposes:

  1. Descriptive: Identify patterns in correlated data, such as trends and seasonal variations.
  2. Explanation: These patterns may help in obtaining an understanding of the underlying forces and structure that produced the data.
  3. Forecasting: In modelling the data, one may obtain accurate predictions of future (short-term) trends.
  4. Intervention analysis: One can examine how (single) events have influenced the time series.
  5. Quality control: Deviations on the time series may indicate problems in the process reflected by the data.

TSA has many applications, including:

  • Economic Forecasting
  • Sales Forecasting
  • Budgetary Analysis
  • Stock Market Analysis
  • Yield Projections
  • Process and Quality Control
  • Inventory Studies
  • Workload Projections
  • Utility Studies
  • Census Analysis
  • Strategic Workforce Planning

AlgoBeans has a nice tutorial on implementing a simple TS model in Python. They explain and demonstrate how to deconstruct a time series into daily, weekly, monthly, and yearly trends, how to create a forecasting model, and how to validate such a model.

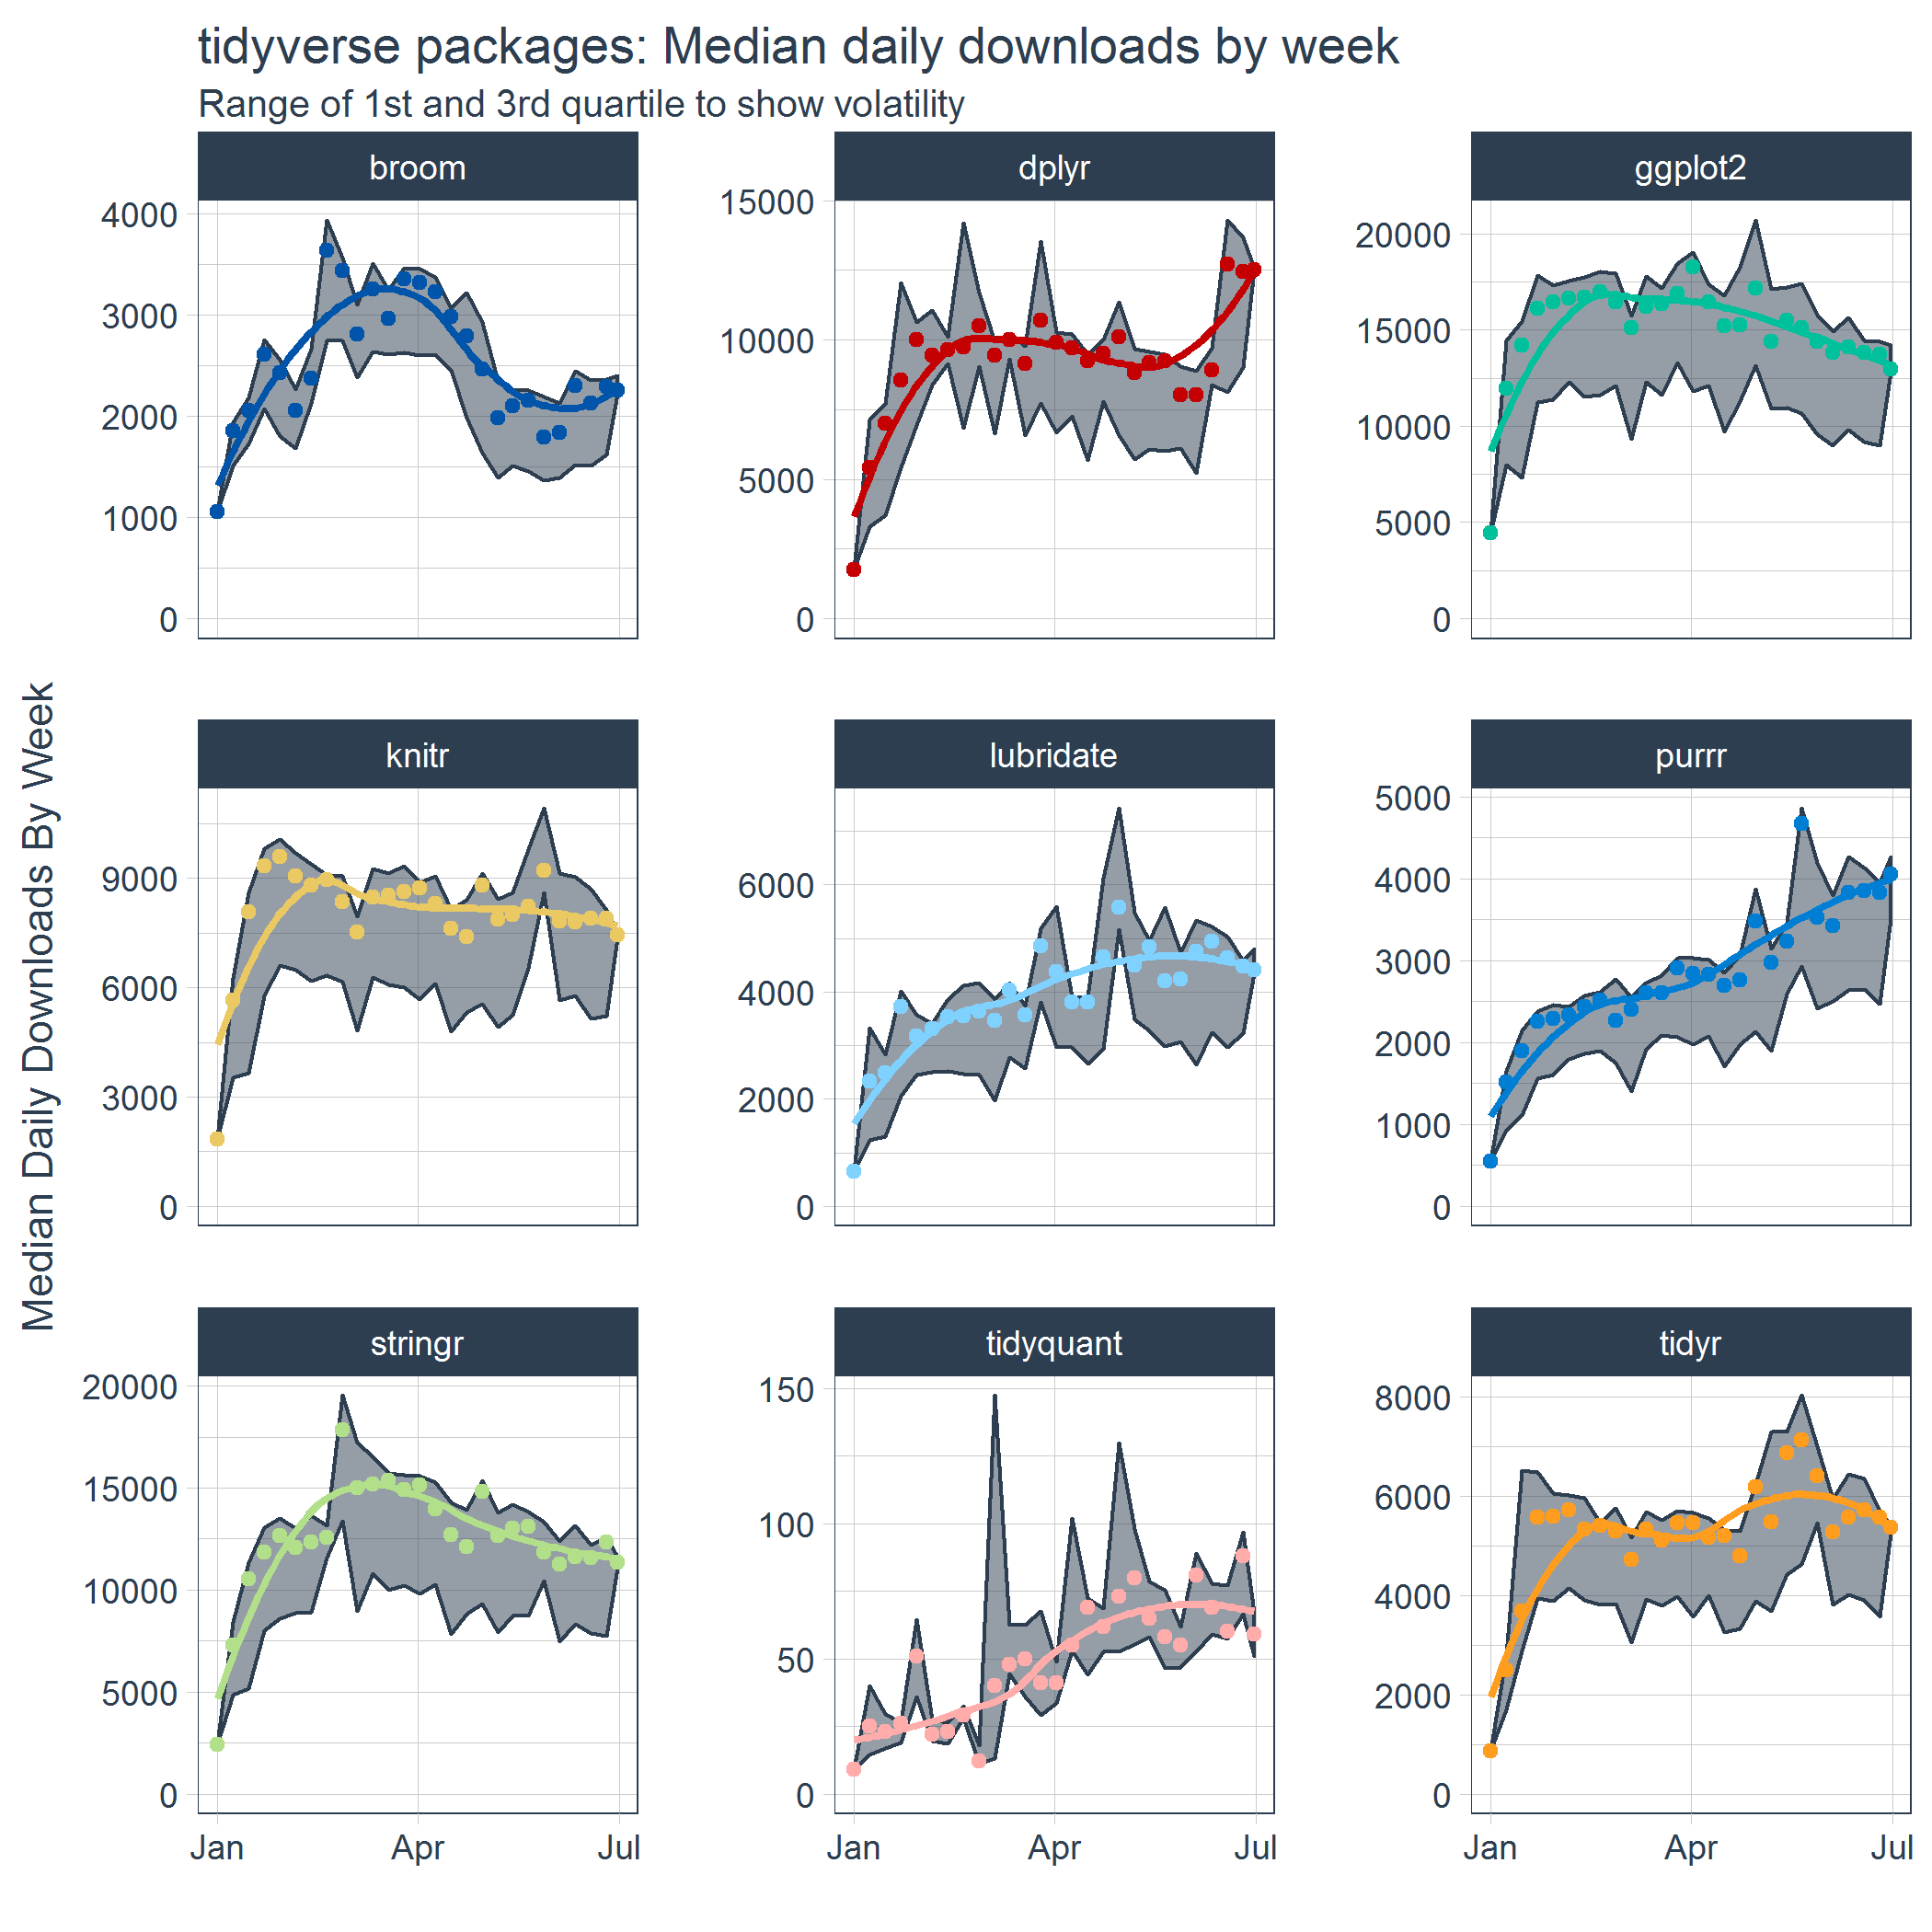
Analytics Vidhya hosts a more comprehensive tutorial on TSA in R. They elaborate on the concepts of a random walk and stationarity, and compare autoregressive and moving average models. They also provide some insight into the metrics one can use to assess TS models. This web-tutorial runs through TSA in R as well, showing how to perform seasonal adjustments on the data. Although the datasets they use have limited practical value (for businesses), the stepwise introduction of the different models and their modelling steps may come in handy for beginners. Finally, business-science.io has three amazing posts on how to implement time series in R following the tidyverse principles using the tidyquant package (Part 1; Part 2; Part 3; Part 4).


Statistics Visually Explained

Statistical literacy is essential to our data-driven society. Analytics has been and continues to be a game changer in many business fields, among other Human Resources. Yet, for all the increased importance and demand for statistical competence, the pedagogical approaches in statistics have barely changed.

Seeing Theory is a project designed and created by Daniel Kunin with support from Brown University’s Royce Fellowship Program. The goal of the project is to make statistics more accessible to a wider range of students through interactive visualizations.

Using JavaScript, the researchers have made statistics both intuitive and beautiful at the same time.

seeing theory

Robert Coombs and his application robot

Robert Coombs and his application robot

Robert Coombs wanted to see whether he could land a new job. He was aware that, these days, organizations often employ applicant tracking systems to progress/fail incoming applications. Hence, Robert concluded that he had two challenges in his search for a new job:

  • He was up against leaders in their field, so his resume wouldn’t simply jump to the top of the pile.
  • Robots would read his application, along with those of his competition.

Being a tech enthusiast and having some programming skills, he decided to build his own application robot, capable of sending a customized CV and resume to the thousands of jobs posted online every day, in a matter of seconds. I strongly recommend you read his full story here, but these were his conclusions:

  • It’s not how you apply, it’s who you know. And if you don’t know someone, don’t bother.
  • Companies are trying to fill a position with minimal risk, not discover someone who breaks the mold.
  • The number of jobs you apply to has no correlation to whether you’ll be considered, and you won’t be considered for jobs you don’t get the chance to apply to.

What I found most amusing is that he A/B tested one normal-looking cover letter and a letter in which he that admits right in the second sentence that it was being sent by a robot. “Now, one of those letters should have performed either a lot better or a lot worse than the other. For my purposes, I didn’t care which” he states. But as far as he could tell from the results of this experiment, it seems that nobody even reads cover letters anymore – not even the robots supposedly used in application tracking systems.