
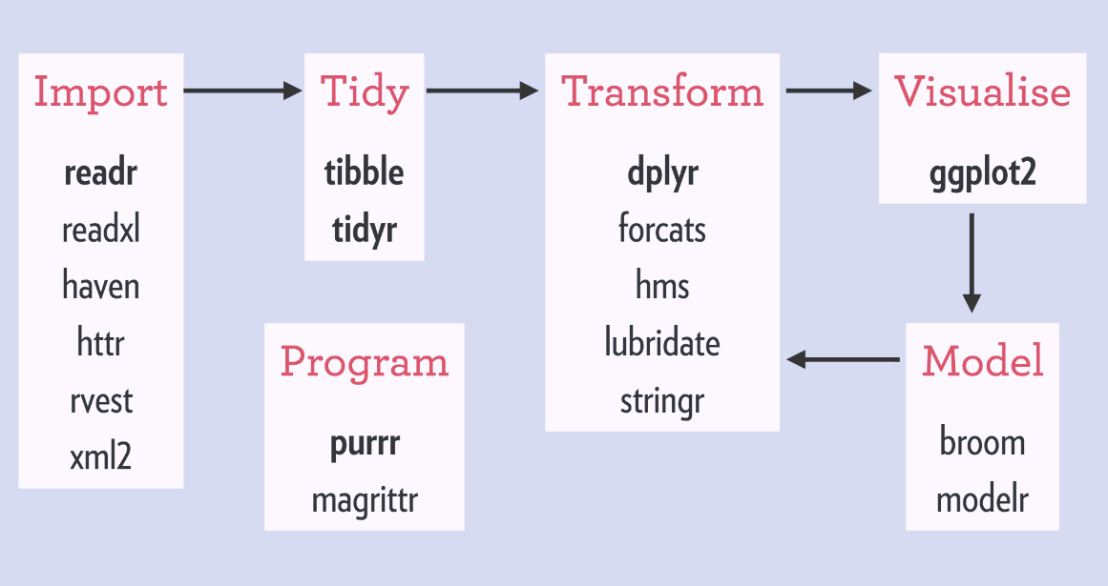
Hadley Wickham‘s tidyverse has improved the workflow of analysts / data scientists, makes coding errors less likely and code more transparent. You’ve got to love the figure below, representing a simplified workflow of the average analysis project.

The tidyverse provides assistance in each of the stages. Various packages provide functionality to perform analytical tasks more effectively, in fewer lines, with fewer errors, and moreover in more transparent code. As a first step, the analyst will need to import (load) the data to his/her working environment (e.g., Excel, SPSS, R, RStudio, Spyder, Jupyter). In order to guarantee that the data are correct, a next step will be to clean up and tidy the data before continuing to the analysis part. In this early stage, the analyst can handle the explicit errors in the dataset, such as missing and nonsensical data points or records. After these preparatory steps, the main process starts. This consists of three interrelated tasks. (1) The analyst will need to transform the data in order to retrieve statistics, descriptives, and/or new features. (2) The analyst will need to visualize statistics, relations, and results. This is essential for storytelling and effective interpretation and communication of the results. (3) The analyst will try out different models to fit, explain, and predict the data. Finally, the results of this main process (leading to “understanding” of the data and the underlying processing) can be communicated to others.
I will run through each of these stages in separate posts, explaining the various packages, their inner workings, and demonstrating how they affect the process of data analysis in R:
- Importing data (work in progress)
- Tidying data (work in progress)
- Transforming data (work in progress)
- Visualizing data (work in progress)
- Modeling data (work in progress)
- Efficient programming (work in progress)
General tutorials:
- A guide for switching from base R to the
tidyverse - Introduction to
plyr&dplyr - Introduction to
purrrandmap() - Code examples of top-50 ggplot2 visualizations

7 thoughts on “tidyverse 101: Simplifying life for useRs”