
A recent open access paper by Nicholas Tierney and Dianne Cook — professors at Monash University — deals with simpler handling, exploring, and imputation of missing values in data.They present new methodology building upon tidy data principles, with a goal to integrating missing value handling as an integral part of data analysis workflows. New data structures are defined (like the nabular) along with new functions to perform common operations (like gg_miss_case).
These new methods have bundled among others in the R packages naniar and visdat, which I highly recommend you check out. To put in the author’s own words:
The
naniarandvisdatpackages build on existing tidy tools and strike a compromise between automation and control that makes analysis efficient, readable, but not overly complex. Each tool has clear intent and effects – plotting or generating data or augmenting data in some way. This reduces repetition and typing for the user, making exploration of missing values easier as they follow consistent rules with a declarative interface.
The below showcases some of the highly informational visuals you can easily generate with naniar‘s nabulars and the associated functionalities.
For instance, these heatmap visualizations of missing data for the airquality dataset. (A) represents the default output and (B) is ordered by clustering on rows and columns. You can see there are only missings in ozone and solar radiation, and there appears to be some structure to their missingness.

Another example is this upset plot of the patterns of missingness in the airquality dataset. Only Ozone and Solar.R have missing values, and Ozone has the most missing values. There are 2 cases where both Solar.R and Ozone have missing values.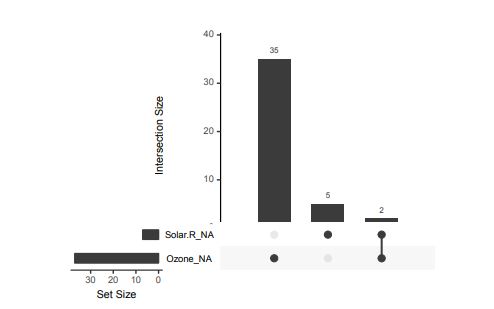
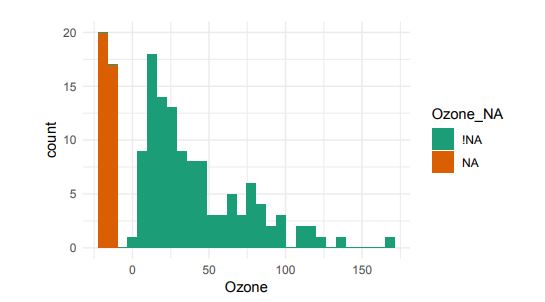
You can also generate a histogram using nabular data in order to show the values and missings in Ozone. Values are imputed below the range to show the number of missings in Ozone and colored according to missingness of ozone (‘Ozone_NA‘). This displays directly that there are approximately 35-40 missings in Ozone.
 Alternatively, scatterplots can be easily generated. Displaying missings at 10 percent below the minimum of the airquality dataset. Scatterplots of ozone and solar radiation (A), and ozone and temperature (B). These plots demonstrate that there are missings in ozone and solar radiation, but not in temperature.
Finally, this parallel coordinate plot displays the missing values imputed 10% below range for the oceanbuoys dataset. Values are colored by missingness of humidity. Humidity is missing for low air and sea temperatures, and is missing for one year and one location.

Please do check out the original open access paper and the CRAN vignettes associated with the packages!
