
Due to the recent updates to the gganimate package, the code below no longer produces the desired animation.
A working, updated version can be found here.
After hearing R play the Jingle Bells tune, I really got into the holiday vibe. It made me think of Ilya Kashnitsky (homepage, twitter) his snowy image in R.
– Papa, what are you doing?
…
How I ended up generating #rstats snow for my 3yo daughter Sophia#ggplot2 #dataviz pic.twitter.com/29sk1HpROJ— Ilya Kashnitsky (@ikashnitsky) 4 december 2017
if(!"tidyverse" %in% installed.packages()) install.packages("tidyverse")

library("tidyverse")

n <- 100
tibble(x = runif(n),
y = runif(n),
s = runif(n, min = 4, max = 20)) %>%
ggplot(aes(x, y, size = s)) +
geom_point(color = "white", pch = 42) +
scale_size_identity() +
coord_cartesian(c(0,1), c(0,1)) +
theme_void() +
theme(panel.background = element_rect("black"))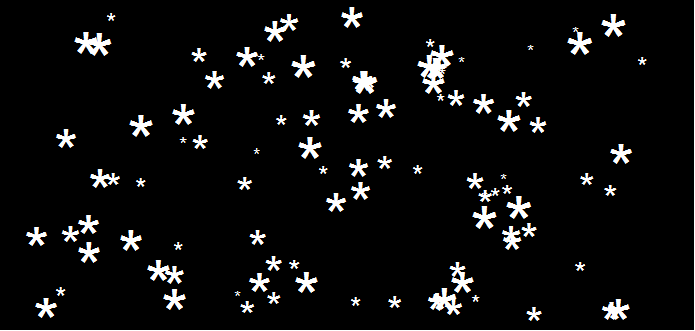
This greatly fits the Christmas theme we have going here. Inspired by Ilya’s script, I decided to make an animated snowy GIF! Sure R is able to make something like the lively visualizations Daniel Shiffman (Coding Train) usually makes in Processing/JavaScript? It seems so:
### ANIMATED SNOW === BY PAULVANDERLAKEN.COM
### PUT THIS FILE IN AN RPROJECT FOLDER

# load in packages
pkg <- c("here", "tidyverse", "gganimate", "animation")
sapply(pkg, function(x){
if (!x %in% installed.packages()){install.packages(x)}
library(x, character.only = TRUE)
})

# parameters
n <- 100 # number of flakes
times <- 100 # number of loops
xstart <- runif(n, max = 1) # random flake start x position
ystart <- runif(n, max = 1.1) # random flake start y position
size <- runif(n, min = 4, max = 20) # random flake size
xspeed <- seq(-0.02, 0.02, length.out = 100) # flake shift speeds to randomly pick from
yspeed <- runif(n, min = 0.005, max = 0.025) # random flake fall speed

# create storage vectors
xpos <- rep(NA, n * times)
ypos <- rep(NA, n * times)

# loop through simulations
for(i in seq(times)){
if(i == 1){
# initiate values
xpos[1:n] <- xstart
ypos[1:n] <- ystart
} else {
# specify datapoints to update
first_obs <- (n*i - n + 1)
last_obs <- (n*i)
# update x position
# random shift
xpos[first_obs:last_obs] <- xpos[(first_obs-n):(last_obs-n)] - sample(xspeed, n, TRUE)
# update y position
# lower by yspeed
ypos[first_obs:last_obs] <- ypos[(first_obs-n):(last_obs-n)] - yspeed
# reset if passed bottom screen
xpos <- ifelse(ypos < -0.1, runif(n), xpos) # restart at random x
ypos <- ifelse(ypos < -0.1, 1.1, ypos) # restart just above top
}
}

# store in dataframe
data_fluid <- cbind.data.frame(x = xpos,
y = ypos,
s = size,
t = rep(1:times, each = n))

# create animation
snow <- data_fluid %>%
ggplot(aes(x, y, size = s, frame = t)) +
geom_point(color = "white", pch = 42) +
scale_size_identity() +
coord_cartesian(c(0, 1), c(0, 1)) +
theme_void() +
theme(panel.background = element_rect("black"))

# save animation
gganimate(snow, filename = here("snow.gif"), title_frame = FALSE, interval = .1)
Updates:
- 21/12/2017: Keith combined sound and image to create this very merry video.
- 22/12/2017: Ioannis Kosmidis generated snow in base R
- 25/12/2017: Daniel Shiffman dedicated a coding challenge to the topic.
- 25/12/2017: Cynthia Siew combined sound and image in this Shiny Christmas card.
- 17/12/2018: Due to the update to gganimate, I updated the code and general setup to run still in 2018.
