Yesterday was the second anniversary of my website. I also reflected on this moment last year, and I thought to continue the tradition in 2019.
Let me start with a great, big
THANK YOU
to all my readers for continuing to visit my website!
You are the reason I continue to write down what I read. And maybe even the reason I continued reading and learning last year, despite all other distractions [my “real” job and my PhD : )].
Also a big thank you to all my followers on Twitter and LinkedIn, and those who have taken the time to comment or like my blogs. All of you make that I gain energy from writing this blog!
With that said, let’s start the review of the past year on my blog.
Most popular blog posts of 2018
Most importantly, let’s examine what you guys liked. Which blogs attracted the most visitors? What did you guys read?
Unfortunately, WordPress does not allow you to scrape their statistics pages. However, I was able to download monthly data manually, which I could then visualize to show you some trends.
The visual below shows the cumulative amount of visitors attracted by each blog I’ve written in 2018. Here follow links to the top 8 blogs in terms of visitor numbers this year:
- “What’s the difference between data science, machine learning, and artificial intelligence?”, visualized. received 4355 visits. Following a viral blog by David Robinson, I try to demystify the popular terminology.
- The House Always Wins: Simulating 5,000,000 Games of Baccarat a.k.a. Punto Banco received 3079 views. After a visit to Holland Casino, I thought it’d be fun to approximate the odds of gambling through statistical simulation.
- Bayesian data analysis for newcomers received 2253 views. It contains the link to an open access paper explaining the basics of Bayesian analysis.
- Identifying “Dirty” Twitter Bots with R and Python received 2247 views. It tells the story of two programmers who uncover networks of filthy social media accounts.
- rstudio::conf 2018 summary received 1514 views. It provides links to the most salient talks and presentations of the yearly R gathering.
- R tips & tricks is relatively new and has only yet received 1212 views. Seperate from the R resources guide, this new list contains all the quick tricks that help you program more effectively in R.
- Super Resolution: A Photo Enhancer AI received 891 views and elaborates on the development of new tools that can upgrade photo and video data quality.
- ggstatsplot: Creating graphics including statistical details is also relatively new but already attracted 810 visitors. It explains the novel visualization package in R that allows you to quickly create elaborate statistical plots.

Biggest failures of 2018
Where there’s success, there’s failure. Some of my posts did not get a lot of attention by my readership. That’s unfortunate, as I really only take the time to blog about the stuff that I deem interesting enough. Were these failed blog posts just unlucky, or am I biased and were they simply really bad and uninteresting?
You be the judge! Here are some of the least read posts of 2018:
- A/B Testing a New Look received a meagre 4 views per month.
- Interactive Explanation of Network and Graph Principles received 5 views/month.
- Dragonflies and neural networks and Bellwoods: A procedurally generated game both received just 6 views per month.
- 7 tips for writing cleaner JavaScript code, translated to 3.5 tips for R programming only received 8 views/month, as did What to consider when choosing colors for data visualization
- dygraphs and chatterplots, both new types of visualizations, received 9 views/month.
- Finally, How to Design Your First Programs and Computers decode what humans see both received 10 views per month.
General statistics
Now, let’s move to some general statistics: in 2018, paulvanderlaken.com received 85.614 views, by 57.594 unique visitors. I posted 61 new blogs, consisting of a total of 31.598 words. Fifty-one visitors liked one of my posts, and 24 visitors took the time to post a comment of their own (my replies included, probably).
Compared to last year, my website did pretty well!
| 2017 | 2018 | Δ | |
| Views | 38490 | 85614 | 122% |
| Unique visitors | 26949 | 57594 | 114% |
| Posts | 100 | 61 | -39% |
| Words / post | 625 | 518 | -17% |
| Likes | 35 | 51 | 46% |
| Comments | 99 | 24 | -76% |
However, the above statistics do not properly reflect the development of my website. For instance, I only really started generating traffic after my first viral post (i.e., Harry Plotter). The below graph takes that into account and better reflects the development of the traffic to my website.

The upward trend in traffic looks promising!
All time favorites
Looking back to the start of paulvanderlaken.com, let’s also examine which blogs have been performing well ever since their conception.
Clearly, most people have been coming for the R resources overview, as demonstrated by the visual below. Moreover, the majority of blog posts has not been visited much — only a handful ever cross the 1000 views mark.
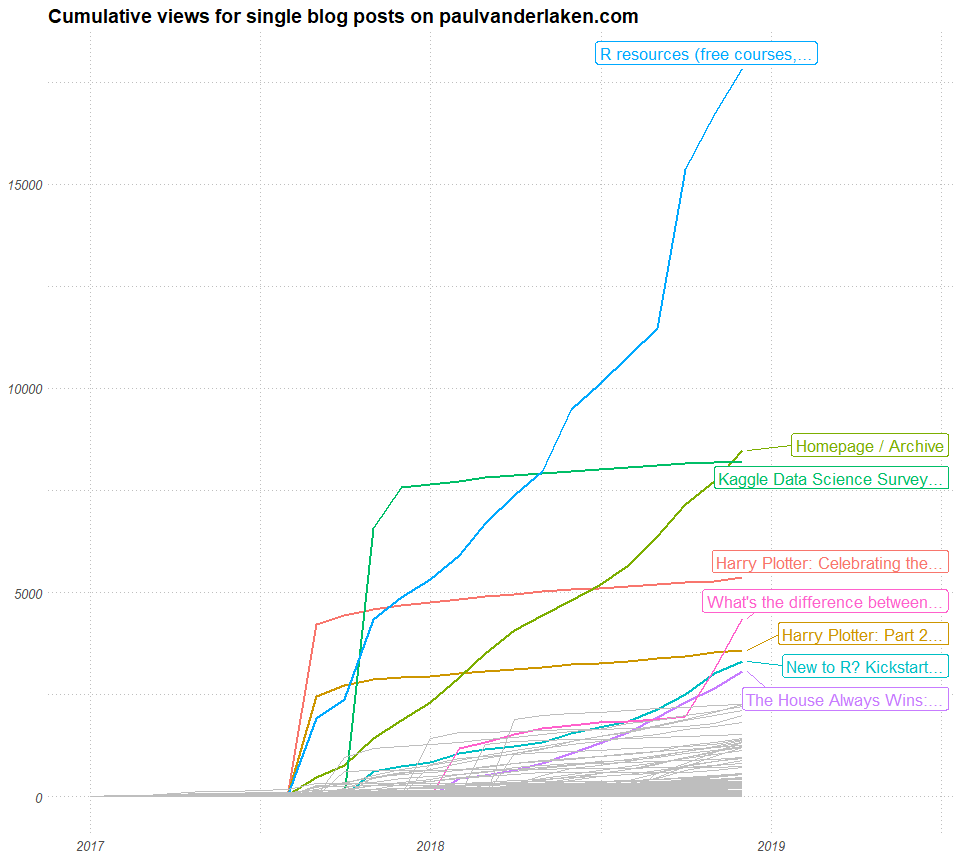
The blogs that attracted a large public in 2017 (such as the original Harry Plotter and its sequal, and the Kaggle 2017 DS survey) have phased out a bit.
Fortunately, the introductory guide for newcomers to R is still kickstarting many programming careers! And on an additional positive note, more and more visitors seem to inspect the homepage and archives.
Redirected visitors
Finally , let’s have a closer look as to what brought people to my website.The below visualizes the main domains that redirected visitors.

Search engines provided the majority of traffic in both 2017 and 2018 –
mainly Google; to a lesser extent, DuckDuckGo and Bing (who in his right mind uses Norton Safe Search?!). My Twitter visitors increased in 2018 as compared to 2017, as did my traffic from this specific Quora page.
And that concludes my two year anniversary of paulvanderlaken.com review. I hope you enjoyed it, and that you will return to my website for the many more years to come : )
I end with a big shout out to my most loyal readers!
104 people have subscribed to my website (as of 2019-01-22)
and receive an update wherener I post a new blog.
Thank you for your continued support!
Want to join this group of elite followers?
Press the Follow button
in the right toolbar, or at the bottom of this blog post.

I didn’t have any expectations regarding that name, but then the longer I was astonished.
The writer did a great job. I spent a few minutes studying and checking the facts.
Everything is clear and understandable. I enjoy posts that fill in your knowledge gaps.
This one is of this sort. Moreover, I enjoy the way the writer organized his ideas as well as the visual component.
LikeLike