
Most of my data visualizations I create using R programming — as you might have noticed from the content of my website.
Though I am colorblind myself, I love to work with colors and color palettes in my visualizations. And I’ve come across quite some neat tricks in my time.
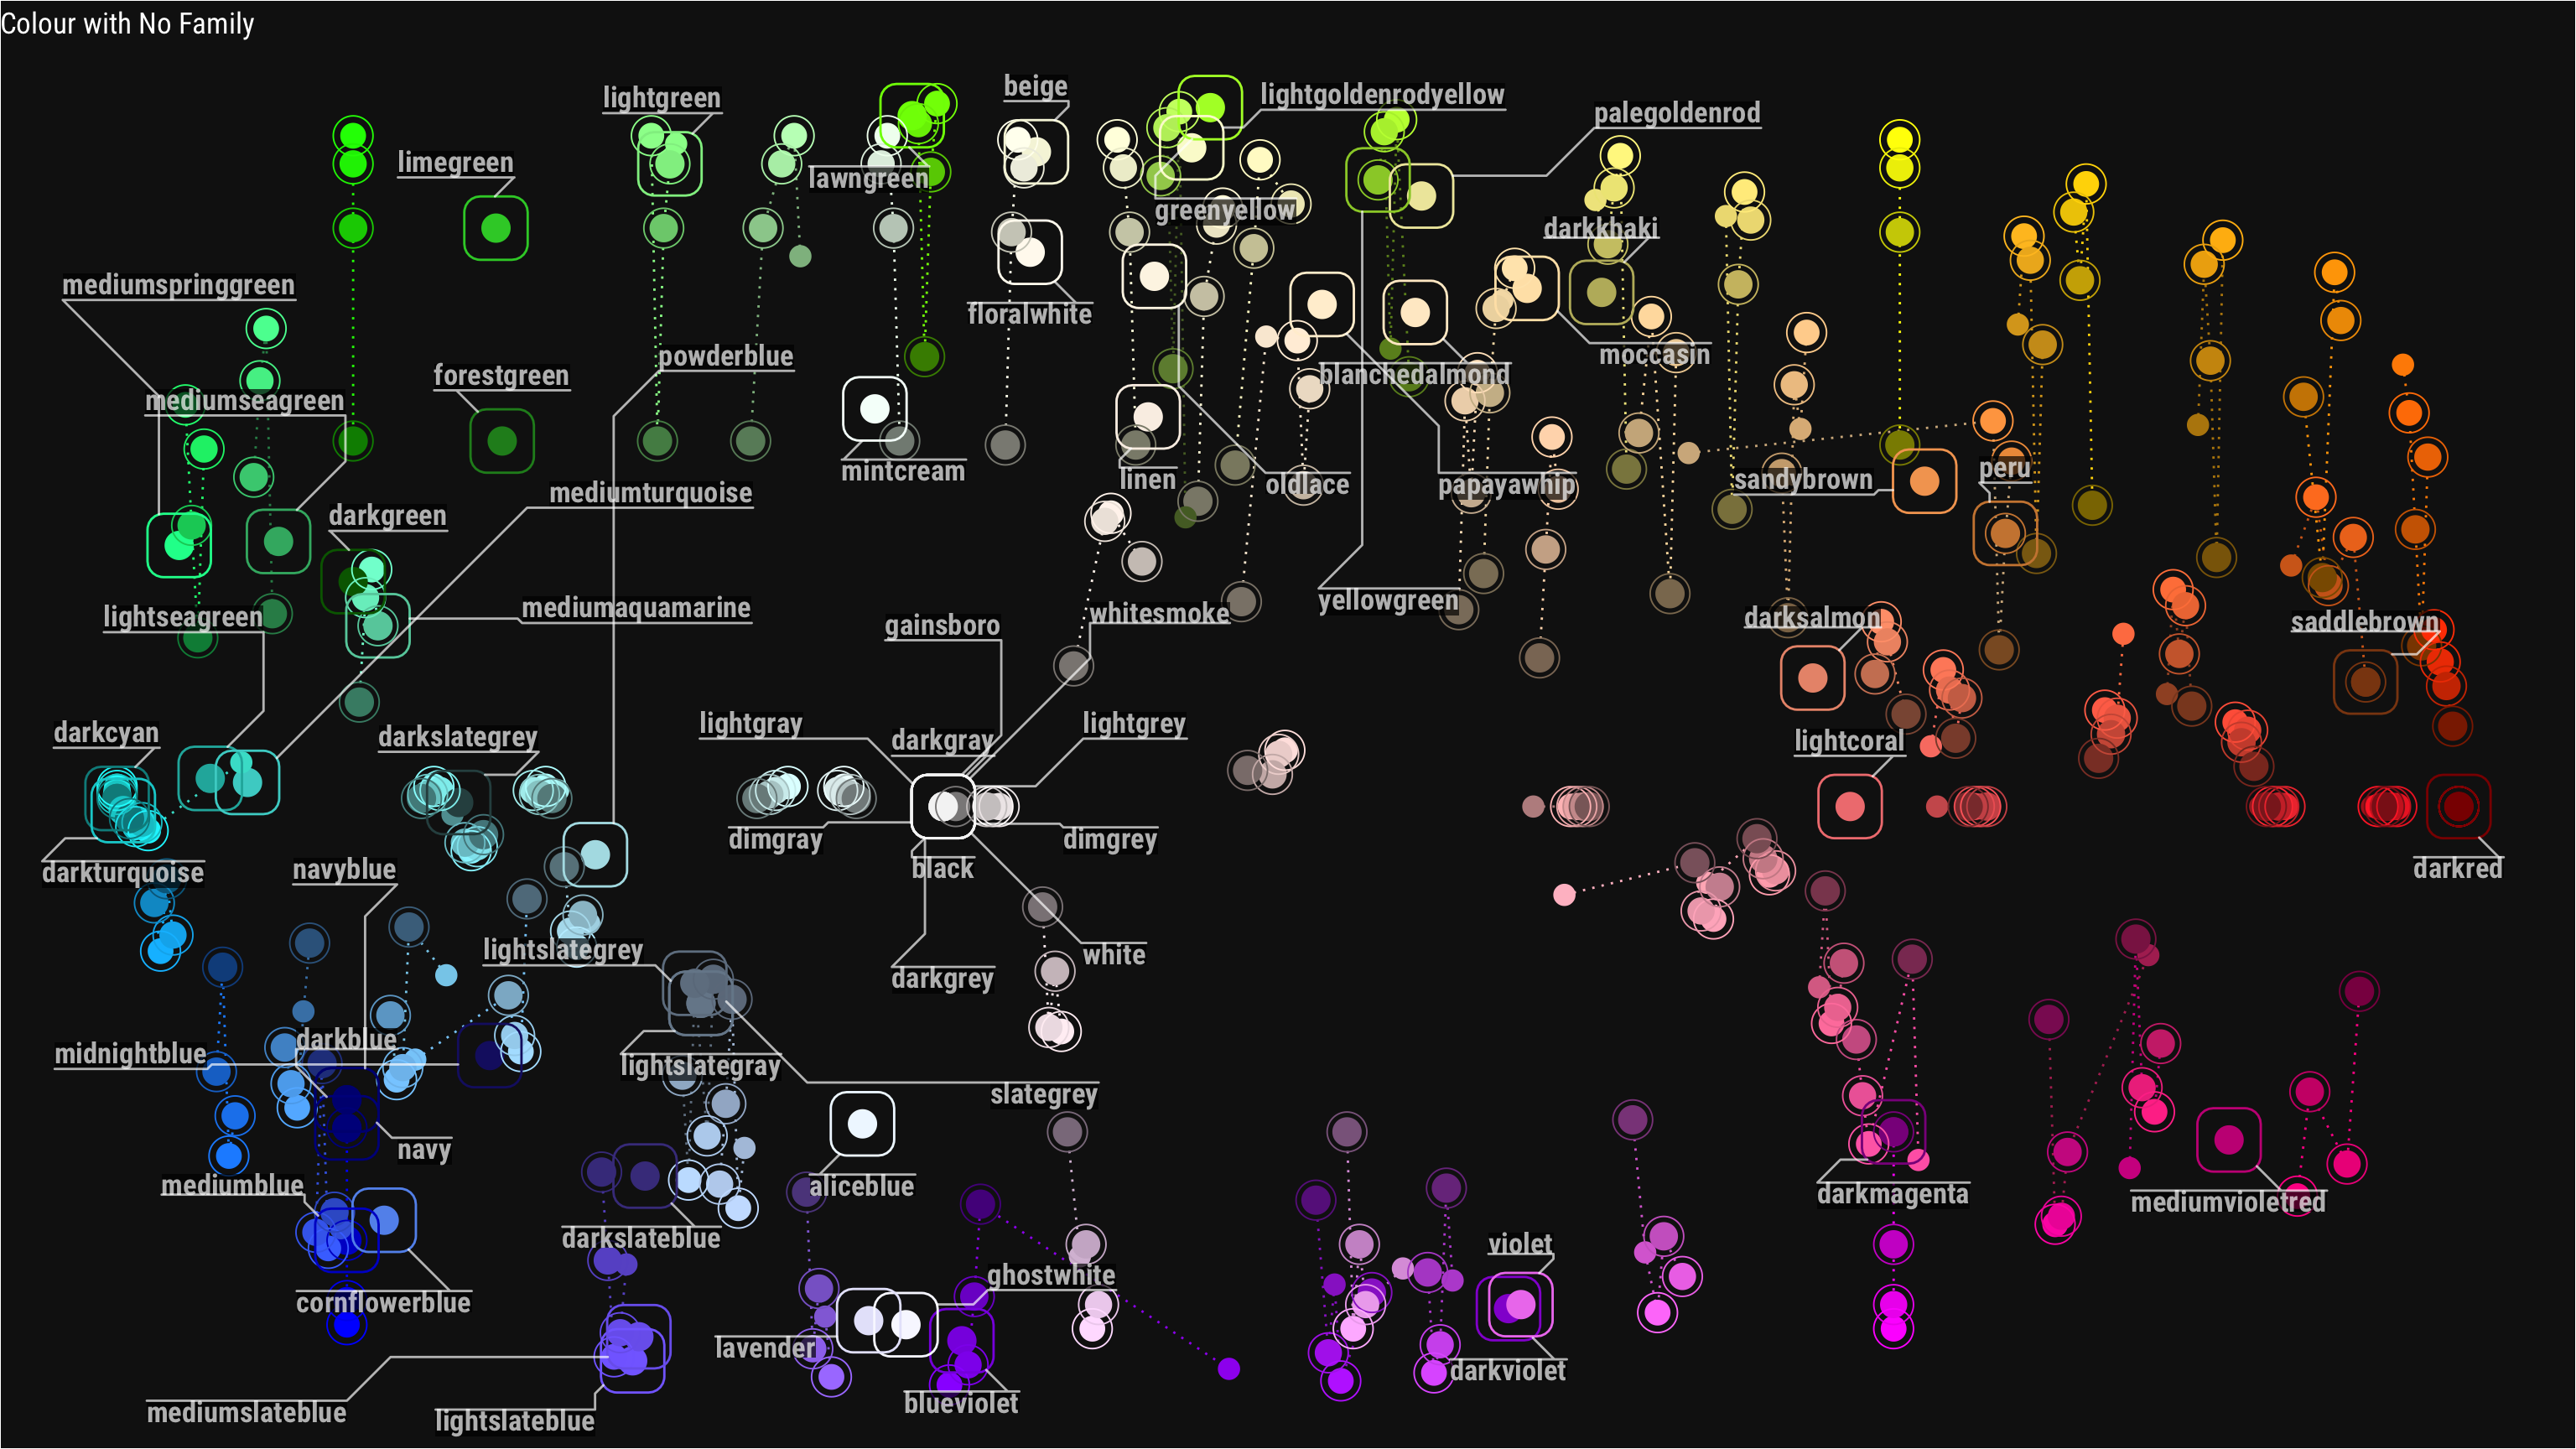
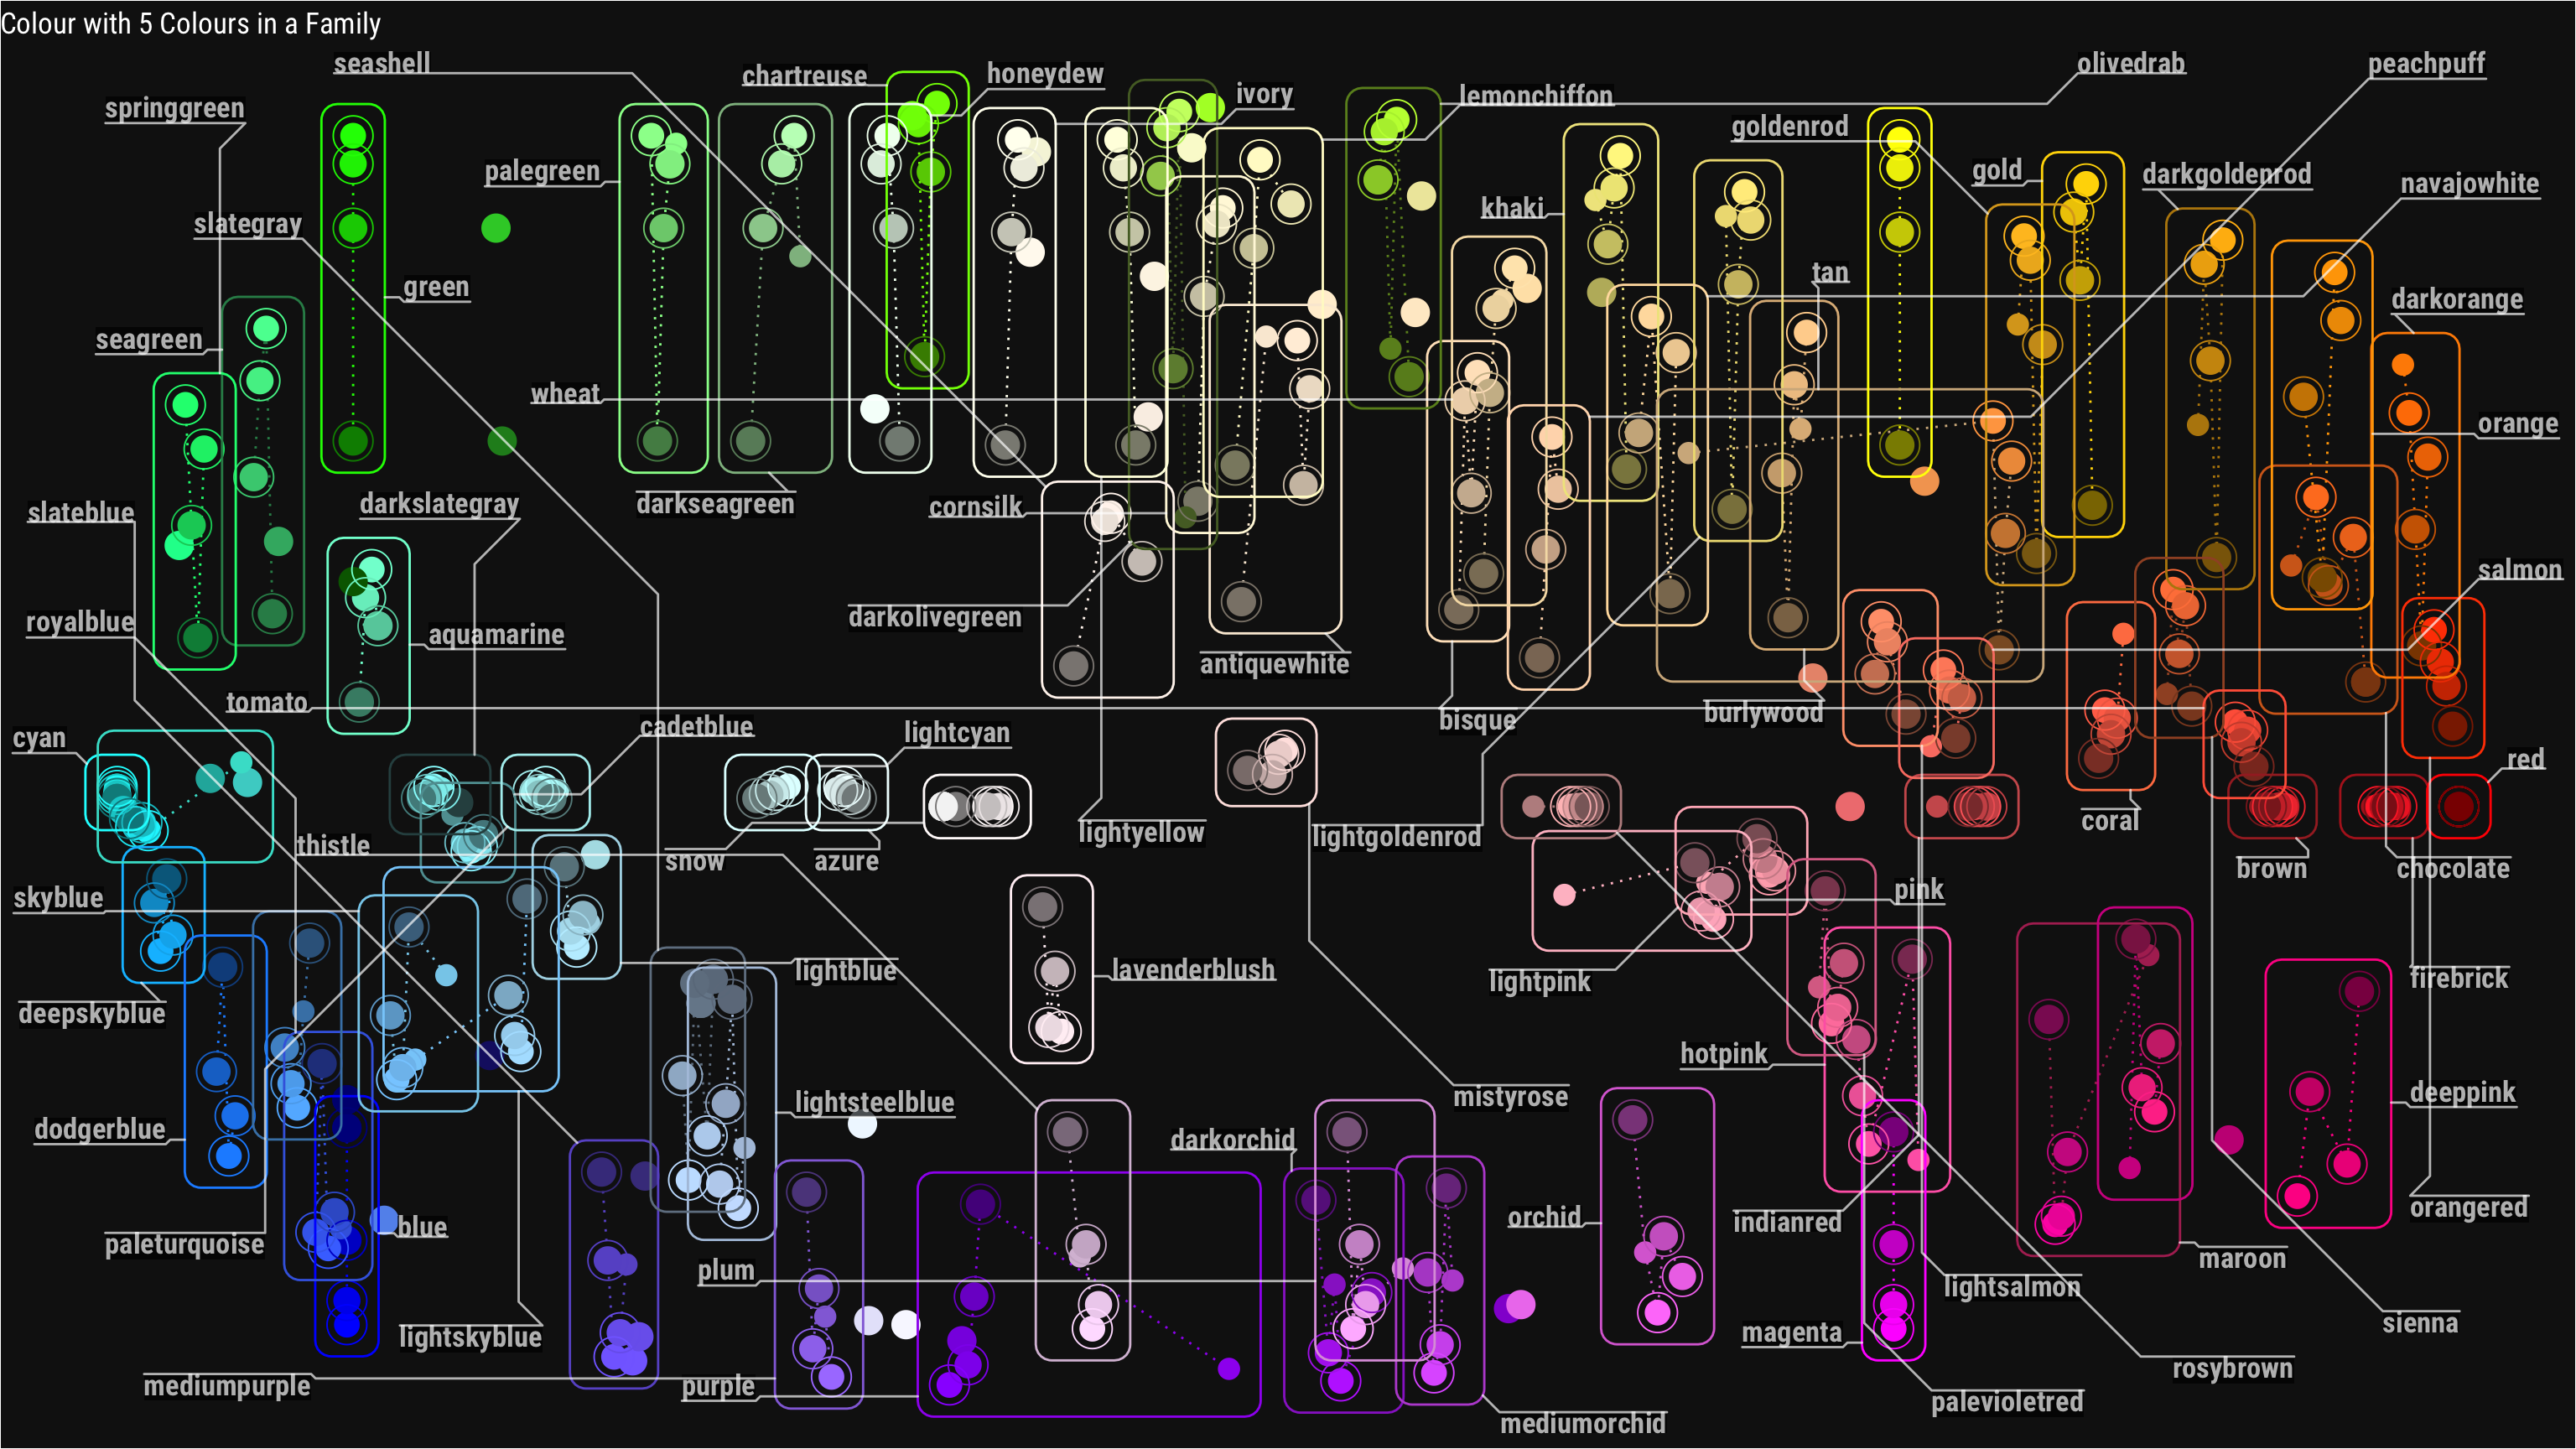
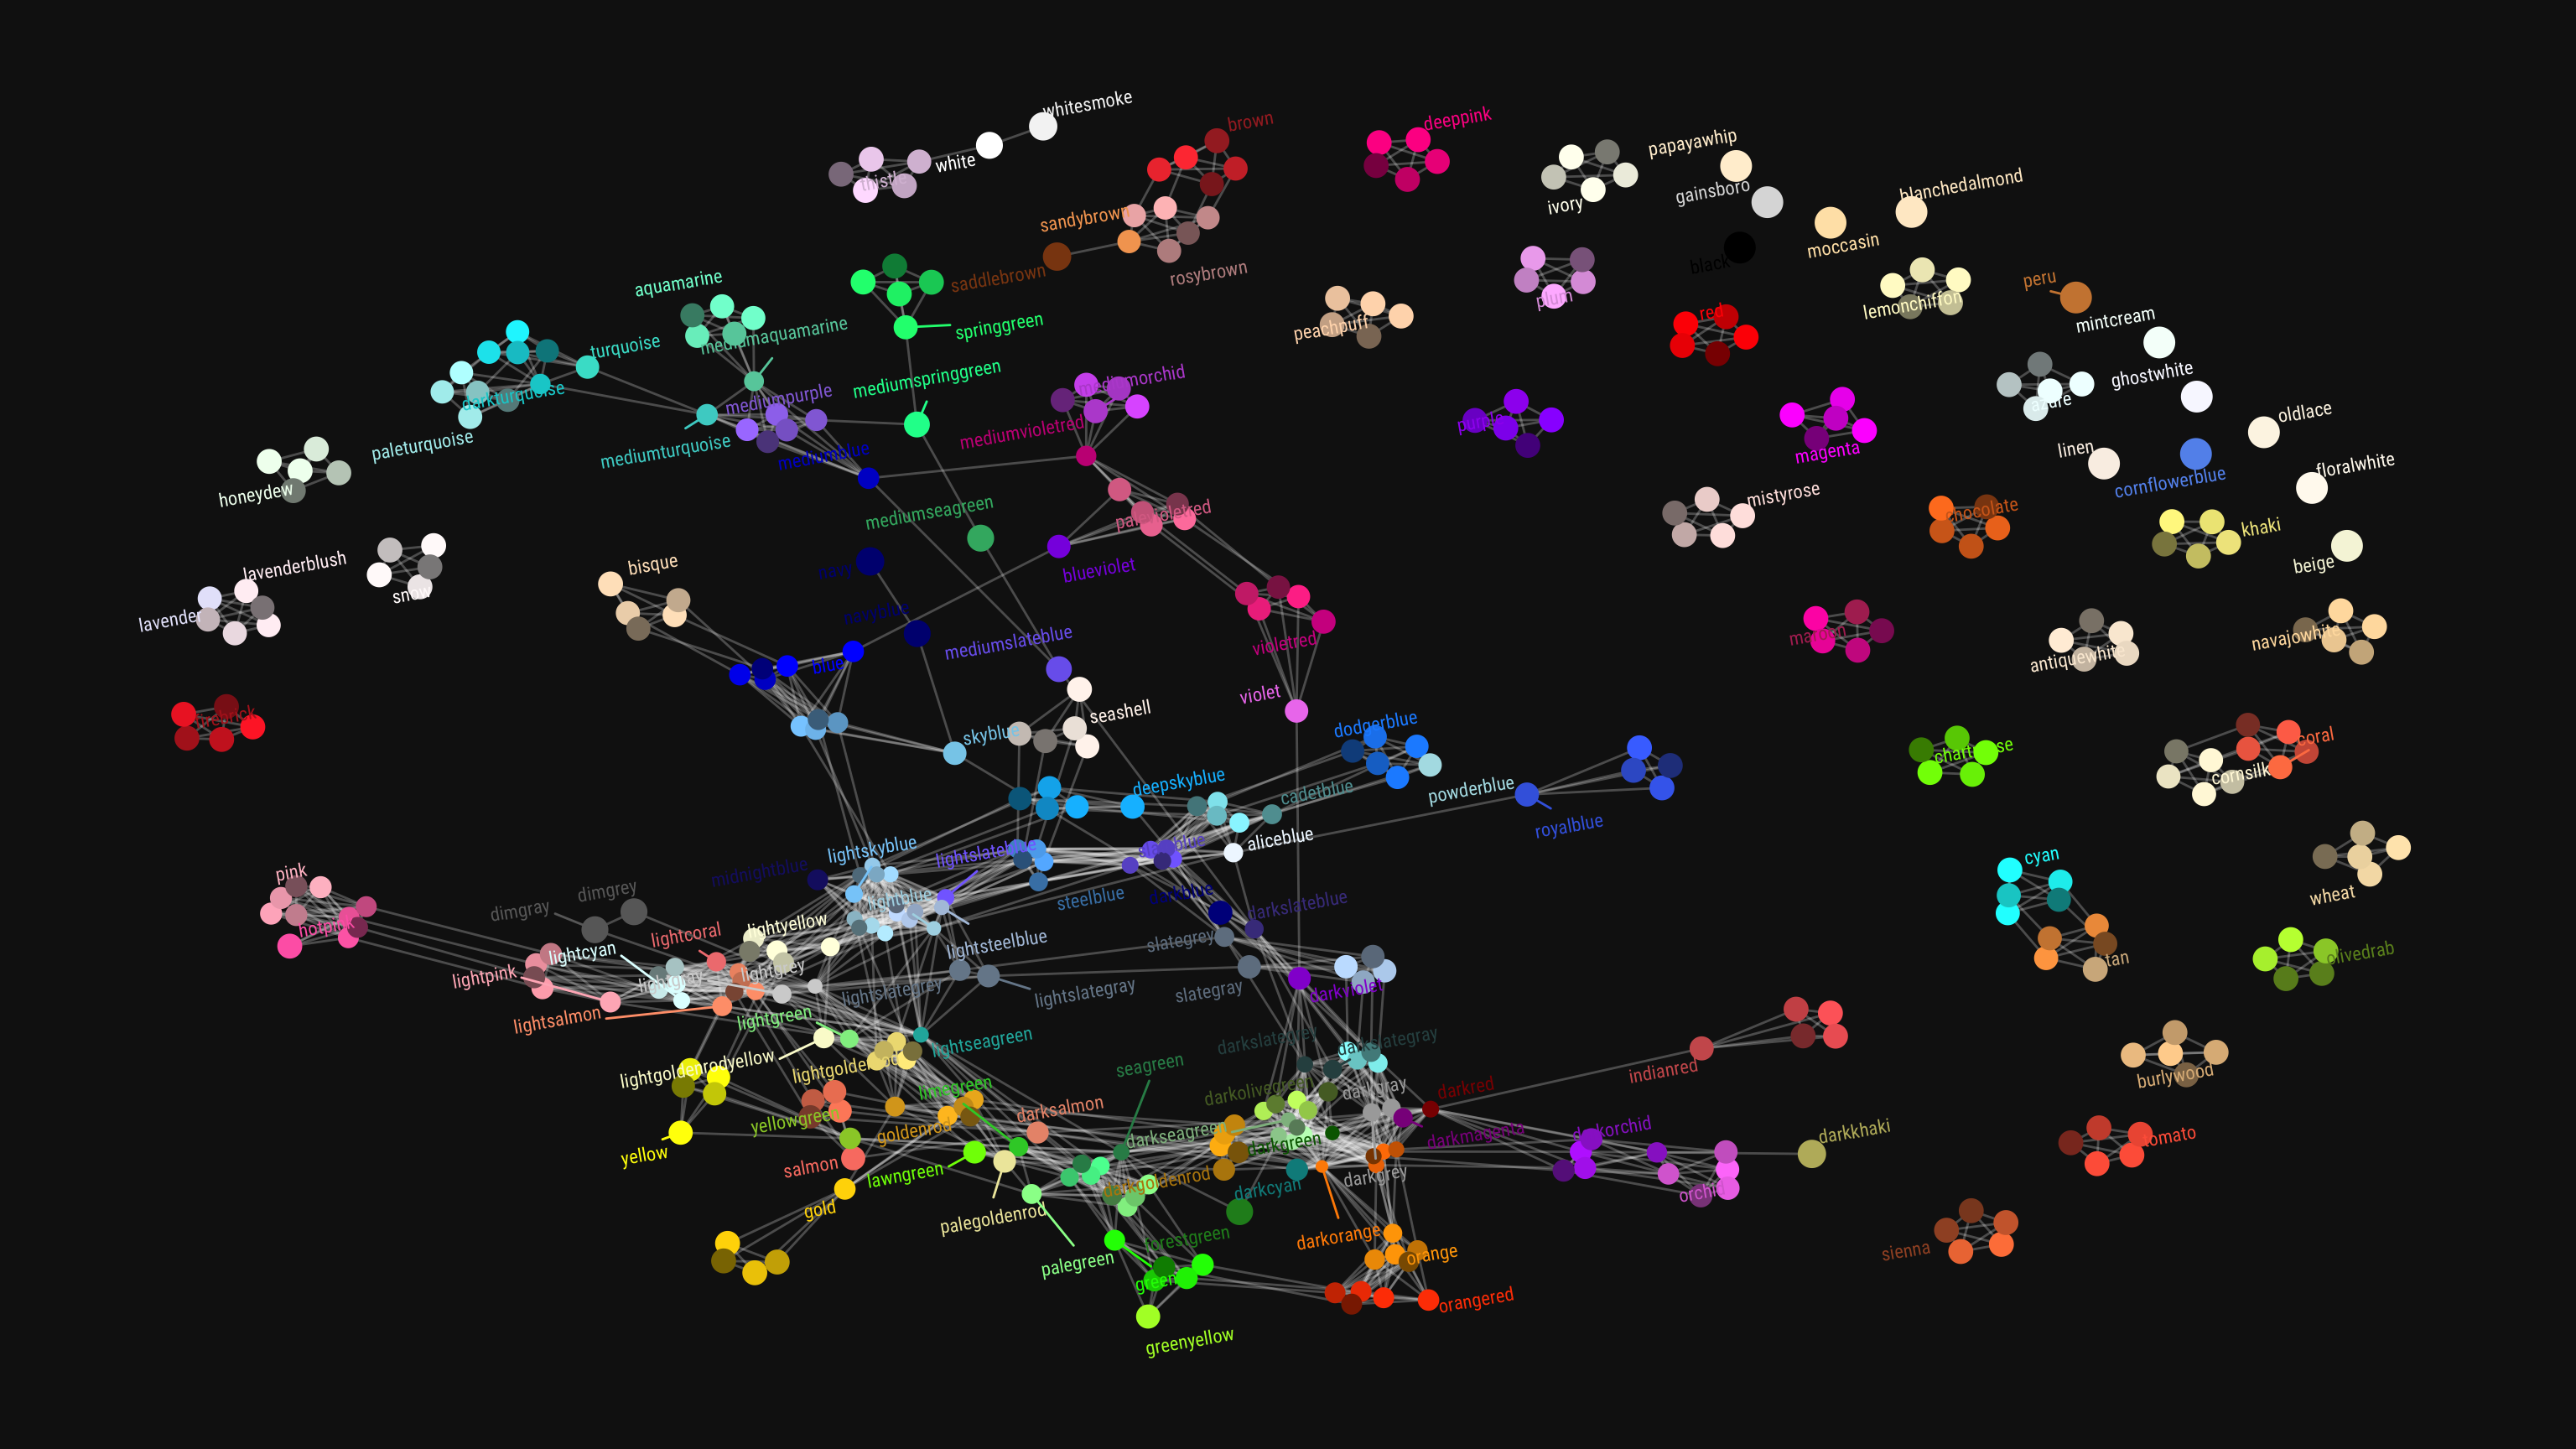
For instance, did you it’s super easy to create a reproducible though custom color palette? Or that there’s a quick reference card for ggplot2’s built-in colors? Or, and this is this blog post’s main subject, that you can access all built-in base colors using colors()!
This last trick, I learned in this recent blog post I came across, by Chisato. She explored all colors() base R incorporates, using the new ggforce and ggraph packages (thank you Thomas Lin Petersen!). Her exploration resulted in some nice visual overviews, which you can view in more detail in the original blog here.
