
Jan-Willem Tulp pointed out this amazing tool to choose a color palette: https://colorcurves.app
You can choose between either a continuous palette or a discrete palette, with groups that is.
Here’s an example of an exponential color curve for a continuous palette using colorcurves.app:
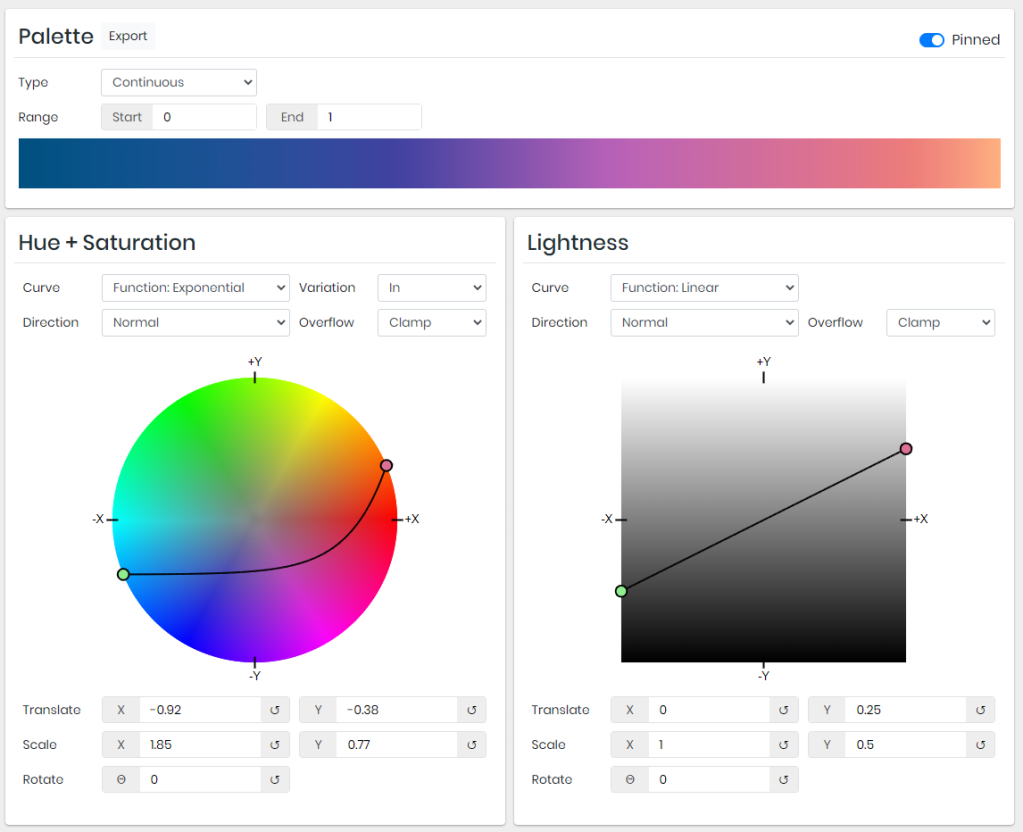
There are numerous functions you can use to make your “gradient color curve“.
Similarly, you can specify the lightness of the different colors along your curve.
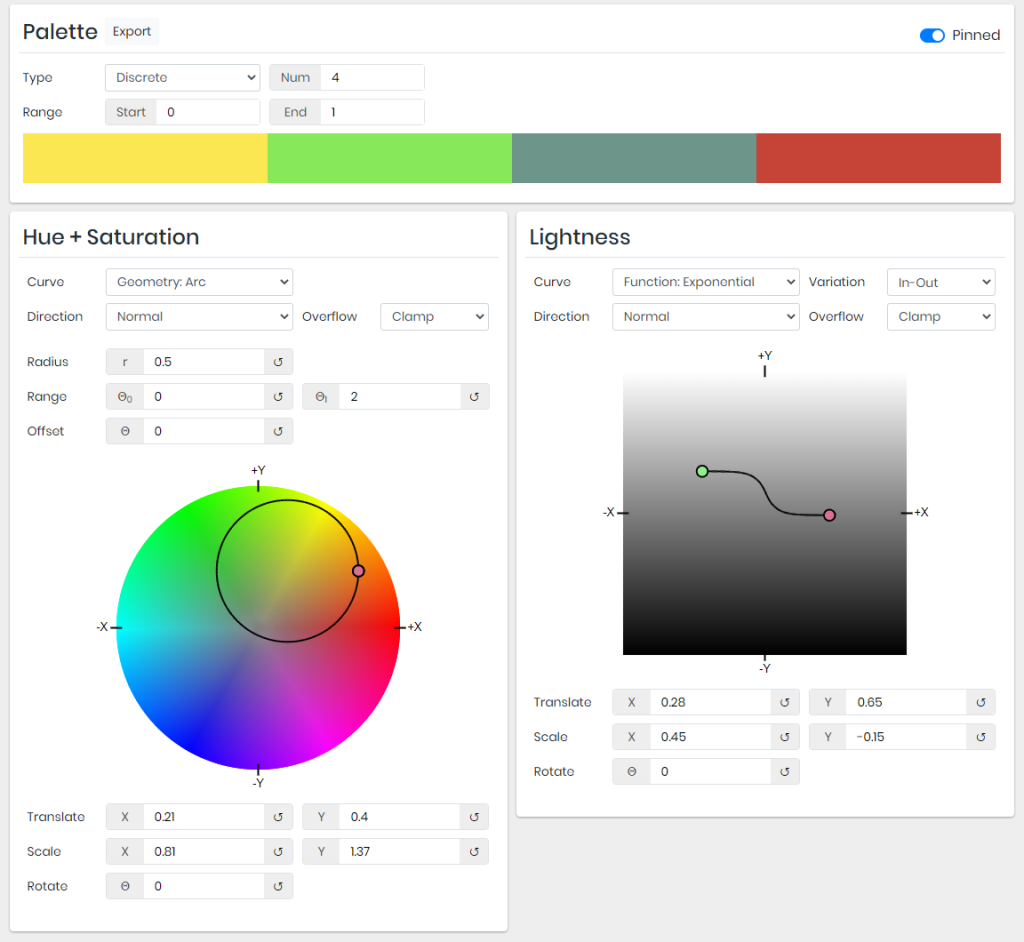
Here’s another example, of an color arc for a categorical / discrete palette using colorcurves.app:


