Vincent Warmerdam shared this Youtube video which I thoroughly enjoyed watched. It’s about Saul Pwanson, a software engineer whose hobby project got a little out of hand.
In 2016, Saul Pwanson designed a plain-text file format for crossword puzzle data, and then spent a couple of months building a micro-data-pipeline, scraping tens of thousands of crosswords from various sources.
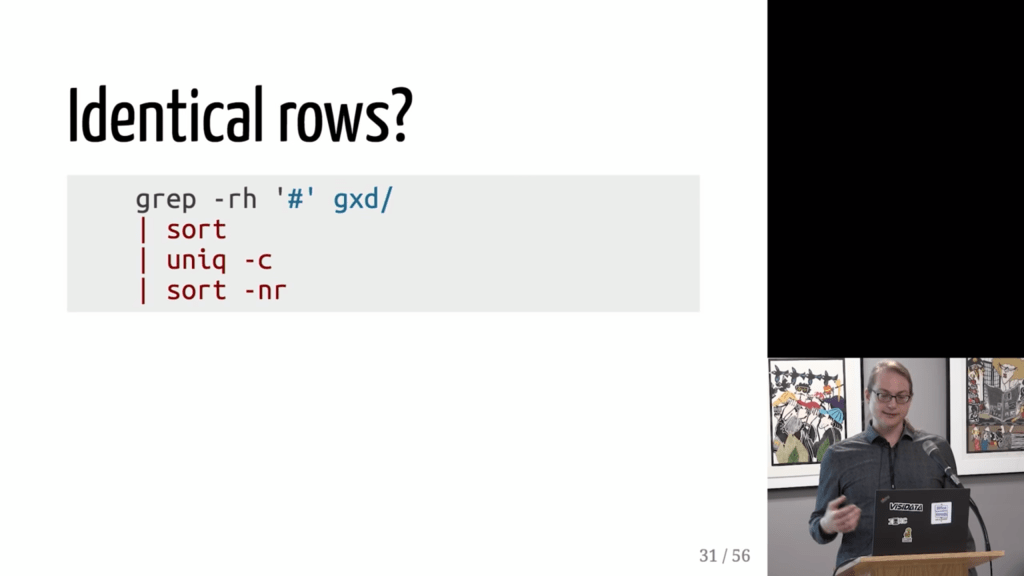
After putting all these crosswords in a simple uniform format, Saul used some simple command line commands to check for common patterns and irregularities.
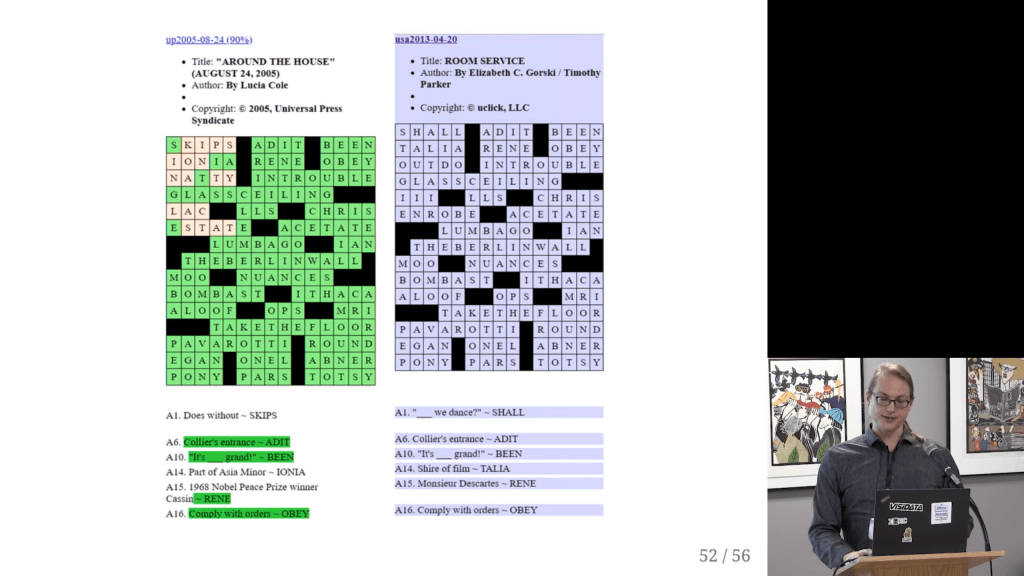
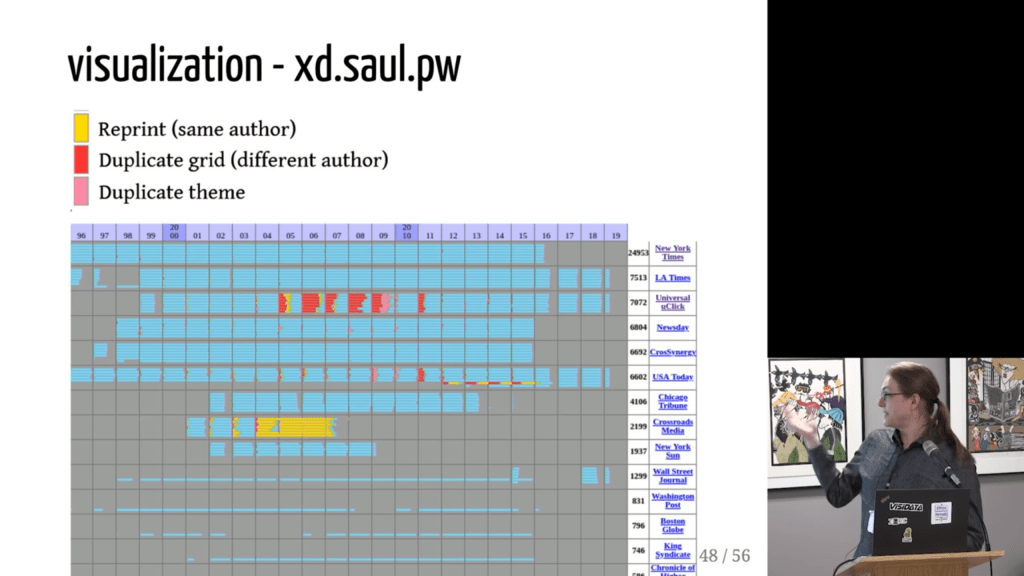
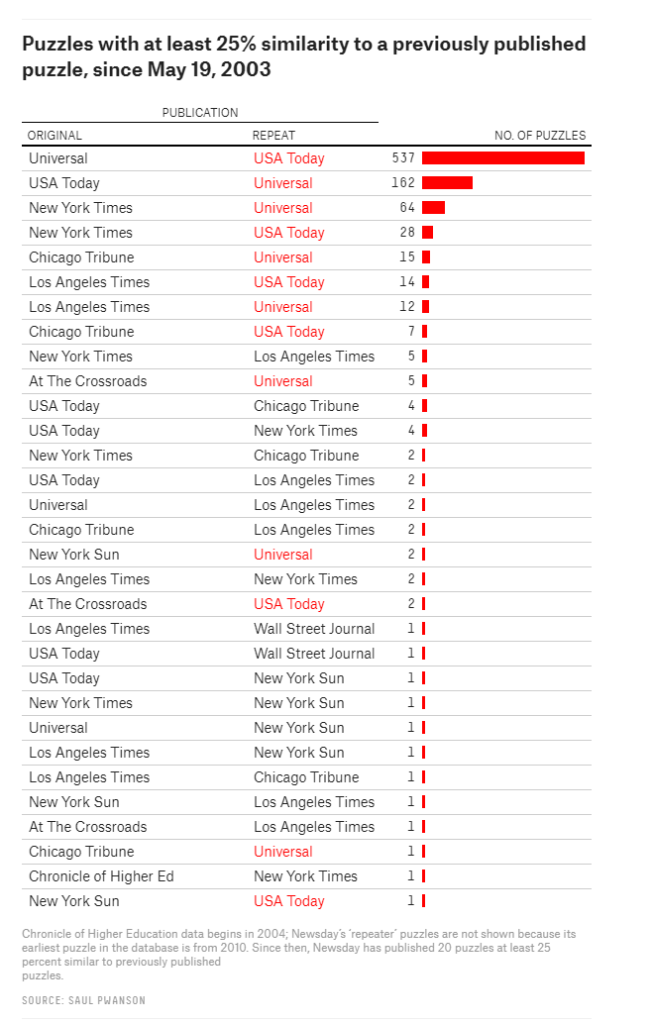
Surprisingly enough, after visualizing the results, Saul discovered egregious plagiarism by a major crossword editor that had gone on for years.
I thoroughly enjoyed watching this talk on Youtube.
Saul covers the file format, data pipeline, and the design choices that aided rapid exploration; the evidence for the scandal, from the initial anomalies to the final damning visualization; and what it’s like for a data project to get 15 minutes of fame.
I tried to localize the dataset online, but it seems Saul’s website has since gone offline. If you do happen to find it, please do share it in the comments!
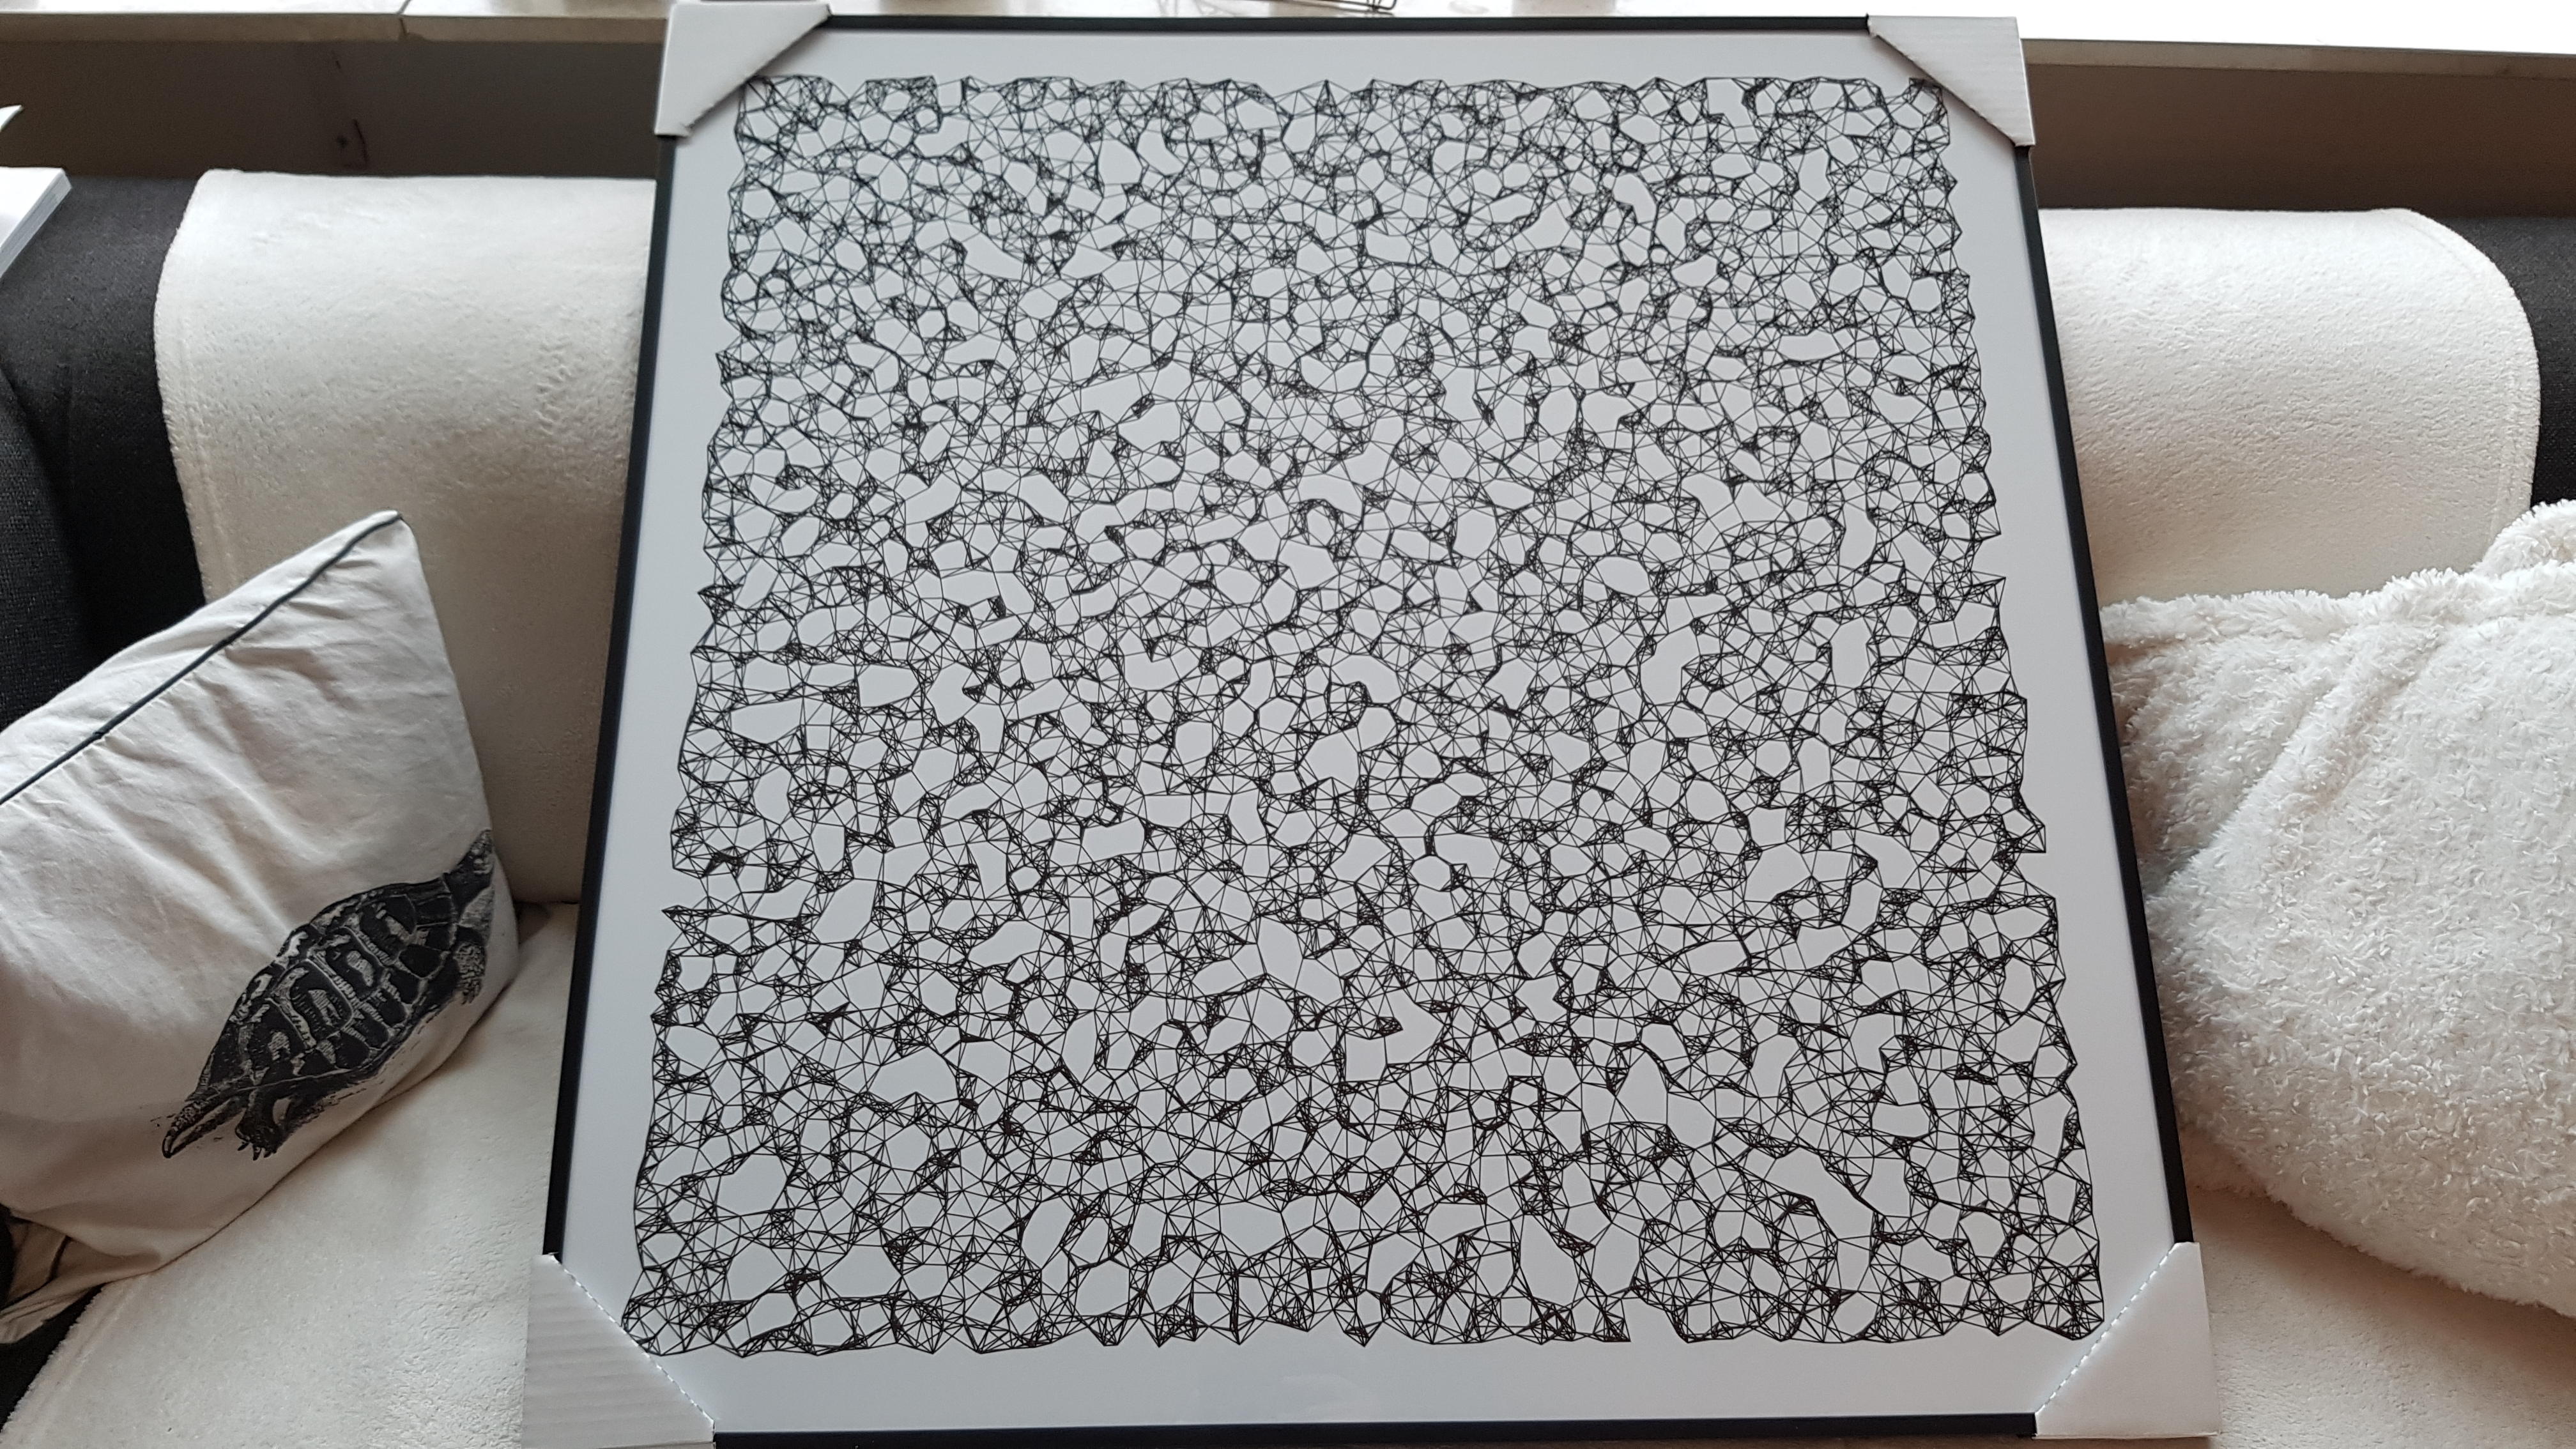
Marcus Volz is a research fellow at the University of Melbourne, studying geometric networks, optimisation and computational geometry. He’s interested in visualisation, and always looking for opportunities to represent complex information in novel ways to accelerate learning and uncover the unexpected.
One of Marcus’ hobbies is the visualization of mathematical patterns and statistical algorithms via R. He has a whole portfolio full of them, including a Github page with all the associated R code. For my recent promotion, my girlfriend asked Marcus to generate a K-nearest neighbors visual and she had it printed on a large canvas.
The picture contains about 10.000 points, randomly uniformly distributed across x and y, connected by lines with their closest k other points. Marcus shared the code to generate such k-nearest neighbor algorithm plots here on Github. So if you know your way around R, you could make your own version:
#' k-nearest neighbour graph
#'
#' Computes a k-nearest neighbour graph for a given set of points. Refer to the \href{https://en.wikipedia.org/wiki/Nearest_neighbor_graph}{Wikipedia article} for details.
#' @param points A data frame with x, y coordinates for the points
#' @param k Number of neighbours
#' @keywords nearest neightbour graph
#' @export
#' @examples
#' k_nearest_neighbour_graph()

k_nearest_neighbour_graph <- function(points, k=8) {
  get_k_nearest <- function(points, ptnum, k) {
    xi <- points$x[ptnum]
    yi <- points$y[ptnum]     points %>%
      dplyr::mutate(dist = sqrt((x - xi)^2 + (y - yi)^2)) %>%
      dplyr::arrange(dist) %>%
      dplyr::filter(row_number() %in% seq(2, k+1)) %>%
      dplyr::mutate(xend = xi, yend = yi)
  }

  1:nrow(points) %>%
    purrr::map_df(~get_k_nearest(points, ., k))
}
Those less versed in R can use Marcus package mathart. With this package, Marcus shares many more visual depictions of cool algorithms! You can install the package and several dependencies with the following lines of code:
This page of Marcus’ mathart Github repository contains the code exact code for these and many other visualizations of algorithms and statistical phenomena. Do check it out if you’re interested!
Also, check out the “Fun” section of my R tips and tricks list for more cool visuals you can generate in R!