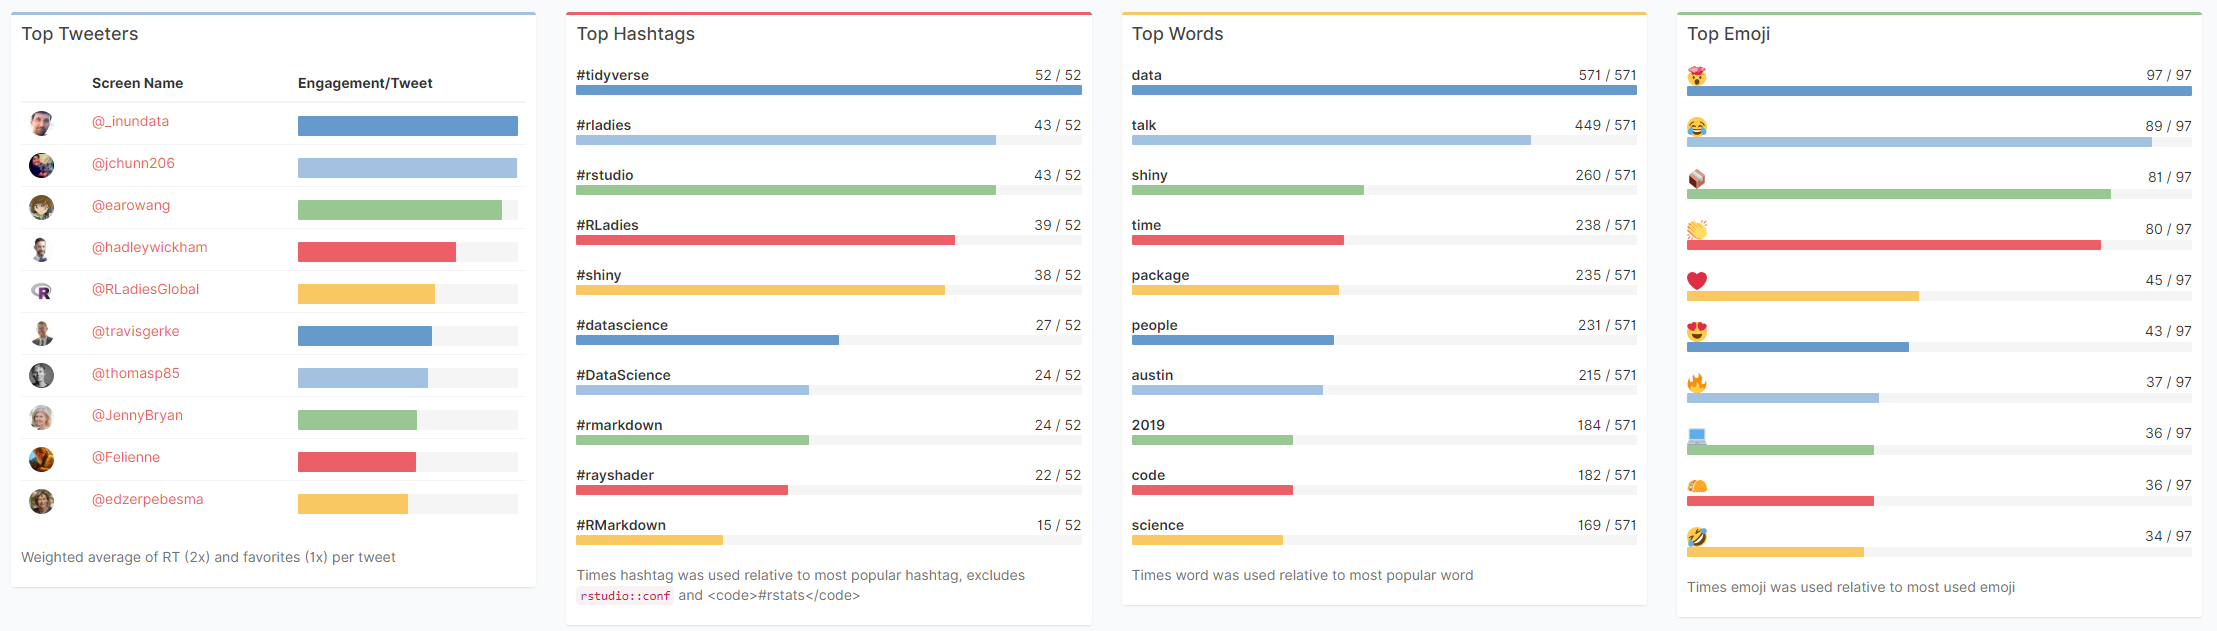
I can’t begin to count how often I have wanted to visualize a (normal) distribution in a plot. For instance to show how my sample differs from expectations, or to highlight the skewness of the scores on a particular variable. I wish I’d known earlier that I could just add one simple geom to my ggplot!
Want a different mean and standard deviation, just add a list to the args argument:
Josh Starmer is assistant professor at the genetics department of the University of North Carolina at Chapel Hill.
But more importantly: Josh is the mastermind behind StatQuest!
StatQuest is a Youtube channel (and website) dedicated to explaining complex statistical concepts — like data distributions, probability, or novel machine learning algorithms — in simple terms.
Once you watch one of Josh’s “Stat-Quests”, you immediately recognize the effort he put into this project. Using great visuals, a just-about-right pace, and relateable examples, Josh makes statistics accessible to everyone. For instance, take this series on logistic regression:
And do you really know what happens under the hood when you run a principal component analysis? After this video you will:
Or are you more interested in learning the fundamental concepts behind machine learning, then Josh has some videos for you, for instance on bias and variance or gradient descent:
With nearly 200 videos and counting, StatQuest is truly an amazing resource for students ‘and teachers on topics related to statistics and data analytics. For some of the concepts, Josh even posted videos running you through the analysis steps and results interpretation in the R language.
StatQuest started out as an attempt to explain statistics to my co-workers – who are all genetics researchers at UNC-Chapel Hill. They did these amazing experiments, but they didn’t always know what to do with the data they generated. That was my job. But I wanted them to understand that what I do isn’t magic – it’s actually quite simple. It only seems hard because it’s all wrapped up in confusing terminology and typically communicated using equations. I found that if I stripped away the terminology and communicated the concepts using pictures, it became easy to understand.
Over time I made more and more StatQuests and now it’s my passion on YouTube.
Fortunately, so much of the conference is shared on Twitter and media outlets that I still felt included. Here are some things that I liked and learned from, despite the Austin-Tilburg distance.
Garrick Aden-Buie made a fabulous Shiny app that allows you to review all #rstudioconf tweets during and since the conference. It even includes some random statistics about the tweets, and a page with all the shared media.
Data scientists can fail by: ❌not saying no enough ❌not providing anything more than a cursory analysis ❌assuming PM knows enough to ask question in the right way and not collaborating with them ❌caring more about using fancy method than solving business problems#rstudioconf
Did you know that RStudio also posts all the webinars they host? There really are some hidden pearls among them. For instance, this presentation by Nathan Stephens on rendering rmarkdown to powerpoint will save me tons of work, and those new to broom will also be astonished by this webinar by Alex Hayes.
Marcus Volz is a research fellow at the University of Melbourne, studying geometric networks, optimisation and computational geometry. He’s interested in visualisation, and always looking for opportunities to represent complex information in novel ways to accelerate learning and uncover the unexpected.
One of Marcus’ hobbies is the visualization of mathematical patterns and statistical algorithms via R. He has a whole portfolio full of them, including a Github page with all the associated R code. For my recent promotion, my girlfriend asked Marcus to generate a K-nearest neighbors visual and she had it printed on a large canvas.
The picture contains about 10.000 points, randomly uniformly distributed across x and y, connected by lines with their closest k other points. Marcus shared the code to generate such k-nearest neighbor algorithm plots here on Github. So if you know your way around R, you could make your own version:
#' k-nearest neighbour graph
#'
#' Computes a k-nearest neighbour graph for a given set of points. Refer to the \href{https://en.wikipedia.org/wiki/Nearest_neighbor_graph}{Wikipedia article} for details.
#' @param points A data frame with x, y coordinates for the points
#' @param k Number of neighbours
#' @keywords nearest neightbour graph
#' @export
#' @examples
#' k_nearest_neighbour_graph()
k_nearest_neighbour_graph <- function(points, k=8) {
get_k_nearest <- function(points, ptnum, k) {
xi <- points$x[ptnum]
yi <- points$y[ptnum] points %>%
dplyr::mutate(dist = sqrt((x - xi)^2 + (y - yi)^2)) %>%
dplyr::arrange(dist) %>%
dplyr::filter(row_number() %in% seq(2, k+1)) %>%
dplyr::mutate(xend = xi, yend = yi)
}
1:nrow(points) %>%
purrr::map_df(~get_k_nearest(points, ., k))
}
Those less versed in R can use Marcus package mathart. With this package, Marcus shares many more visual depictions of cool algorithms! You can install the package and several dependencies with the following lines of code:
This page of Marcus’ mathart Github repository contains the code exact code for these and many other visualizations of algorithms and statistical phenomena. Do check it out if you’re interested!
Also, check out the “Fun” section of my R tips and tricks list for more cool visuals you can generate in R!
Disclaimer: This page contains links to Amazon’s book shop. Any purchases through those links provide us with a small commission that helps to host this blog.
Useful base functions
str() – explore structure of R object
trimws() – trim trailing and/or leading whitespaces
dput() – dump an R object in form of R code
cut()– categorize values into intervals
intersect() – returns similar elements in two vectors
union() – find intersecting items in two vectors
setdiff() – returns different elements in two vectors
interaction() – computes a factor which represents the interaction of the given factors
formatC()can be used to round numbers and force trailing zero’s
formatC() and sprintf() can be used to add leading/trailing characters
expand.grid() – create a data frame from all combinations of the supplied vectors or factors
seq_along(myvec) – generates a vector of 1:length(myvec)
Generate distributions in ggplot2 using the stat_function function. Normal distributions, student t-distributions, beta distributions, anything. See also here.
rstudio::conf is theyearly conference when it comes to R programming and RStudio. In 2017, nearly 500 people attended and, last week, 1100 people went to the 2018 edition. Regretfully, I was on holiday in Cardiff and missed out on meeting all my #rstats hero’s. Just browsing through the #rstudioconf Twitter-feed, I already learned so many new things that I decided to dedicate a page to it!
Fortunately, you can watch the live streams taped during the conference:
One of the workshops deserves an honorable mention. Jenny Bryan presented on What they forgot to teach you about R, providing some excellent advice on reproducible workflows. It elaborates on her earlier blog on project-oriented workflows, which you should read if you haven’t yet. Some best pRactices Jenny suggests:
Restart R often. This ensures your code is still working as intended. Use Shift-CMD-F10 to do so quickly in RStudio.
Use stable instead of absolute paths. This allows you to (1) better manage your imports/exports and folders, and (2) allows you to move/share your folders without the code breaking. For instance, here::here("data","raw-data.csv") loads the raw-data.csv-file from the data folder in your project directory. If you are not using the here package yet, you are honestly missing out! Alternatively you can use fs::path_home(). normalizePath() will make paths work on both windows and mac. You can usebasename instead of strsplit to get name of file from a path.
To upload an existing git directory to GitHub easily, you can usethis::use_github().
If you include the below YAML header in your .R file, you can easily generate .md files for you github repo.
#' ---
#' output: github_document
#' ---
Moreover, Jenny proposed these useful default settings for knitr:
Another of Jenny Bryan‘s talks was named Data Rectangling and although you might not get much out of her slides without her presenting them, you should definitely try the associated repurrrsivetutorial if you haven’t done so yet. It’s a poweR up for any useR!
I can’t remember who shared it, but a very cool trick is to name the viewing tab of any dataframe you pipe into View() using df %>% View("enter_view_tab_name").
These probably only present a minimal portion of the thousands of tips and tricks you could have learned by simply attending rstudio::conf. I will definitely try to attend next year’s edition. Nevertheless, I hope the above has been useful. If I missed out on any tips, presentations, tweets, or other materials, please reply below, tweet me or pop me a message!