Tag: bayesian

Bayesian Statistics using R, Python, and Stan

Bayesian Statistics using R, Python, and Stan

For a year now, this course on Bayesian statistics has been on my to-do list. So without further ado, I decided to share it with you already.

Richard McElreath is an evolutionary ecologist who is famous in the stats community for his work on Bayesian statistics.

At the Max Planck Institute for Evolutionary Anthropology, Richard teaches Bayesian statistics, and he was kind enough to put his whole course on Statistical Rethinking: Bayesian statistics using R & Stan open access online.

You can find the video lectures here on Youtube, and the slides are linked to here:

Richard also wrote a book that accompanies this course:

For more information abou the book, click here.

For the Python version of the code examples, click here.

Solutions to working with small sample sizes

Solutions to working with small sample sizes

Both in science and business, we often experience difficulties collecting enough data to test our hypotheses, either because target groups are small or hard to access, or because data collection entails prohibitive costs.

Such obstacles may result in data sets that are too small for the complexity of the statistical model needed to answer the questions we’re really interested in.

Several scholars teamed up and wrote this open access book: Small Sample Size Solutions.

This unique book provides guidelines and tools for implementing solutions to issues that arise in small sample studies. Each chapter illustrates statistical methods that allow researchers and analysts to apply the optimal statistical model for their research question when the sample is too small.

This book will enable anyone working with data to test their hypotheses even when the statistical model required for answering their questions are too complex for the sample sizes they can collect. The covered statistical models range from the estimation of a population mean to models with latent variables and nested observations, and solutions include both classical and Bayesian methods. All proposed solutions are described in steps researchers can implement with their own data and are accompanied with annotated syntax in R.

You can access the book for free here!

Simulating data with Bayesian networks, by Daniel Oehm

Simulating data with Bayesian networks, by Daniel Oehm

Daniel Oehm wrote this interesting blog about how to simulate realistic data using a Bayesian network.

Bayesian networks are a type of probabilistic graphical model that uses Bayesian inference for probability computations. Bayesian networks aim to model conditional dependence, and therefore causation, by representing conditional dependence by edges in a directed graph. Through these relationships, one can efficiently conduct inference on the random variables in the graph through the use of factors.

Devin Soni via Medium

As Bayes nets represent data as a probabilistic graph, it is very easy to use that structure to simulate new data that demonstrate the realistic patterns of the underlying causal system. Daniel’s post shows how to do this with bnlearn.

Daniel’s example Bayes net

New data is simulated from a Bayes net (see above) by first sampling from each of the root nodes, in this case sex. Then followed by the children conditional on their parent(s) (e.g. sport | sex and hg | sex) until data for all nodes has been drawn. The numbers on the nodes below indicate the sequence in which the data is simulated, noting that rcc is the terminal node.

Daniel Oehms in his blog

The original and simulated datasets are compared in a couple of ways 1) observing the distributions of the variables 2) comparing the output from various models and 3) comparing conditional probability queries. The third test is more of a sanity check. If the data is generated from the original Bayes net then a new one fit on the simulated data should be approximately the same. The more rows we generate the closer the parameters will be to the original values.

The original data alongside the generated data in Daniel’s example

As you can see, a Bayesian network allows you to generate data that looks, feels, and behaves a lot like the data on which you based your network on in the first place.

This can be super useful if you want to generate a synthetic / fake / artificial dataset without sharing personal or sensitive data.

Moreover, the underlying Bayesian net can be very useful to compute missing values. In Daniel’s example, he left out some values on purpose (pretending they were missing) and imputed them with the Bayes net. He found that the imputed values for the missing data points were quite close to the original ones:

For two variables, the original values plotted against the imputed replacements.

In the original blog, Daniel goes on to show how to further check the integrity of the simulated data using statistical models and shares all his code so you can try this out yourself. Please do give his website a visit as Daniel has many more interesting statistics blogs!

E-Book: Probabilistic Programming & Bayesian Methods for Hackers

E-Book: Probabilistic Programming & Bayesian Methods for Hackers

The Bayesian method is the natural approach to inference, yet it is hidden from readers behind chapters of slow, mathematical analysis. Nevertheless, mathematical analysis is only one way to “think Bayes”. With cheap computing power, we can now afford to take an alternate route via probabilistic programming.

Cam Davidson-Pilon wrote the book Bayesian Methods for Hackers as a introduction to Bayesian inference from a computational and understanding-first, mathematics-second, point of view.

The book is available via Amazon, but you can access an online e-book for free. There’s also an associated GitHub repo.

The book explains Bayesian principles with code and visuals. For instance:

%matplotlib inline
from IPython.core.pylabtools import figsize
import numpy as np
from matplotlib import pyplot as plt
figsize(11, 9)

import scipy.stats as stats

dist = stats.beta
n_trials = [0, 1, 2, 3, 4, 5, 8, 15, 50, 500]
data = stats.bernoulli.rvs(0.5, size=n_trials[-1])
x = np.linspace(0, 1, 100)

for k, N in enumerate(n_trials):
    sx = plt.subplot(len(n_trials)/2, 2, k+1)
    plt.xlabel("$p$, probability of heads") \
        if k in [0, len(n_trials)-1] else None
    plt.setp(sx.get_yticklabels(), visible=False)
    heads = data[:N].sum()
    y = dist.pdf(x, 1 + heads, 1 + N - heads)
    plt.plot(x, y, label="observe %d tosses,\n %d heads" % (N, heads))
    plt.fill_between(x, 0, y, color="#348ABD", alpha=0.4)
    plt.vlines(0.5, 0, 4, color="k", linestyles="--", lw=1)

    leg = plt.legend()
    leg.get_frame().set_alpha(0.4)
    plt.autoscale(tight=True)


plt.suptitle("Bayesian updating of posterior probabilities",
             y=1.02,
             fontsize=14)

plt.tight_layout()

I can only recommend you start with the online version of Bayesian Methods for Hackers, but note that the print version helps sponsor the author ánd includes some additional features:

  • Additional Chapter on Bayesian A/B testing
  • Updated examples
  • Answers to the end of chapter questions
  • Additional explanation, and rewritten sections to aid the reader.

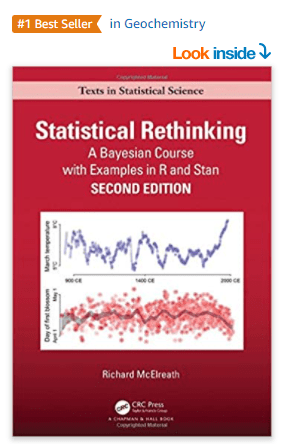
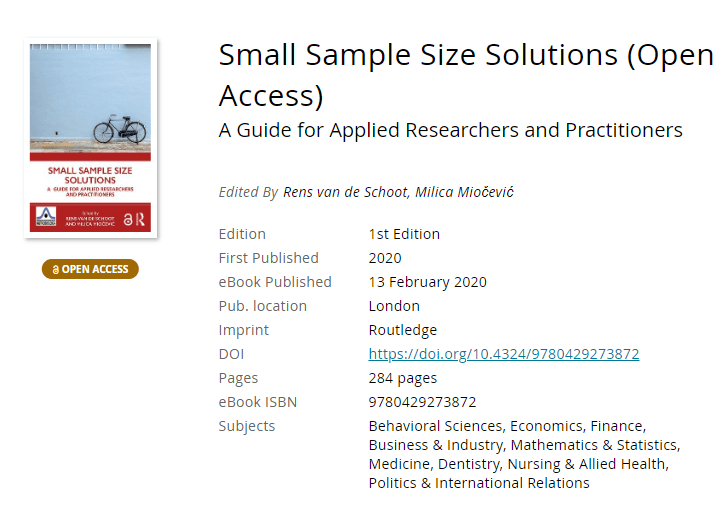
If you’re interested in learning more about Bayesian analysis, I recommend these other books:

Helpful resources for A/B testing

Helpful resources for A/B testing

Brandon Rohrer — (former) data scientist at Microsoft, iRobot, and Facebook — asked his network on Twitter and LinkedIn to share their favorite resources on A/B testing. It produced a nice list, which I summarized below.

The order is somewhat arbitrary, and somewhat based on my personal appreciation of the resources.

Cover image via Optimizely

PyData, London 2018

PyData, London 2018

PyData provides a forum for the international community of users and developers of data analysis tools to share ideas and learn from each other. The communities approach data science using many languages, including (but not limited to) Python, Julia, and R.

April 2018, a PyData conference was held in London, with three days of super interesting sessions and hackathons. While I couldn’t attend in person, I very much enjoy reviewing the sessions at home as all are shared open access on YouTube channel PyDataTV!

In the following section, I will outline some of my favorites as I progress through the channel:

Winning with simple, even linear, models:

One talk that really resonated with me is Vincent Warmerdam‘s talk on “Winning with Simple, even Linear, Models“. Working at GoDataDriven, a data science consultancy firm in the Netherlands, Vincent is quite familiar with deploying deep learning models, but is also midly annoyed by all the hype surrounding deep learning and neural networks. Particularly when less complex models perform equally well or only slightly less. One of his quote’s nicely sums it up:

“Tensorflow is a cool tool, but it’s even cooler when you don’t need it!”

— Vincent Warmerdam, PyData 2018

In only 40 minutes, Vincent goes to show the finesse of much simpler (linear) models in all different kinds of production settings. Among others, Vincent shows:

  • how to solve the XOR problem with linear models
  • how to win at timeseries with radial basis features
  • how to use weighted regression to deal with historical overfitting
  • how deep learning models introduce a new theme of horror in production
  • how to create streaming models using passive aggressive updating
  • how to build a real-time video game ranking system using mere histograms
  • how to create a well performing recommender with two SQL tables
  • how to rock at data science and machine learning using Python, R, and even Stan