Text mining and analytics, natural language processing, and topic modelling have definitely become sort of an obsession of mine. I am just amazed by the insights one can retrieve from textual information, and with the ever increasing amounts of unstructured data on the internet, recreational analysts are coming up with the most amazing text mining projects these days.
Only last week, I came across posts talking about how the text in the Game of Thrones books to demonstrate a gender bias, how someone created an entire book with weirdly-satisfying computer-generated poems, and how to conduct a rather impressive analysis of your Twitter following. The latter, I copied below, with all props obviously for Shirin – the author.
For those of you who want to learn more about text mining and, specifically, how to start mining in R with tidytext, an new text-mining complement to the tidyverse, I can strongly recommend the new book by Julia Silge and David Robinson. This book has helped me greatly in learning the basics and you can definitely expect some blogs on my personal text mining projects soon.
Lately, I have been more and more taken with tidy principles of data analysis. They are elegant and make analyses clearer and easier to comprehend. Following the tidyverse and ggraph, I have been quite intrigued by applying tidy principles to text analysis with Julia Silge and David Robinson’s tidytext.
In this post, I will explore tidytext with an analysis of my Twitter followers’ descriptions to try and learn more about the people who are interested in my tweets, which are mainly about Data Science and Machine Learning.
Resources I found useful for this analysis were http://www.rdatamining.com/docs/twitter-analysis-with-r and http://tidytextmining.com/tidytext.html
I am using twitteR to retrieve data from Twitter (I have also tried rtweet but for some reason, my API key, secret and token (that worked with twitteR) resulted in a “failed to authorize” error with rtweet’s functions).
Once we have set up our Twitter REST API, we get the necessary information to authenticate our access.
consumerKey = "INSERT KEY HERE"
consumerSecret = "INSERT SECRET KEY HERE"
accessToken = "INSERT TOKEN HERE"
accessSecret = "INSERT SECRET TOKEN HERE"
options(httr_oauth_cache = TRUE)

setup_twitter_oauth(consumer_key = consumerKey,
                    consumer_secret = consumerSecret,
                    access_token = accessToken,
                    access_secret = accessSecret)
Now, we can access information from Twitter, like timeline tweets, user timelines, mentions, tweets & retweets, followers, etc.
All the following datasets were retrieved on June 7th 2017, converted to a data frame for tidy analysis and saved for later use:
- the last 3200 tweets on my timeline
my_name <- userTimeline("ShirinGlander", n = 3200, includeRts=TRUE)
my_name_df <- twListToDF(my_name)
save(my_name_df, file = "my_name.RData")
- my last 3200 mentions and retweets
my_mentions <- mentions(n = 3200)
my_mentions_df <- twListToDF(my_mentions)
save(my_mentions_df, file = "my_mentions.RData")

my_retweets <- retweetsOfMe(n = 3200)
my_retweets_df <- twListToDF(my_retweets)
save(my_retweets_df, file = "my_retweets.RData")
- the last 3200 tweets to me
tweetstome <- searchTwitter("@ShirinGlander", n = 3200)
tweetstome_df <- twListToDF(tweetstome)
save(tweetstome_df, file = "tweetstome.RData")
user <- getUser("ShirinGlander")

friends <- user$getFriends() # who I follow
friends_df <- twListToDF(friends)
save(friends_df, file = "my_friends.RData")

followers <- user$getFollowers() # my followers
followers_df <- twListToDF(followers)
save(followers_df, file = "my_followers.RData")
Analyzing friends and followers
In this post, I will have a look at my friends and followers.
load("my_friends.RData")
load("my_followers.RData")
I am going to use packages from the tidyverse (tidyquant for plotting).
library(tidyverse)
library(tidyquant)
- Number of friends (who I follow on Twitter): 225
- Number of followers (who follows me on Twitter): 324
- Number of friends who are also followers: 97
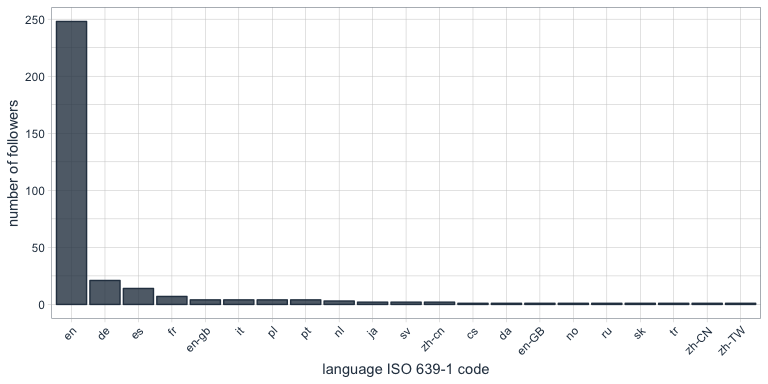
What languages do my followers speak?
One of the columns describing my followers is which language they have set for their Twitter account. Not surprisingly, English is by far the most predominant language of my followers, followed by German, Spanish and French.
followers_df %>%
  count(lang) %>%
  droplevels() %>%
  ggplot(aes(x = reorder(lang, desc(n)), y = n)) +
    geom_bar(stat = "identity", color = palette_light()[1], fill = palette_light()[1], alpha = 0.8) +
    theme_tq() +
    theme(axis.text.x = element_text(angle = 45, vjust = 1, hjust = 1)) +
    labs(x = "language ISO 639-1 code",
         y = "number of followers")
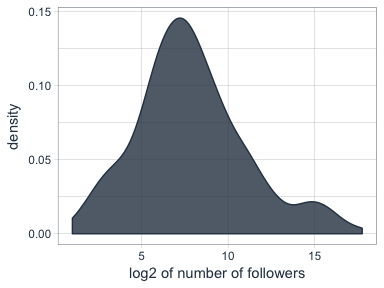
Who are my most “influential” followers (i.e. followers with the biggest network)?
I also have information about the number of followers that each of my followers have (2nd degree followers). Most of my followers are followed by up to ~ 1000 people, while only a few have a very large network.
followers_df %>%
  ggplot(aes(x = log2(followersCount))) +
    geom_density(color = palette_light()[1], fill = palette_light()[1], alpha = 0.8) +
    theme_tq() +
    labs(x = "log2 of number of followers",
         y = "density")
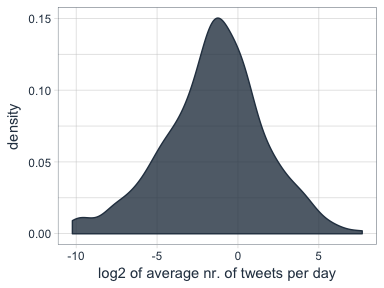
The followers data frame also tells me how many statuses (i.e. tweets) each of followers have. To make the numbers comparable, I am normalizing them by the number of days that they have had their accounts to calculate the average number of tweets per day.
followers_df %>%
  mutate(date = as.Date(created, format = "%Y-%m-%d"),
         today = as.Date("2017-06-07", format = "%Y-%m-%d"),
         days = as.numeric(today - date),
         statusesCount_pDay = statusesCount / days) %>%
  ggplot(aes(x = log2(statusesCount_pDay))) +
    geom_density(color = palette_light()[1], fill = palette_light()[1], alpha = 0.8) +
    theme_tq()
Who are my followers with the biggest network and who tweet the most?
followers_df %>%
  mutate(date = as.Date(created, format = "%Y-%m-%d"),
         today = as.Date("2017-06-07", format = "%Y-%m-%d"),
         days = as.numeric(today - date),
         statusesCount_pDay = statusesCount / days) %>%
  select(screenName, followersCount, statusesCount_pDay) %>%
  arrange(desc(followersCount)) %>%
  top_n(10)
##         screenName followersCount statusesCount_pDay
## 1        dr_morton         150937           71.35193
## 2    Scientists4EU          66117           17.64389
## 3       dr_morton_          63467           46.57763
## 4   NewScienceWrld          60092           54.65874
## 5     RubenRabines          42286           25.99592
## 6  machinelearnbot          27427          204.67061
## 7  BecomingDataSci          16807           25.24069
## 8       joelgombin           6566           21.24094
## 9    renato_umeton           1998           19.58387
## 10 FranPatogenLoco            311           28.92593
followers_df %>%
  mutate(date = as.Date(created, format = "%Y-%m-%d"),
         today = as.Date("2017-06-07", format = "%Y-%m-%d"),
         days = as.numeric(today - date),
         statusesCount_pDay = statusesCount / days) %>%
  select(screenName, followersCount, statusesCount_pDay) %>%
  arrange(desc(statusesCount_pDay)) %>%
  top_n(10)
##         screenName followersCount statusesCount_pDay
## 1  machinelearnbot          27427          204.67061
## 2        dr_morton         150937           71.35193
## 3   NewScienceWrld          60092           54.65874
## 4       dr_morton_          63467           46.57763
## 5  FranPatogenLoco            311           28.92593
## 6     RubenRabines          42286           25.99592
## 7  BecomingDataSci          16807           25.24069
## 8       joelgombin           6566           21.24094
## 9    renato_umeton           1998           19.58387
## 10   Scientists4EU          66117           17.64389
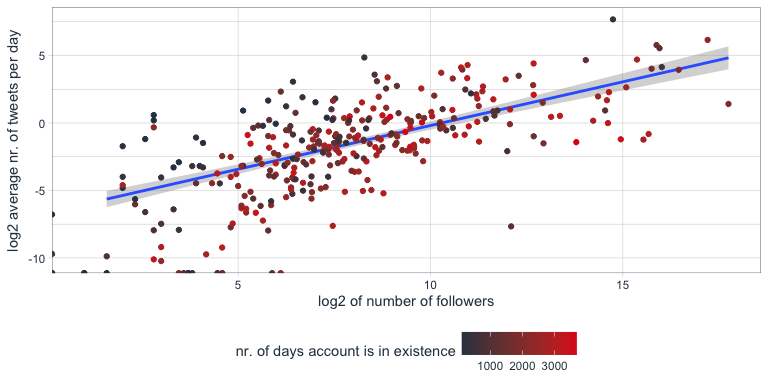
Is there a correlation between number of followers and number of tweets?
Indeed, there seems to be a correlation that users with many followers also tend to tweet more often.
followers_df %>%
  mutate(date = as.Date(created, format = "%Y-%m-%d"),
         today = as.Date("2017-06-07", format = "%Y-%m-%d"),
         days = as.numeric(today - date),
         statusesCount_pDay = statusesCount / days) %>%
  ggplot(aes(x = followersCount, y = statusesCount_pDay, color = days)) +
    geom_smooth(method = "lm") +
    geom_point() +
    scale_color_continuous(low = palette_light()[1], high = palette_light()[2]) +
    theme_tq()
Tidy text analysis
Next, I want to know more about my followers by analyzing their Twitter descriptions with the tidytext package.
library(tidytext)
library(SnowballC)
To prepare the data, I am going to unnest the words (or tokens) in the user descriptions, convert them to the word stem, remove stop words and urls.
data(stop_words)

tidy_descr <- followers_df %>%
  unnest_tokens(word, description) %>%
  mutate(word_stem = wordStem(word)) %>%
  anti_join(stop_words, by = "word") %>%
  filter(!grepl("\\.|http", word))
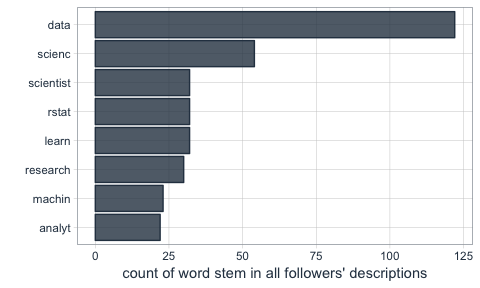
What are the most commonly used words in my followers’ descriptions?
The first question I want to ask is what words are most common in my followers’ descriptions.
Not surprisingly, the most common word is “data”. I do tweet mostly about data related topics, so it makes sense that my followers are mostly likeminded. The rest is also related to data science, machine learning and R.
tidy_descr %>%
  count(word_stem, sort = TRUE) %>%
  filter(n > 20) %>%
  ggplot(aes(x = reorder(word_stem, n), y = n)) +
    geom_col(color = palette_light()[1], fill = palette_light()[1], alpha = 0.8) +
    coord_flip() +
    theme_tq() +
    labs(x = "",
         y = "count of word stem in all followers' descriptions")
This, we can also show with a word cloud.
library(wordcloud)
library(tm)
tidy_descr %>%
  count(word_stem) %>%
  mutate(word_stem = removeNumbers(word_stem)) %>%
  with(wordcloud(word_stem, n, max.words = 100, colors = palette_light()))

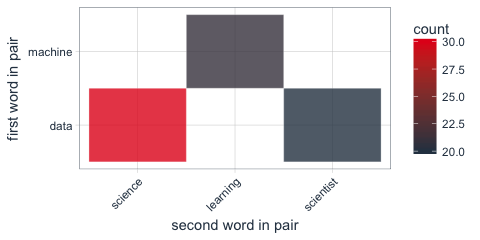
Instead of looking for the most common words, we can also look for the most common ngrams: here, for the most common word pairs (bigrams) in my followers’ descriptions.
tidy_descr_ngrams <- followers_df %>%
  unnest_tokens(bigram, description, token = "ngrams", n = 2) %>%
  filter(!grepl("\\.|http", bigram)) %>%
  separate(bigram, c("word1", "word2"), sep = " ") %>%
  filter(!word1 %in% stop_words$word) %>%
  filter(!word2 %in% stop_words$word)

bigram_counts <- tidy_descr_ngrams %>%
  count(word1, word2, sort = TRUE)
bigram_counts %>%
  filter(n > 10) %>%
  ggplot(aes(x = reorder(word1, -n), y = reorder(word2, -n), fill = n)) +
    geom_tile(alpha = 0.8, color = "white") +
    scale_fill_gradientn(colours = c(palette_light()[[1]], palette_light()[[2]])) +
    coord_flip() +
    theme_tq() +
    theme(legend.position = "right") +
    theme(axis.text.x = element_text(angle = 45, vjust = 1, hjust = 1)) +
    labs(x = "first word in pair",
         y = "second word in pair")
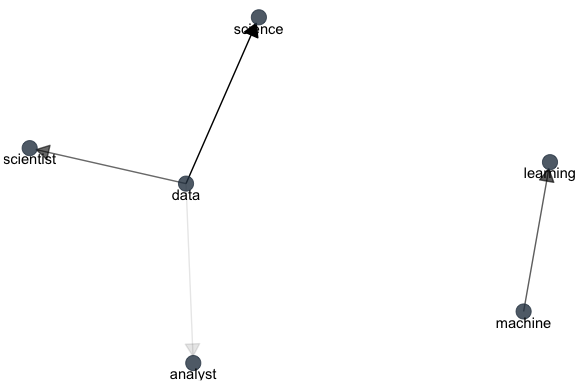
These, we can also show as a graph:
library(igraph)
library(ggraph)
bigram_graph <- bigram_counts %>%
  filter(n > 5) %>%
  graph_from_data_frame()

set.seed(1)

a <- grid::arrow(type = "closed", length = unit(.15, "inches"))
ggraph(bigram_graph, layout = "fr") +
  geom_edge_link(aes(edge_alpha = n), show.legend = FALSE,
                 arrow = a, end_cap = circle(.07, 'inches')) +
  geom_node_point(color =  palette_light()[1], size = 5, alpha = 0.8) +
  geom_node_text(aes(label = name), vjust = 1, hjust = 0.5) +
  theme_void()
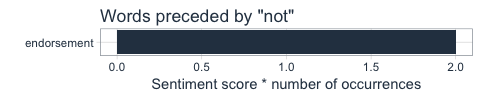
We can also use bigram analysis to identify negated meanings (this will become relevant for sentiment analysis later). So, let’s look at which words are preceded by “not” or “no”.
bigrams_separated <- followers_df %>%
  unnest_tokens(bigram, description, token = "ngrams", n = 2) %>%
  filter(!grepl("\\.|http", bigram)) %>%
  separate(bigram, c("word1", "word2"), sep = " ") %>%
  filter(word1 == "not" | word1 == "no") %>%
  filter(!word2 %in% stop_words$word)

not_words <- bigrams_separated %>%
  filter(word1 == "not") %>%
  inner_join(get_sentiments("afinn"), by = c(word2 = "word")) %>%
  count(word2, score, sort = TRUE) %>%
  ungroup()
not_words %>%
  mutate(contribution = n * score) %>%
  arrange(desc(abs(contribution))) %>%
  head(20) %>%
  mutate(word2 = reorder(word2, contribution)) %>%
  ggplot(aes(word2, n * score, fill = n * score > 0)) +
    geom_col(show.legend = FALSE) +
    scale_fill_manual(values = palette_light()) +
    labs(x = "",
         y = "Sentiment score * number of occurrences",
         title = "Words preceded by \"not\"") +
    coord_flip() +
    theme_tq()
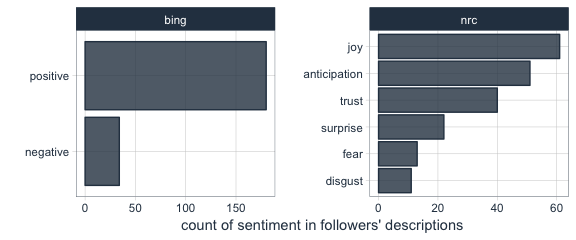
What’s the predominant sentiment in my followers’ descriptions?
For sentiment analysis, I will exclude the words with a negated meaning from nrc and switch their positive and negative meanings from bing (although in this case, there was only one negated word, “endorsement”, so it won’t make a real difference).
tidy_descr_sentiment <- tidy_descr %>%
  left_join(select(bigrams_separated, word1, word2), by = c("word" = "word2")) %>%
  inner_join(get_sentiments("nrc"), by = "word") %>%
  inner_join(get_sentiments("bing"), by = "word") %>%
  rename(nrc = sentiment.x, bing = sentiment.y) %>%
  mutate(nrc = ifelse(!is.na(word1), NA, nrc),
         bing = ifelse(!is.na(word1) & bing == "positive", "negative",
                       ifelse(!is.na(word1) & bing == "negative", "positive", bing)))
tidy_descr_sentiment %>%
  filter(nrc != "positive") %>%
  filter(nrc != "negative") %>%
  gather(x, y, nrc, bing) %>%
  count(x, y, sort = TRUE) %>%
  filter(n > 10) %>%
  ggplot(aes(x = reorder(y, n), y = n)) +
    facet_wrap(~ x, scales = "free") +
    geom_col(color = palette_light()[1], fill = palette_light()[1], alpha = 0.8) +
    coord_flip() +
    theme_tq() +
    labs(x = "",
         y = "count of sentiment in followers' descriptions")
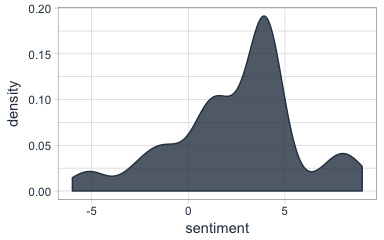
Are followers’ descriptions mostly positive or negative?
The majority of my followers have predominantly positive descriptions.
tidy_descr_sentiment %>%
  count(screenName, word, bing) %>%
  group_by(screenName, bing) %>%
  summarise(sum = sum(n)) %>%
  spread(bing, sum, fill = 0) %>%
  mutate(sentiment = positive - negative) %>%
  ggplot(aes(x = sentiment)) +
    geom_density(color = palette_light()[1], fill = palette_light()[1], alpha = 0.8) +
    theme_tq()
What are the most common positive and negative words in followers’ descriptions?
library(reshape2)
tidy_descr_sentiment %>%
  count(word, bing, sort = TRUE) %>%
  acast(word ~ bing, value.var = "n", fill = 0) %>%
  comparison.cloud(colors = palette_light()[1:2],
                   max.words = 100)

Topic modeling: are there groups of followers with specific interests?
Topic modeling can be used to categorize words into groups. Here, we can use it to see whether (some) of my followers can be grouped into subgroups according to their descriptions.
dtm_words_count <- tidy_descr %>%
  mutate(word_stem = removeNumbers(word_stem)) %>%
  count(screenName, word_stem, sort = TRUE) %>%
  ungroup() %>%
  filter(word_stem != "") %>%
  cast_dtm(screenName, word_stem, n)

# set a seed so that the output of the model is predictable
dtm_lda <- LDA(dtm_words_count, k = 5, control = list(seed = 1234))

topics_beta <- tidy(dtm_lda, matrix = "beta")
p1 <- topics_beta %>%
  filter(grepl("[a-z]+", term)) %>% # some words are Chinese, etc. I don't want these because ggplot doesn't plot them correctly
  group_by(topic) %>%
  top_n(10, beta) %>%
  ungroup() %>%
  arrange(topic, -beta) %>%
  mutate(term = reorder(term, beta)) %>%
  ggplot(aes(term, beta, color = factor(topic), fill = factor(topic))) +
    geom_col(show.legend = FALSE, alpha = 0.8) +
    scale_color_manual(values = palette_light()) +
    scale_fill_manual(values = palette_light()) +
    facet_wrap(~ topic, ncol = 5) +
    coord_flip() +
    theme_tq() +
    labs(x = "",
         y = "beta (~ occurrence in topics 1-5)",
         title = "The top 10 most characteristic words describe topic categories.")
user_topic <- tidy(dtm_lda, matrix = "gamma") %>%
  arrange(desc(gamma)) %>%
  group_by(document) %>%
  top_n(1, gamma)
p2 <- user_topic %>%
  group_by(topic) %>%
  top_n(10, gamma) %>%
  ggplot(aes(x = reorder(document, -gamma), y = gamma, color = factor(topic))) +
    facet_wrap(~ topic, scales = "free", ncol = 5) +
    geom_point(show.legend = FALSE, size = 4, alpha = 0.8) +
    scale_color_manual(values = palette_light()) +
    scale_fill_manual(values = palette_light()) +
    theme_tq() +
    coord_flip() +
    labs(x = "",
         y = "gamma\n(~ affiliation with topics 1-5)")
library(grid)
library(gridExtra)
grid.arrange(p1, p2, ncol = 1, heights = c(0.7, 0.3))
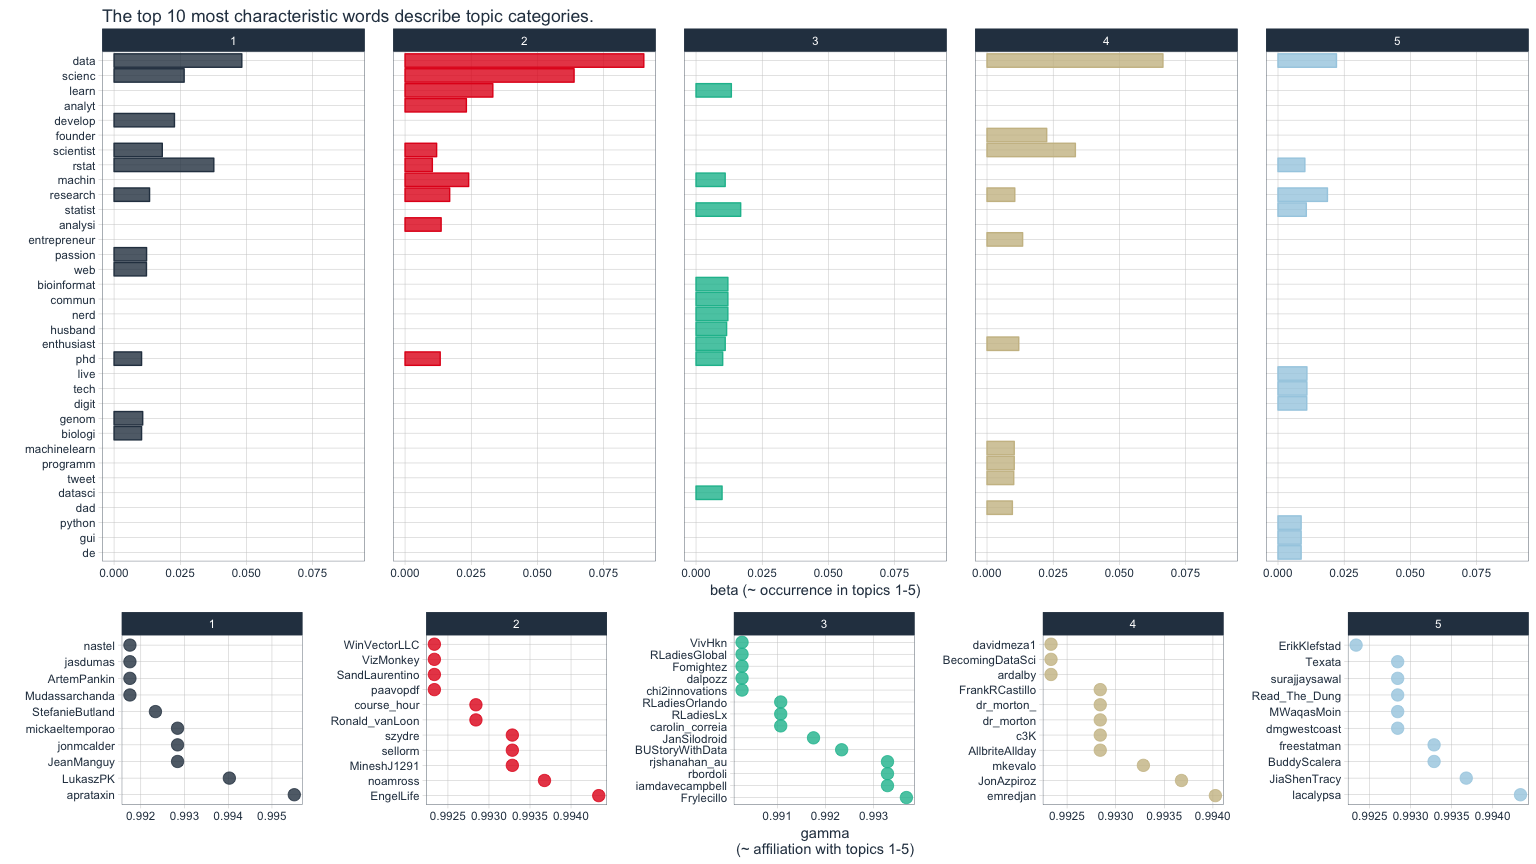
The upper of the two plots above show the words that were most strongly grouped to five topics. The lower plots show my followers with the strongest affiliation with these five topics.
Because in my tweets I only cover a relatively narrow range of topics (i.e. related to data), my followers are not very diverse in terms of their descriptions and the five topics are not very distinct.
If you find yourself in any of the topics, let me know if you agree with the topic that was modeled for you!
For more text analysis, see my post about text mining and sentiment analysis of a Stuff You Should Know Podcast.

![journal.pcbi.1003833.g006[2].png](https://paulvanderlaken.com/wp-content/uploads/2018/09/journal-pcbi-1003833-g0062.png?w=1108)
