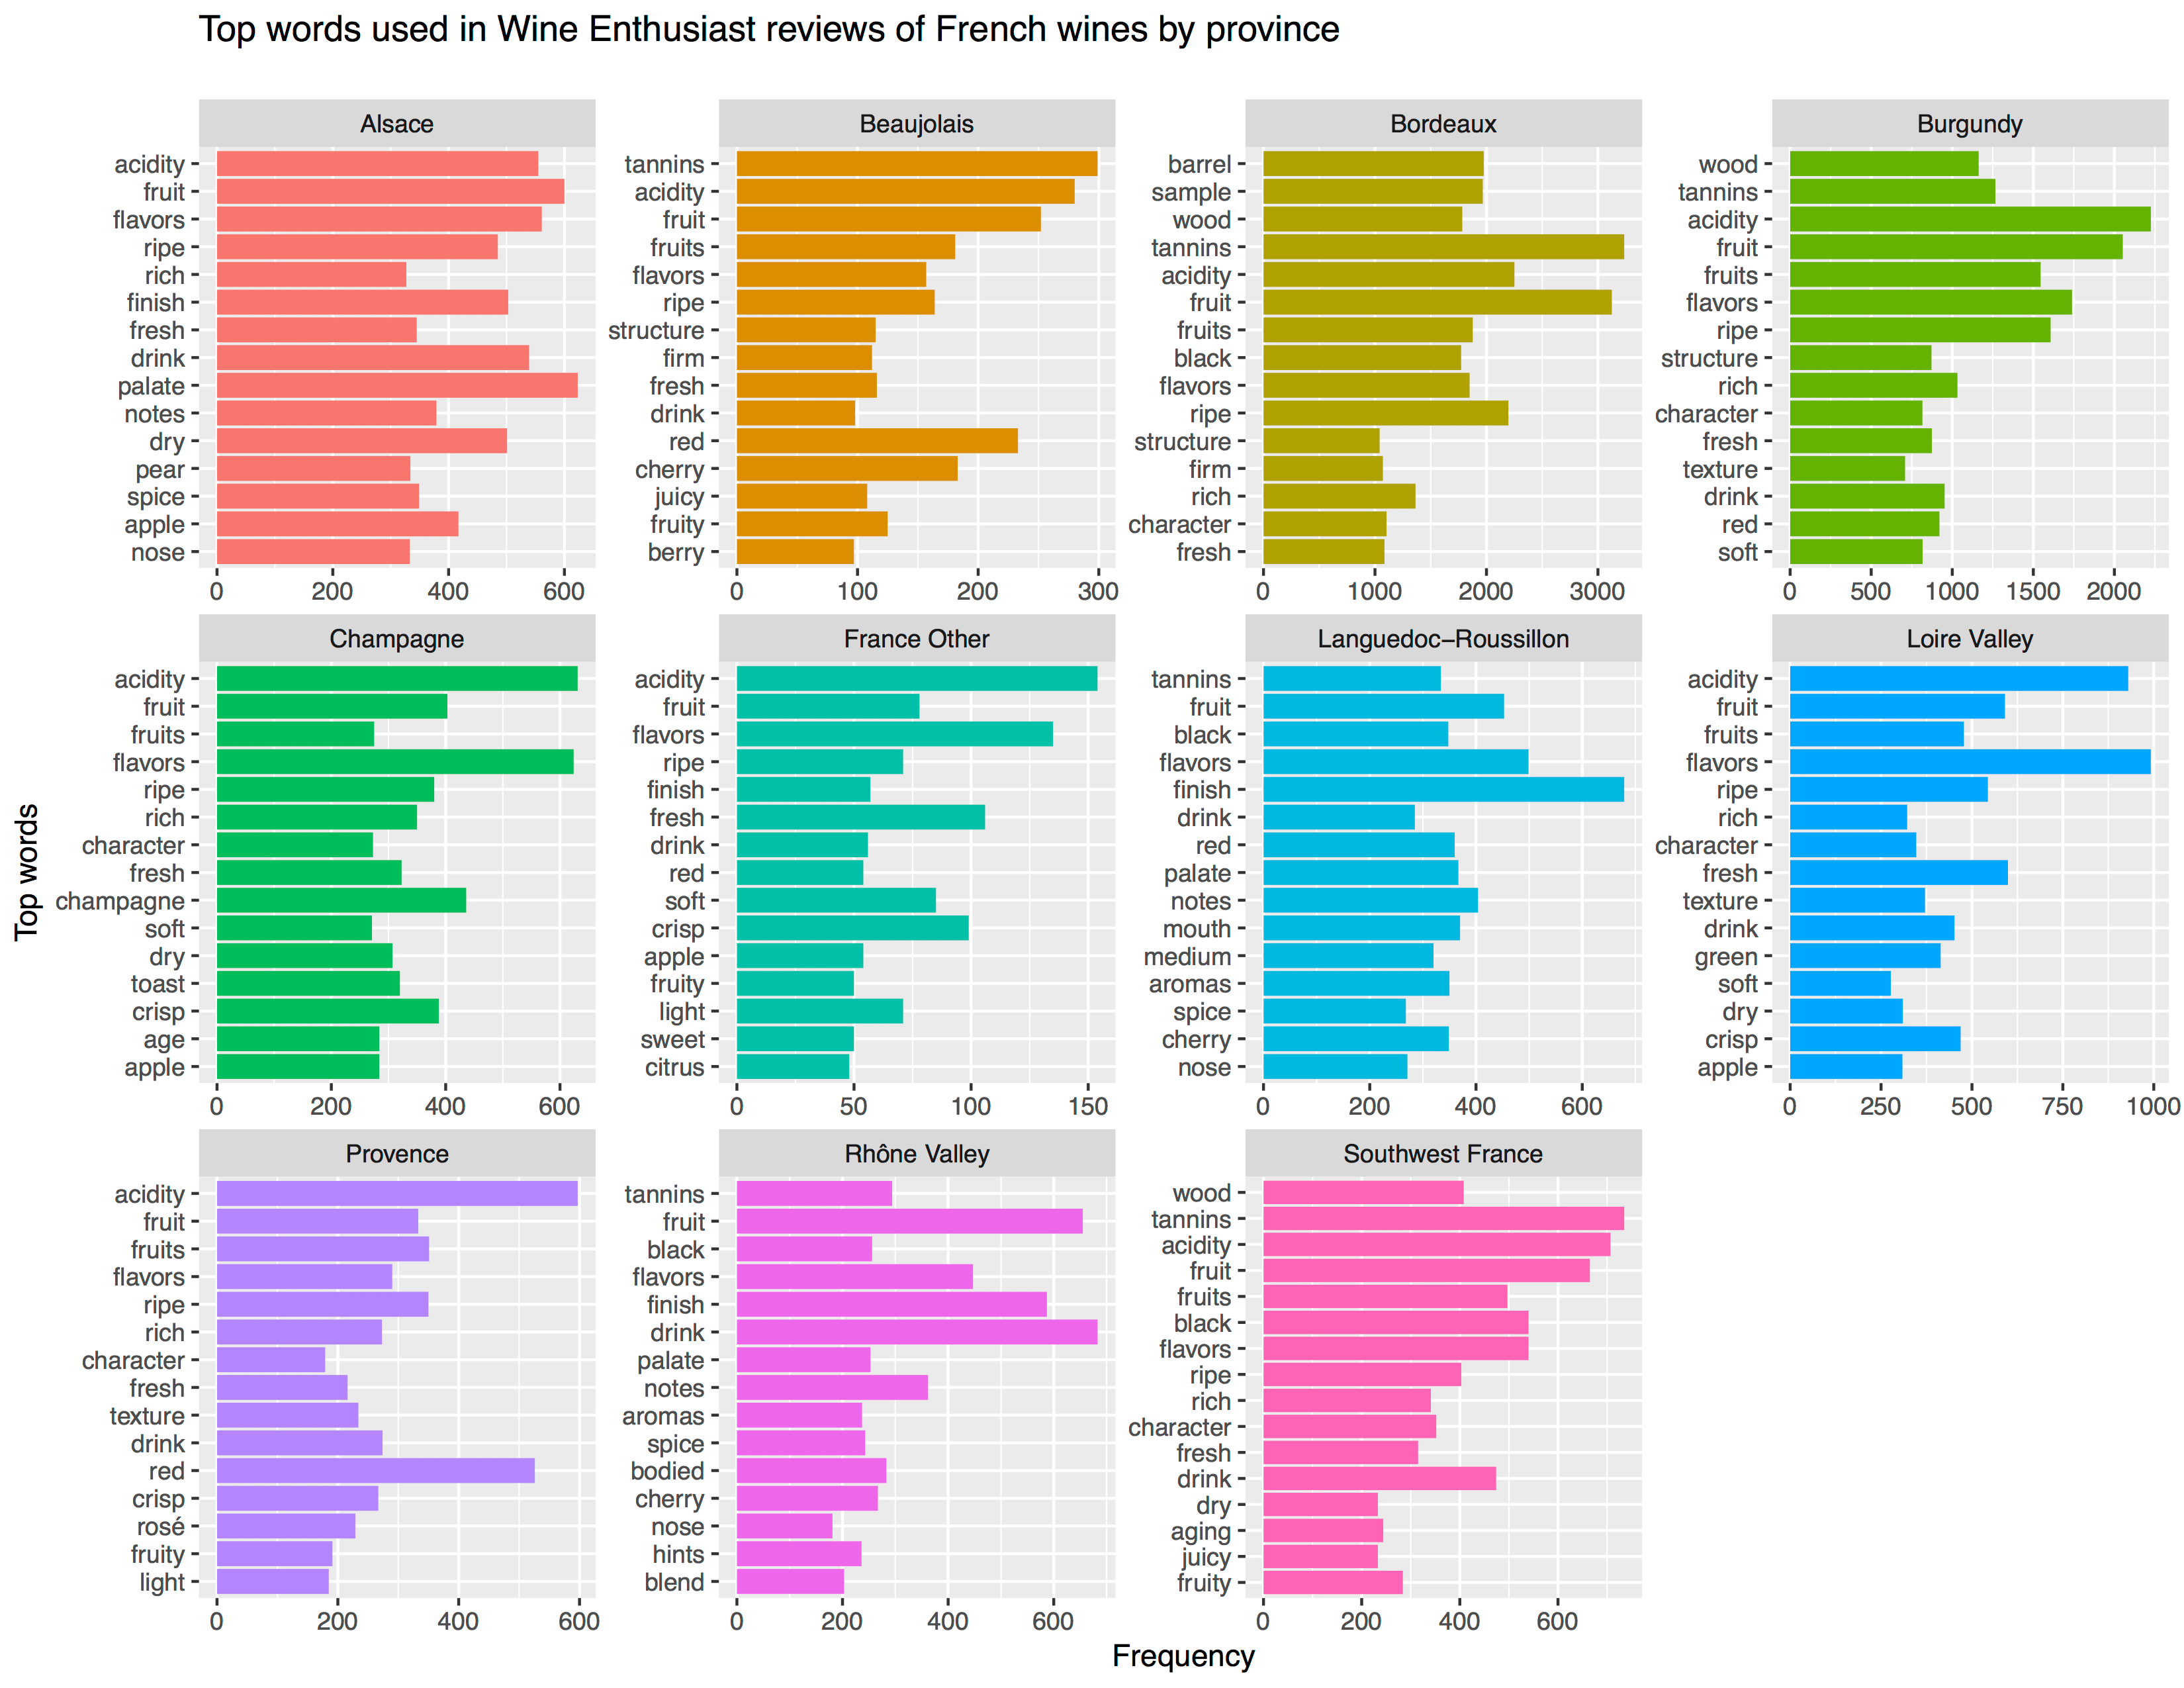
I’ve mentioned before that I dislike wordclouds (for instance here, or here) and apparently others share that sentiment. In his recent Medium blog, Daniel McNichol goes as far as to refer to the wordcloud as the pie chart of text data! Among others, Daniel calls wordclouds disorienting, one-dimensional, arbitrary and opaque and he mentions their lack of order, information, and scale.

Instead of using wordclouds, Daniel suggests we revert to alternative approaches. For instance, in their Tidy Text Mining with R book, Julia Silge and David Robinson suggest using bar charts or network graphs, providing the necessary R code. Another alternative is provided in Daniel’s blog: the chatterplot!
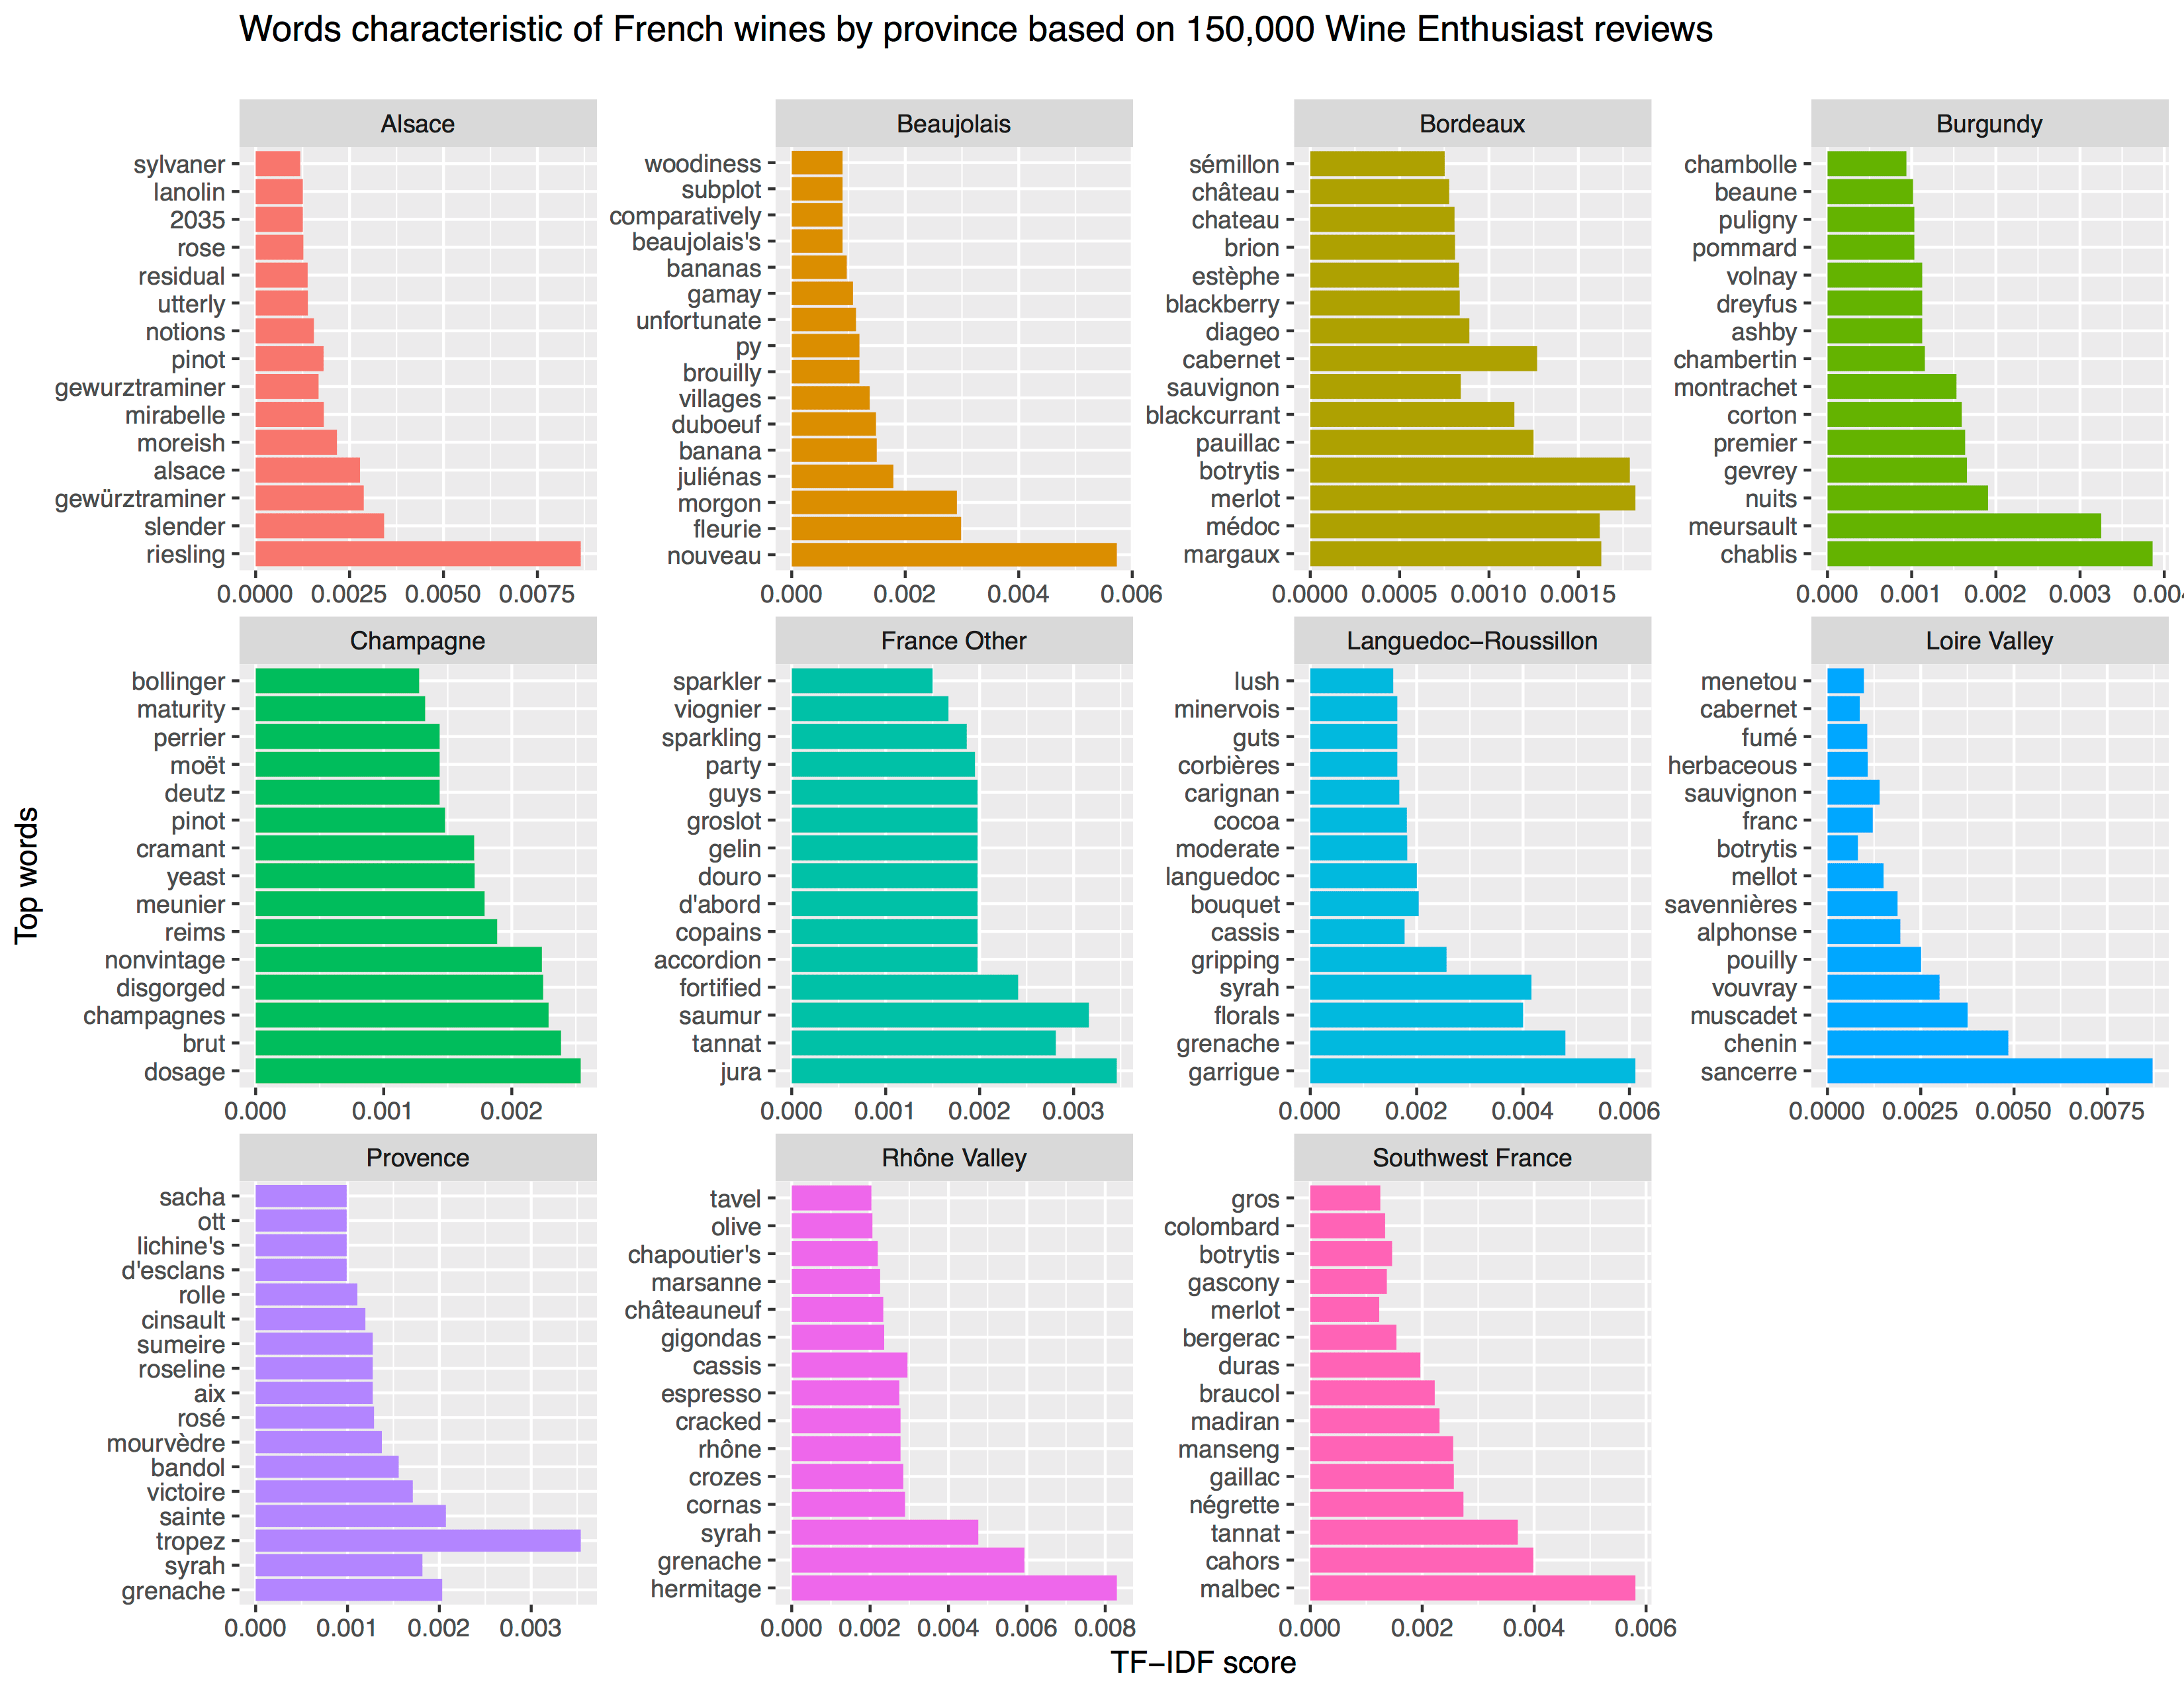
While Daniel didn’t invent this unorthodox wordcloud-like plot, he might have been the first to name it a chatterplot. Daniel’s chatterplot uses a full x/y cartesian plane, turning the usually only arbitrary though exploratory wordcloud into a more quantitatively sound, information-rich visualization.
R package ggplot’s geom_text() function — or alternatively ggrepel‘s geom_text_repel() for better legibility — is perfectly suited for making a chatterplot. And interesting features/variables for the axis — apart from the regular word frequencies — can be easily computed using the R tidytext package.
Here’s an example generated by Daniel, plotting words simulatenously by their frequency of occurance in comments to Hacker News articles (y-axis) as well as by the respective popularity of the comments the word was used in (log of the ranking, on the x-axis).

[CHATTERPLOTs are] like a wordcloud, except there’s actual quantitative logic to the order, placement & aesthetic aspects of the elements, along with an explicit scale reference for each. This allows us to represent more, multidimensional information in the plot, & provides the viewer with a coherent visual logic& direction by which to explore the data.
Daniel McNichol via Medium
I highly recommend the use of these chatterplots over their less-informative wordcloud counterpart, and strongly suggest you read Daniel’s original blog, in which you can also find the R code for the above visualizations.