While looking for laptops, it struck me that they can be so expensive for the hardware you get. I actually don’t need to my computer to be mobile, as most of the time it just sits in my study.
Hence, I opted for buying a desktop. And even better, I decided to build one myself!
I thought building a PC was going to be all complex and technical, but it’s actually really easy! I hope I can inspire you to try out for yourself as well.
Basically, you need only need 6 parts to build a computer:
Casing
Power supply
Motherboard
Processor (CPU)
Hard drive (SSD)
Memory (RAM)
Optional: Graphics card (GPU)
Optional: (extra) Fans
Via Pinterest (look at that old school case & speakers)
So I did some research into what hardware to buy. Specifically, I wanted a PC that could handle some deep learning and some of the newer video games. Hence, I decided on this setup:
Note: these are affiliate links. If you buy a similar setup, it will generate a few bucks used to keep my website live!
My new setup put together
My setup totalled to about €1100 or $1200, but it may depend on the vendors you pick. Nonetheless, the CPU and the GPU are definitely the most expensive (and important).
I did not buy any additional fans, as the Be Quiet base already had some pre-installed. However, I think it might be better to install extra’s.
Actually, it’s very easy to upgrade (or downgrade) your system. You can easily switch out modules to decrease or increase the performance (and cost). For instance, you can install another two memory cards on your motherboard, or simply spend more on a GPU.
After everything was delivered to my house, I thought the hard part started: building the desktop and putting everything together. But actually, this only took me about an hour or two, with the help of some great tutorials on Youtube:
I hope this convinces and helps you to build your own system at home!
David Robinson (aka drob) is one of the best known R programmers.
Since a couple of years David has been sharing his knowledge through streaming screencasts of him programming. It’s basically part of R’s #tidytuesday movement.
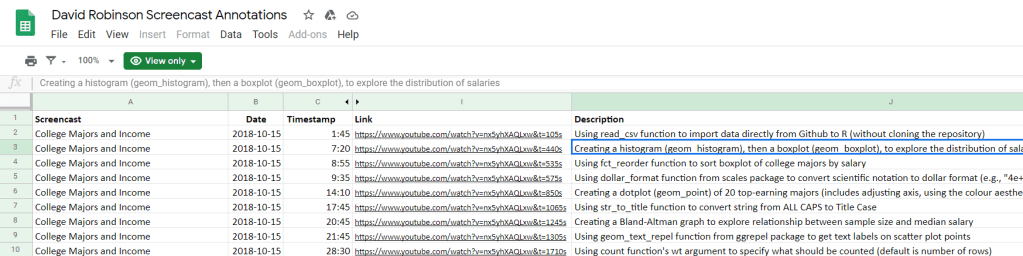
Alex Cookson decided to do us all a favor and annotate all these screencasts into a nice overview.
Here you can search for video material of David using a specific function or method. There are already over a thousand linked fragments!
Very useful if you want to learn how to visualize data using ggplot2 or plotly, how to work with factors in forcats, or how to tidy data using tidyr and dplyr.
For instance, you could search for specific R functions and packages you want to learn about:
Thanks David for sharing your knowledge, and thanks Alex for maintaining this overview!
Cohen’s d (wiki) is a statistic used to indicate the standardised difference between two means. Resarchers often use it to compare the averages between groups, for instance to determine that there are higher outcomes values in a experimental group than in a control group.
Researchers often use general guidelines to determine the size of an effect. Looking at Cohen’s d, psychologists often consider effects to be small when Cohen’s d is between 0.2 or 0.3, medium effects (whatever that may mean) are assumed for values around 0.5, and values of Cohen’s d larger than 0.8 would depict large effects (e.g., University of Bath).
The two groups’ distributions belonging to small, medium, and large effects visualized
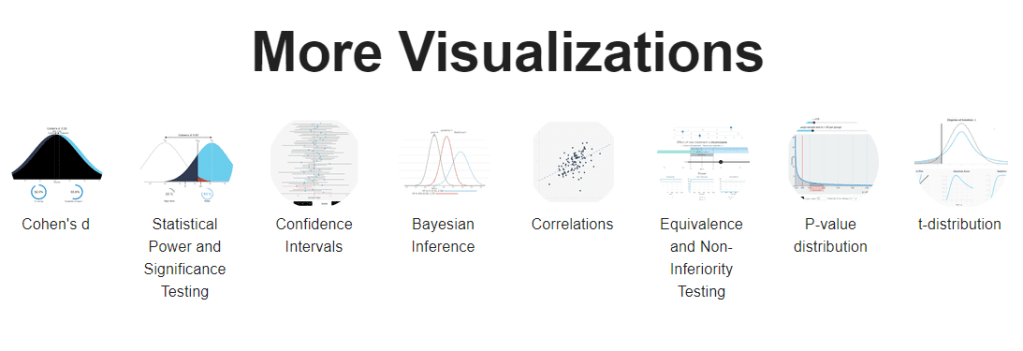
By the way, Kristoffer hosts many other interesting visualization tools (most made with JavaScript’s D3 library) on statistics and statistical phenomena on his website, have a look!
By adjusting the three elements in this simple framework, you can build any type of machine learning program.
In the tutorial, Eric shows you how to implement this same framework in Python (using jax) and implement linear regression, logistic regression, and artificial neural networks all in the same way (using gradient descent).
I can’t even begin to explain it as well as Eric does himself, so I highly recommend you watch and code along with the Youtube tutorial (~1 hour):
Have you ever wondered what goes on behind the scenes of a deep learning framework? Or what is going on behind that pre-trained model that you took from Kaggle? Then this tutorial is for you! In this tutorial, we will demystify the internals of deep learning frameworks – in the process equipping us with foundational knowledge that lets us understand what is going on when we train and fit a deep learning model. By learning the foundations without a deep learning framework as a pedagogical crutch, you will walk away with foundational knowledge that will give you the confidence to implement any model you want in any framework you choose.
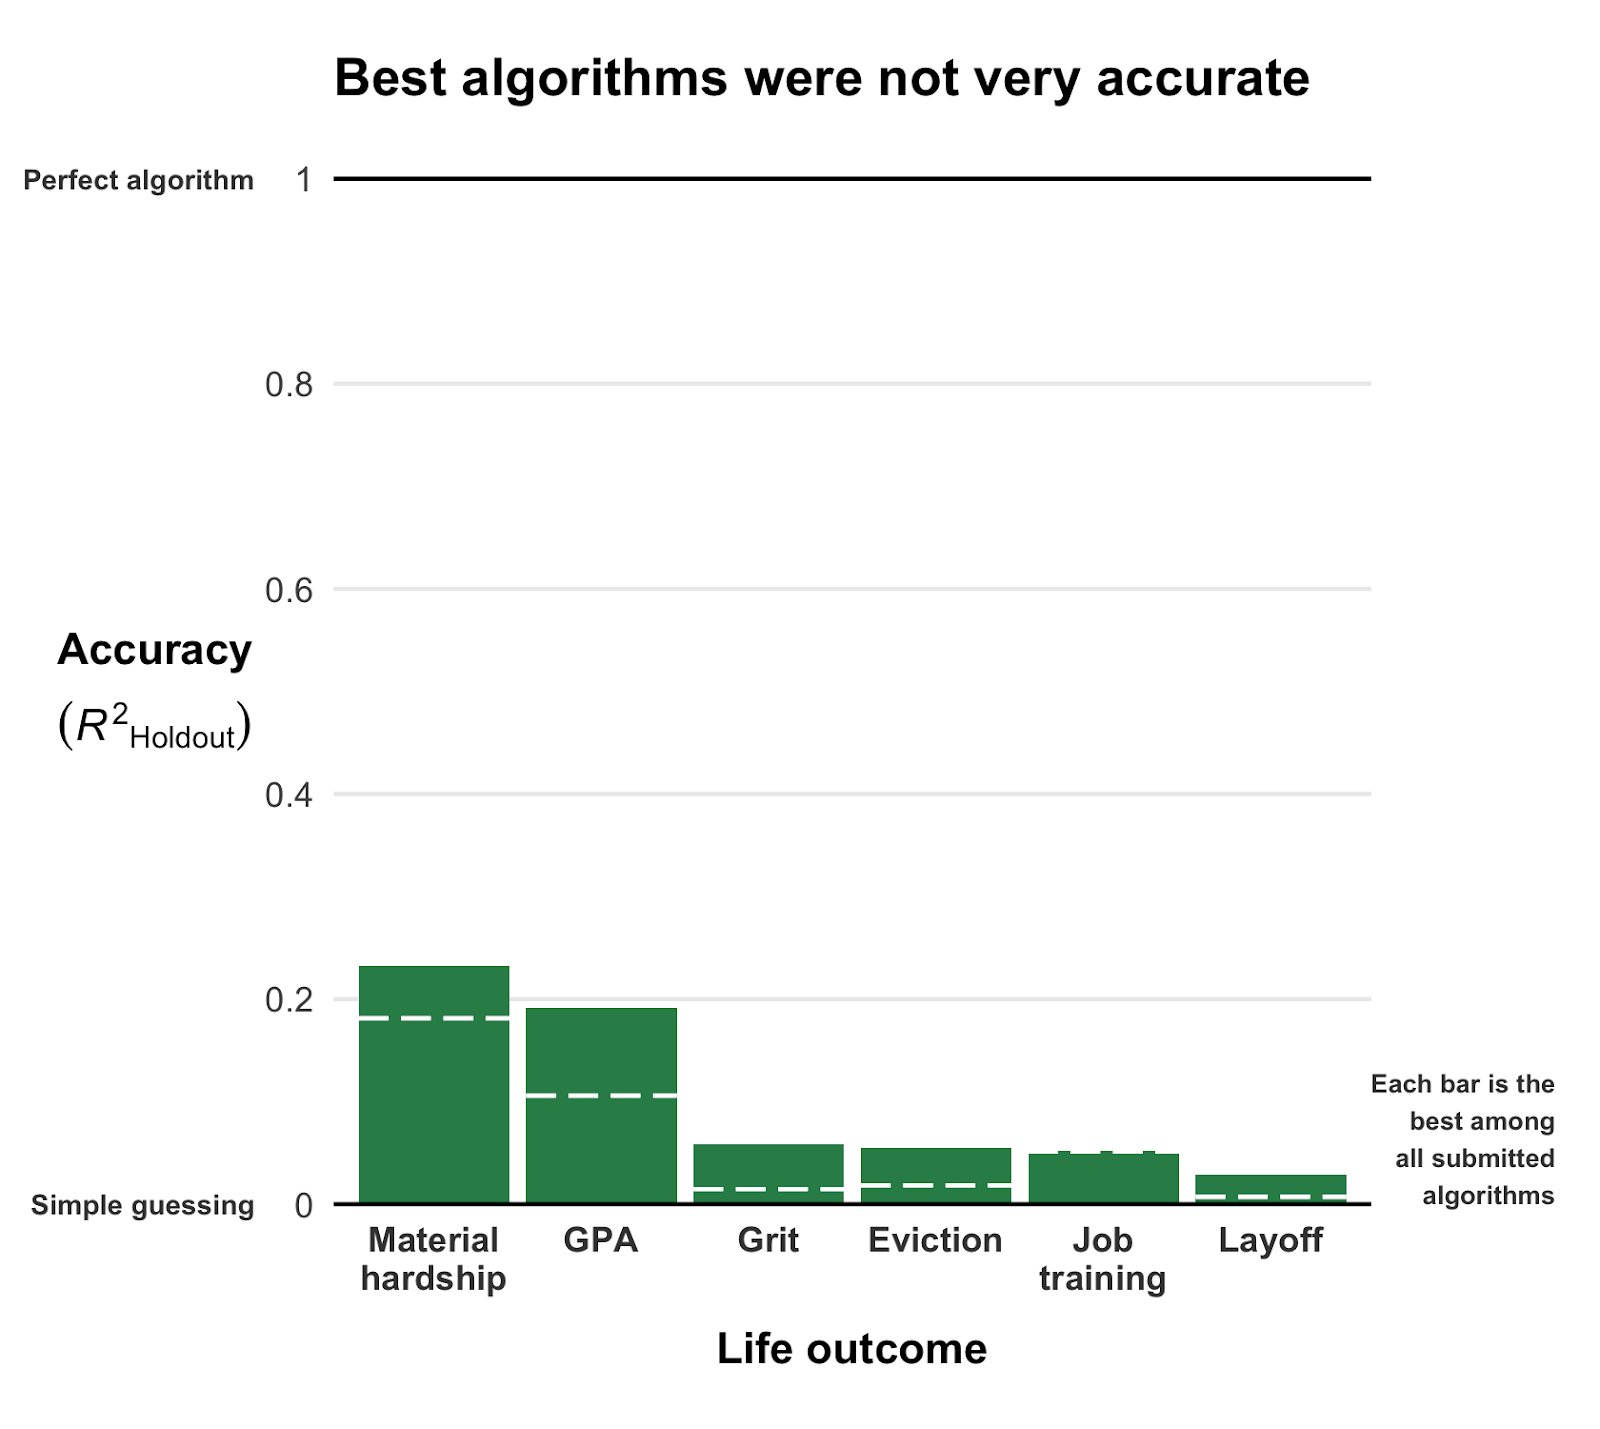
This blog highlights a recent PNAS paper in which 457 data scientists and academic scholars were challenged use machine learning to predict life outcomes using a rich dataset.
Yet, I can not summarize the result better than this tweet by the author of the paper:
If hundreds of scientists created predictive algorithms with high-quality data, how well would the best predict life outcomes? Not very well. Fragile Families Challenge: paper in PNAS w 112 authors https://t.co/WxDJbw0joz & Special Collection of Socius https://t.co/WM9f4oYaABpic.twitter.com/ZPFChD79VR
Over 750 scientific papers have used the Fragile Families dataset.
The dataset is famous for its richness of cohort (survey) data on the included families’ lives and their childrens’ upbringings. It includes a whopping 12.942 variables!!
Some of these variables reflect interesting life outcomes of the included families.
For instance, the childrens’ grade point averages (GPA) and grit, but also whether the family was ever evicted or experienced hardship, or whether their primary caregiver had received job training or was laid off at work.
You can read more about the exact data contents in the paper’s appendix.
Now Matthew and his co-authors shared this enormous dataset with over 160 teams consisting of 457 academics researchers and data scientists alike. Each of them well versed in statistics and predictive modelling.
These data scientists were challenged with this task: by all means possible, make the most predictive model for the six life outcomes (i.e., GPA, conviction, etc).
The scientists could use all the Fragile Families data, and any algorithm they liked, and their final model and its predictions would be compared against the actual life outcomes in a holdout sample.
According to the paper, many of these teams used machine-learning methods that are not typically used in social science research and that explicitly seek to maximize predictive accuracy.
Now, here’s the summary again:
If hundreds of [data] scientists created predictive algorithms with high-quality data, how well would the best predict life outcomes?
Not very well.
@msalganik
Even the best among the 160 teams’ predictions showed disappointing resemblance of the actual life outcomes. None of the trained models/algorithms achieved an R-squared of over 0.25.
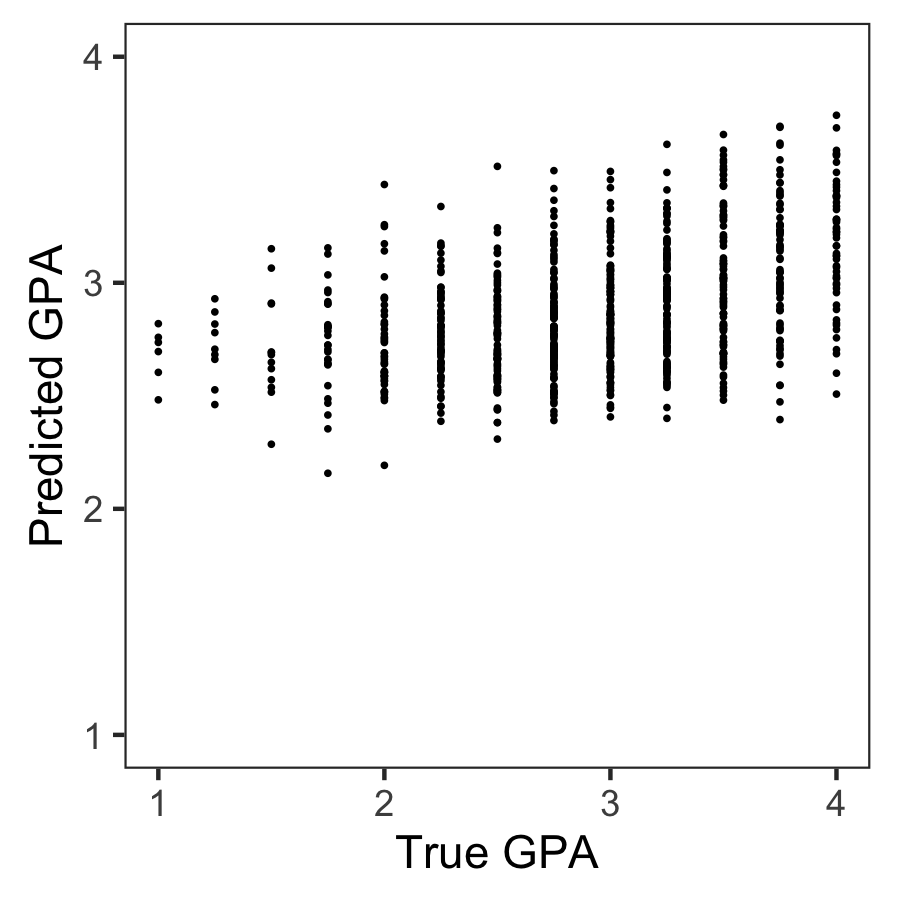
Wondering what these best R-squared of around 0.20 look like? Here’s the disappointg reality of plot C enlarged: the actual TRUE GPA’s on the x-axis, plotted against the best team’s predicted GPA’s on the y-axis.
Sure, there’s some relationship, with higher actual scores getting higher (average) predictions. But it ain’t much.
Moreover, there’s very little variation in the predictions. They all clump together between the range of about 2.1 and 3.8… that’s not really setting apart the geniuses from the less bright!
Matthew sums up the implications quite nicely in one of his tweets:
For policymakers deploying predictive algorithms in high-stakes decisions, our result is a reminder of a basic fact: one should not assume that algorithms predict well. That must be demonstrated with transparent, empirical evidence.
According to Matthew this “collective failure of 160 teams” is hard to ignore. And it failure highlights the understanding vs. predicting paradox: these data have been used to generate knowledge on how the world works in over 750 papers, yet few checked to see whether these same data and the scientific models would be useful to predict the life outcomes we’re trying to understand.
I was super excited to read this paper and I love the approach. It is actually quite closely linked to a series of papers I have been working on with Brian Spisak and Brian Doornenbal on trying to predict which people will emerge as organizational leaders. (hint: we could not really, at least not based on their personality)
Apparently, others were as excited as I am about this paper, as Filiz Garip already published a commentary paper on this research piece. Unfortunately, it’s behind a paywall so I haven’t read it yet.
Moreover, if you want to learn more about the approaches the 160 data science teams took in modelling these life outcomes, here are twelve papers in which some teams share their attempts.
Very curious to hear what you think of the paper and its implications. You can access it here, and I’d love to read your comments below.


