David Robinson (aka drob) is one of the best known R programmers.
Since a couple of years David has been sharing his knowledge through streaming screencasts of him programming. It’s basically part of R’s #tidytuesday movement.
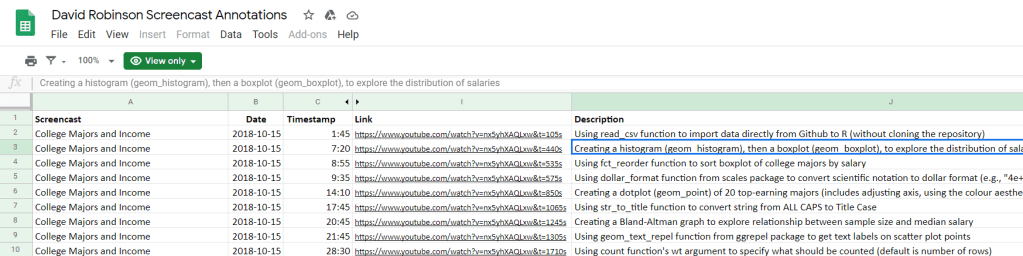
Alex Cookson decided to do us all a favor and annotate all these screencasts into a nice overview.
Here you can search for video material of David using a specific function or method. There are already over a thousand linked fragments!
Very useful if you want to learn how to visualize data using ggplot2 or plotly, how to work with factors in forcats, or how to tidy data using tidyr and dplyr.
For instance, you could search for specific R functions and packages you want to learn about:
Thanks David for sharing your knowledge, and thanks Alex for maintaining this overview!
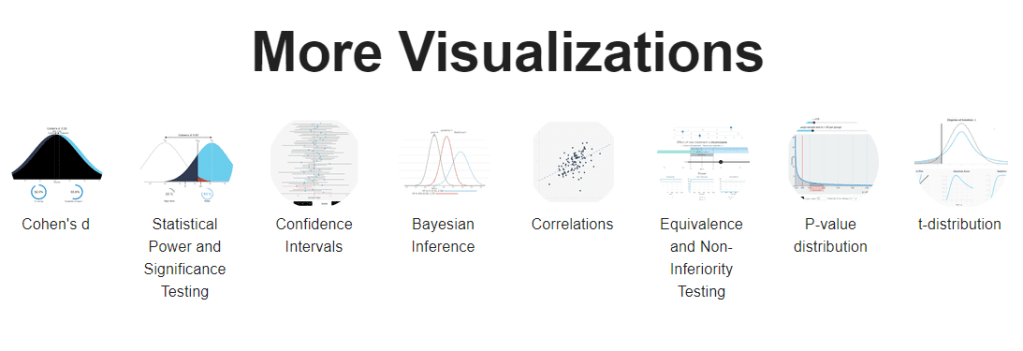
Cohen’s d (wiki) is a statistic used to indicate the standardised difference between two means. Resarchers often use it to compare the averages between groups, for instance to determine that there are higher outcomes values in a experimental group than in a control group.
Researchers often use general guidelines to determine the size of an effect. Looking at Cohen’s d, psychologists often consider effects to be small when Cohen’s d is between 0.2 or 0.3, medium effects (whatever that may mean) are assumed for values around 0.5, and values of Cohen’s d larger than 0.8 would depict large effects (e.g., University of Bath).
The two groups’ distributions belonging to small, medium, and large effects visualized
By the way, Kristoffer hosts many other interesting visualization tools (most made with JavaScript’s D3 library) on statistics and statistical phenomena on his website, have a look!
By adjusting the three elements in this simple framework, you can build any type of machine learning program.
In the tutorial, Eric shows you how to implement this same framework in Python (using jax) and implement linear regression, logistic regression, and artificial neural networks all in the same way (using gradient descent).
I can’t even begin to explain it as well as Eric does himself, so I highly recommend you watch and code along with the Youtube tutorial (~1 hour):
Have you ever wondered what goes on behind the scenes of a deep learning framework? Or what is going on behind that pre-trained model that you took from Kaggle? Then this tutorial is for you! In this tutorial, we will demystify the internals of deep learning frameworks – in the process equipping us with foundational knowledge that lets us understand what is going on when we train and fit a deep learning model. By learning the foundations without a deep learning framework as a pedagogical crutch, you will walk away with foundational knowledge that will give you the confidence to implement any model you want in any framework you choose.
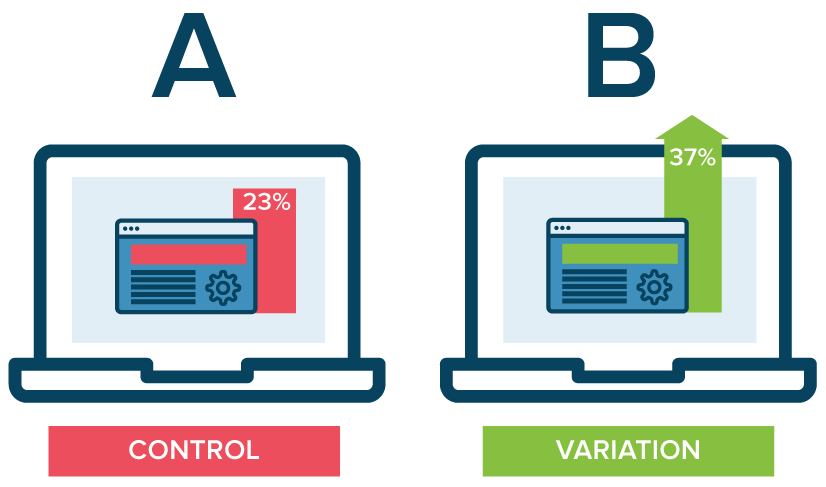
A/B testing is a method of comparing two versions of some thing against each other to determine which is better. A/B tests are often mentioned in e-commerce contexts, where the things we are comparing are web pages.
Business leaders and data scientists alike face a difficult trade-off when running A/B tests: How big should the A/B test be? Or in other words, After collecting how many data points, or running for how many days, should we make a decision whether A or B is the best way to go?
This is a tradeoff because the sample size of an A/B test determines its statistical power. This statistical power, in simple terms, determines the probability of a A/B test showing an effect if there is actually really an effect. In general, the more data you collect, the higher the odds of you finding the real effect and making the right decision.
By default, researchers often aim for 80% power, with a 5% significance cutoff. But is this general guideline really optimal for the tradeoff between costs and benefits in your specific business context? Chris thinks not.
Chris said wrote a great three-piece blog in which he explains how you can mathematically determine the optimal duration of A/B-testing in your own company setting:
Part I: General Overview. Starts with a mostly non-technical overview and ends with a section called “Three lessons for practitioners”.
Part II: Expected lift. A more technical section that quantifies the benefits of experimentation as a function of sample size.
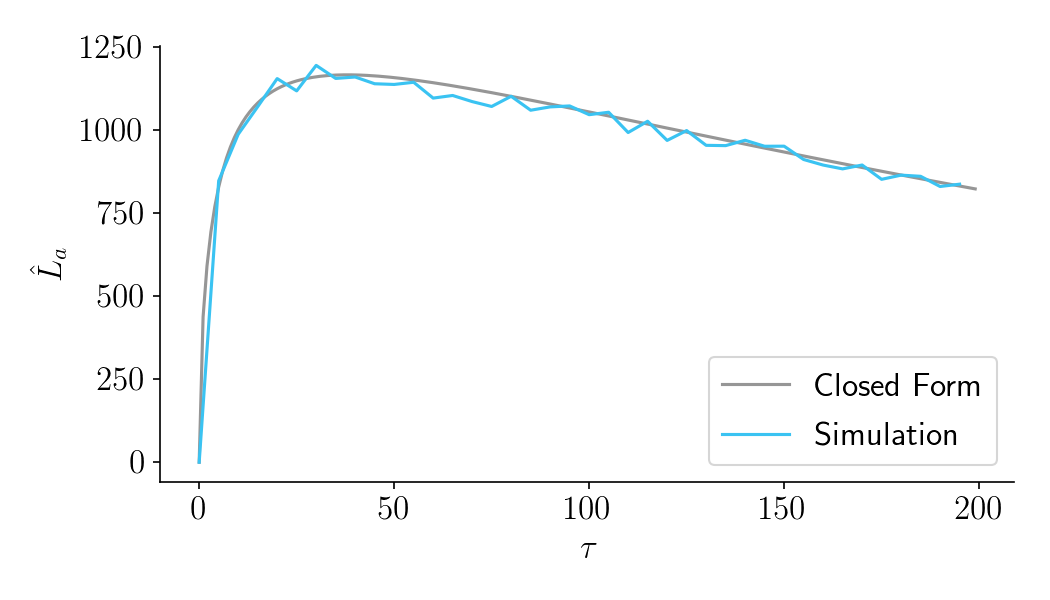
Part III: Aggregate time-discounted lift. A more technical section that quantifies the costs of experimentation as a function of sample size. It then combines costs and benefits into a closed-form expression that can be optimized. Ends with an FAQ.
Several Chinese Ph.D. students wrote a PyTorch program that can turn your holiday pictures into 3D sceneries. They call it 3D photo inpainting. Here are some examples
And here’s the new method compares to previous techniques:
We propose a method for converting a single RGB-D input image into a 3D photo, i.e., a multi-layer representation for novel view synthesis that contains hallucinated color and depth structures in regions occluded in the original view. We use a Layered Depth Image with explicit pixel connectivity as underlying representation, and present a learning-based inpainting model that iteratively synthesizes new local color-and-depth content into the occluded region in a spatial context-aware manner. The resulting 3D photos can be efficiently rendered with motion parallax using standard graphics engines. We validate the effectiveness of our method on a wide range of challenging everyday scenes and show fewer artifacts when compared with the state-of-the-arts.
These days, I am often programming in multiple different languages for my projects. I will do some data generation and machine learning in Python. The data exploration and some quick visualizations I prefer to do in R. And if I’m feeling adventureous, I might add some Processing or JavaScript visualizations.
Obviously, I want to track and store the versions of my programs and the changes between them. I probably don’t have to tell you that git is the tool to do so.
Normally, you’d have a .gitignore file in your project folder, and all files that are not listed (or have patterns listed) in the .gitignore file are backed up online.
However, when you are working in multiple languages simulatenously, it can become a hassle to assure that only the relevant files for each language are committed to Github.
Each language will have their own “by-files”. R projects come with .Rdata, .Rproj, .Rhistory and so on, whereas Python projects generate pycaches and what not. These you don’t want to commit preferably.
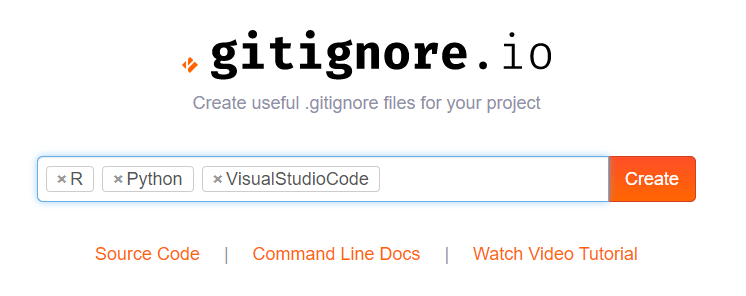
Here you simply enter the operating systems, IDEs, or Programming languages you are working with, and it will generate the appropriate .gitignore contents for you.
Let’s try it out
For my current project, I am working with Python and R in Visual Studio Code. So I enter:
And Voila, I get the perfect .gitignore including all specifics for these programs and languages:
# Created by https://www.gitignore.io/api/r,python,visualstudiocode
# Edit at https://www.gitignore.io/?templates=r,python,visualstudiocode

### Python ###
# Byte-compiled / optimized / DLL files
__pycache__/
*.py[cod]
*$py.class

# C extensions
*.so

# Distribution / packaging
.Python
build/
develop-eggs/
dist/
downloads/
eggs/
.eggs/
lib/
lib64/
parts/
sdist/
var/
wheels/
pip-wheel-metadata/
share/python-wheels/
*.egg-info/
.installed.cfg
*.egg
MANIFEST

# PyInstaller
#  Usually these files are written by a python script from a template
#  before PyInstaller builds the exe, so as to inject date/other infos into it.
*.manifest
*.spec

# Installer logs
pip-log.txt
pip-delete-this-directory.txt

# Unit test / coverage reports
htmlcov/
.tox/
.nox/
.coverage
.coverage.*
.cache
nosetests.xml
coverage.xml
*.cover
.hypothesis/
.pytest_cache/

# Translations
*.mo
*.pot

# Scrapy stuff:
.scrapy

# Sphinx documentation
docs/_build/

# PyBuilder
target/

# pyenv
.python-version

# pipenv
#   According to pypa/pipenv#598, it is recommended to include Pipfile.lock in version control.
#   However, in case of collaboration, if having platform-specific dependencies or dependencies
#   having no cross-platform support, pipenv may install dependencies that don't work, or not
#   install all needed dependencies.
#Pipfile.lock

# celery beat schedule file
celerybeat-schedule

# SageMath parsed files
*.sage.py

# Spyder project settings
.spyderproject
.spyproject

# Rope project settings
.ropeproject

# Mr Developer
.mr.developer.cfg
.project
.pydevproject

# mkdocs documentation
/site

# mypy
.mypy_cache/
.dmypy.json
dmypy.json

# Pyre type checker
.pyre/

### R ###
# History files
.Rhistory
.Rapp.history

# Session Data files
.RData
.RDataTmp

# User-specific files
.Ruserdata

# Example code in package build process
*-Ex.R

# Output files from R CMD build
/*.tar.gz

# Output files from R CMD check
/*.Rcheck/

# RStudio files
.Rproj.user/

# produced vignettes
vignettes/*.html
vignettes/*.pdf

# OAuth2 token, see https://github.com/hadley/httr/releases/tag/v0.3
.httr-oauth

# knitr and R markdown default cache directories
*_cache/
/cache/

# Temporary files created by R markdown
*.utf8.md
*.knit.md

### R.Bookdown Stack ###
# R package: bookdown caching files
/*_files/

### VisualStudioCode ###
.vscode/*
!.vscode/settings.json
!.vscode/tasks.json
!.vscode/launch.json
!.vscode/extensions.json

### VisualStudioCode Patch ###
# Ignore all local history of files
.history

# End of https://www.gitignore.io/api/r,python,visualstudiocode


