These days, I am often programming in multiple different languages for my projects. I will do some data generation and machine learning in Python. The data exploration and some quick visualizations I prefer to do in R. And if I’m feeling adventureous, I might add some Processing or JavaScript visualizations.
Obviously, I want to track and store the versions of my programs and the changes between them. I probably don’t have to tell you that git is the tool to do so.
Normally, you’d have a .gitignore file in your project folder, and all files that are not listed (or have patterns listed) in the .gitignore file are backed up online.
However, when you are working in multiple languages simulatenously, it can become a hassle to assure that only the relevant files for each language are committed to Github.
Each language will have their own “by-files”. R projects come with .Rdata, .Rproj, .Rhistory and so on, whereas Python projects generate pycaches and what not. These you don’t want to commit preferably.
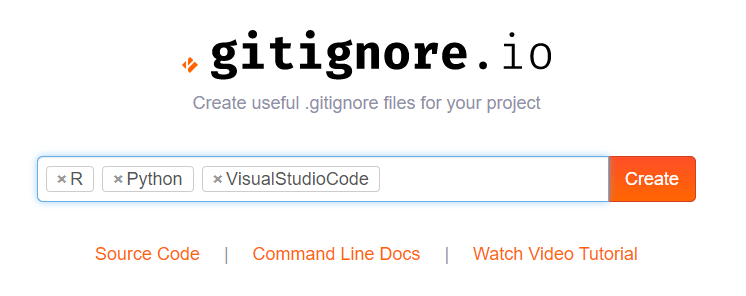
Here you simply enter the operating systems, IDEs, or Programming languages you are working with, and it will generate the appropriate .gitignore contents for you.
Let’s try it out
For my current project, I am working with Python and R in Visual Studio Code. So I enter:
And Voila, I get the perfect .gitignore including all specifics for these programs and languages:
# Created by https://www.gitignore.io/api/r,python,visualstudiocode
# Edit at https://www.gitignore.io/?templates=r,python,visualstudiocode

### Python ###
# Byte-compiled / optimized / DLL files
__pycache__/
*.py[cod]
*$py.class

# C extensions
*.so

# Distribution / packaging
.Python
build/
develop-eggs/
dist/
downloads/
eggs/
.eggs/
lib/
lib64/
parts/
sdist/
var/
wheels/
pip-wheel-metadata/
share/python-wheels/
*.egg-info/
.installed.cfg
*.egg
MANIFEST

# PyInstaller
#  Usually these files are written by a python script from a template
#  before PyInstaller builds the exe, so as to inject date/other infos into it.
*.manifest
*.spec

# Installer logs
pip-log.txt
pip-delete-this-directory.txt

# Unit test / coverage reports
htmlcov/
.tox/
.nox/
.coverage
.coverage.*
.cache
nosetests.xml
coverage.xml
*.cover
.hypothesis/
.pytest_cache/

# Translations
*.mo
*.pot

# Scrapy stuff:
.scrapy

# Sphinx documentation
docs/_build/

# PyBuilder
target/

# pyenv
.python-version

# pipenv
#   According to pypa/pipenv#598, it is recommended to include Pipfile.lock in version control.
#   However, in case of collaboration, if having platform-specific dependencies or dependencies
#   having no cross-platform support, pipenv may install dependencies that don't work, or not
#   install all needed dependencies.
#Pipfile.lock

# celery beat schedule file
celerybeat-schedule

# SageMath parsed files
*.sage.py

# Spyder project settings
.spyderproject
.spyproject

# Rope project settings
.ropeproject

# Mr Developer
.mr.developer.cfg
.project
.pydevproject

# mkdocs documentation
/site

# mypy
.mypy_cache/
.dmypy.json
dmypy.json

# Pyre type checker
.pyre/

### R ###
# History files
.Rhistory
.Rapp.history

# Session Data files
.RData
.RDataTmp

# User-specific files
.Ruserdata

# Example code in package build process
*-Ex.R

# Output files from R CMD build
/*.tar.gz

# Output files from R CMD check
/*.Rcheck/

# RStudio files
.Rproj.user/

# produced vignettes
vignettes/*.html
vignettes/*.pdf

# OAuth2 token, see https://github.com/hadley/httr/releases/tag/v0.3
.httr-oauth

# knitr and R markdown default cache directories
*_cache/
/cache/

# Temporary files created by R markdown
*.utf8.md
*.knit.md

### R.Bookdown Stack ###
# R package: bookdown caching files
/*_files/

### VisualStudioCode ###
.vscode/*
!.vscode/settings.json
!.vscode/tasks.json
!.vscode/launch.json
!.vscode/extensions.json

### VisualStudioCode Patch ###
# Ignore all local history of files
.history

# End of https://www.gitignore.io/api/r,python,visualstudiocode
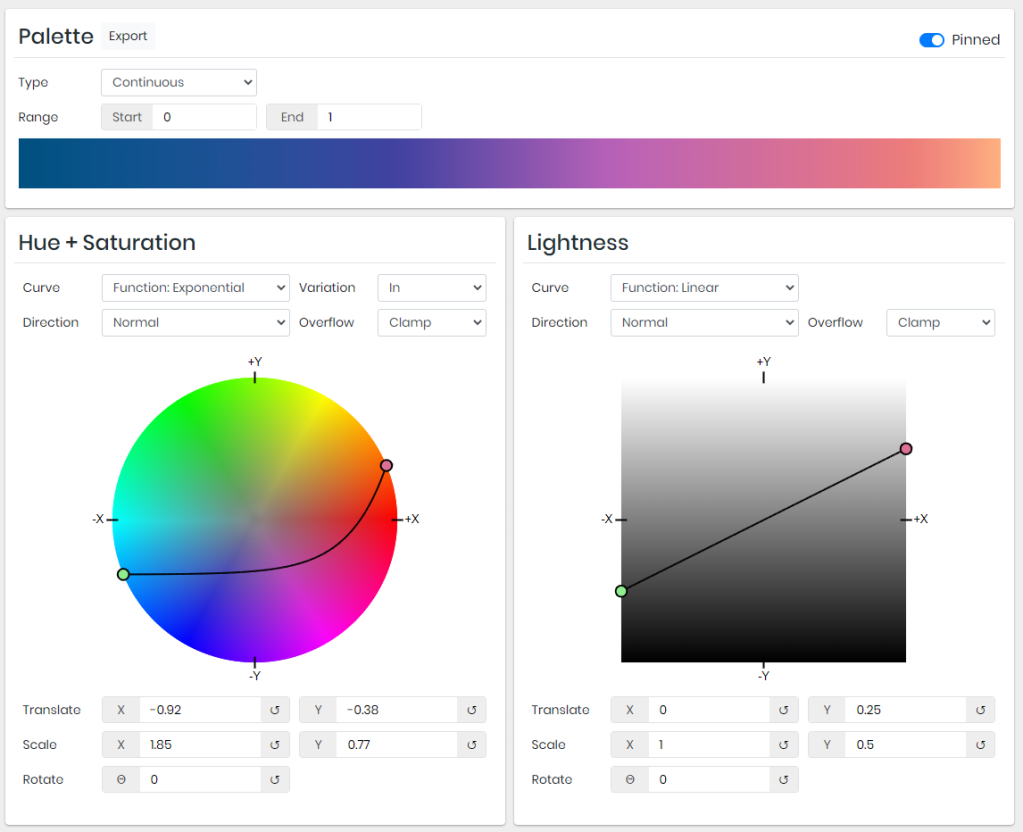
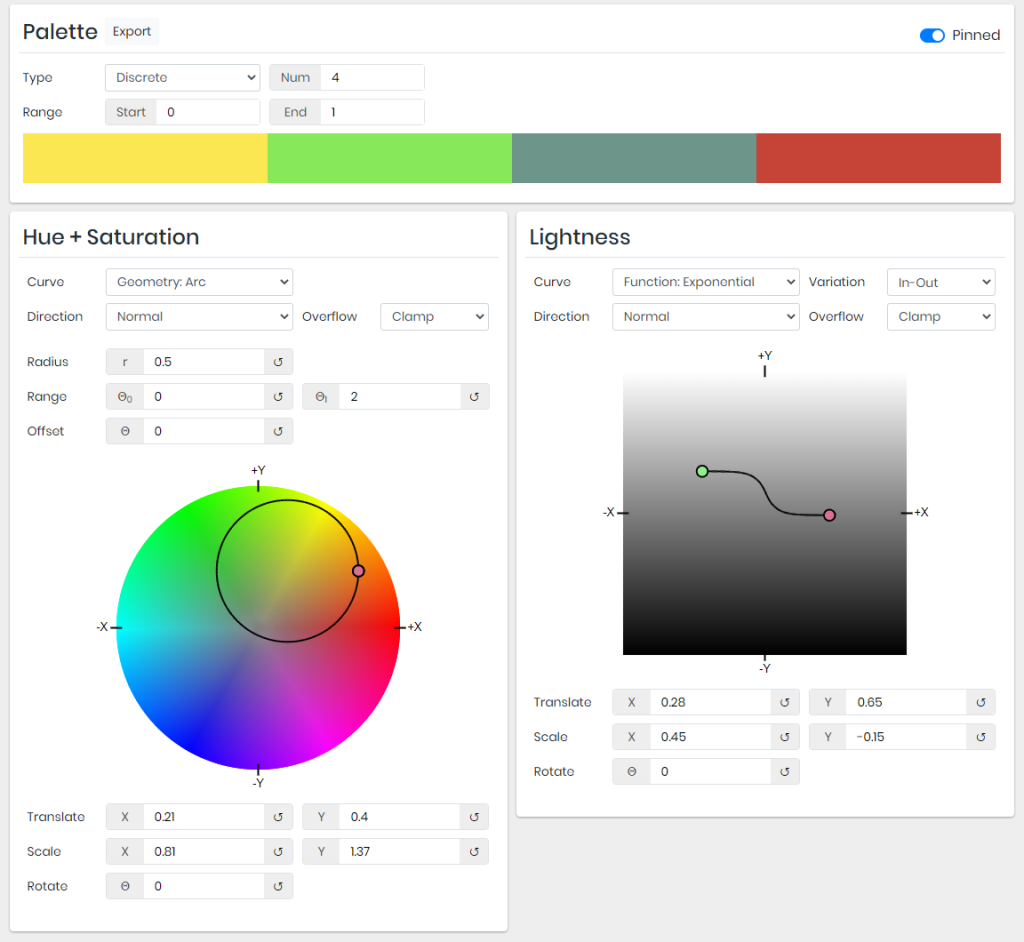
Leonardo is an open source tool for creating adaptive color palettes; a custom color generator for creating colors based on target contrast ratio. Leonardo is delivered as a Javascript module (@adobe/leonardo-contrast-colors) with a web interface to aid in creating your color palette configurations, which can easily be shared with both designers and engineers. Simply put, Leonardo is for dynamic accessibility of your products.
The tool is very easy to use. Even I could create a quick palette! Though it’s probably horrendous (due to my colorblindness : ))
🎨 Leonardo est une application web open source, créée par Adobe, qui permet de concevoir des nuanciers accessibles *et* adaptables à un contexte :https://t.co/QgP3UtrvBz
I came across this awesome regular expression tool I wanted to share. Debuggex allows you to interactively write, test and visually inspect what your regular expressions match in either Python, JavaScript, or Perl.
Read more about regular expressions here, for instance their implementation in R.
Last week, Google released Facets, their new, open source visualization tool. Facets consists of two interfaces that allow users to investigate their data at different levels.
Facets Overview provides users with a quick understanding of the distribution of values across the variables in their dataset. Overview is especially helpful in detecting unexpected values, missing values, unbalanced distributions, and skewed distributions. Overview will detect all kinds of statistics for every column (i.e., variable) in your dataset, along with some simple vizualizations, such as histograms.
Example of Facets Overview tool
Dive is the name of the second interface of Facets. It provides an intuitive dashboard in which users can explore relationships between data points across the different variables in their dataset. The dashboard is easy to customize and users can control the position, color, and visual representation of each data point based on the underlying values.
Example of Facets Dive tool
Moreover, if the data points have images associated with them, these images can be used as the visual representations of the data points. The latter is especially helpful when Facets is used for its actual purpose: aiding in machine learning processes. The below GIF demonstrates how Facets Dive spots incorrectly labelled images with ease, allowing users to zoom in on a case-by-case level, for instance, to identify a frog that has been erroneously labelled as a cat.
Exploration of the CIFAR-10 dataset using Facets Dive