Tag: online

Determine optimal sample sizes for business value in A/B testing, by Chris Said

Determine optimal sample sizes for business value in A/B testing, by Chris Said

A/B testing is a method of comparing two versions of some thing against each other to determine which is better. A/B tests are often mentioned in e-commerce contexts, where the things we are comparing are web pages.

ab-testing
via optimizely.com/nl/optimization-glossary/ab-testing/

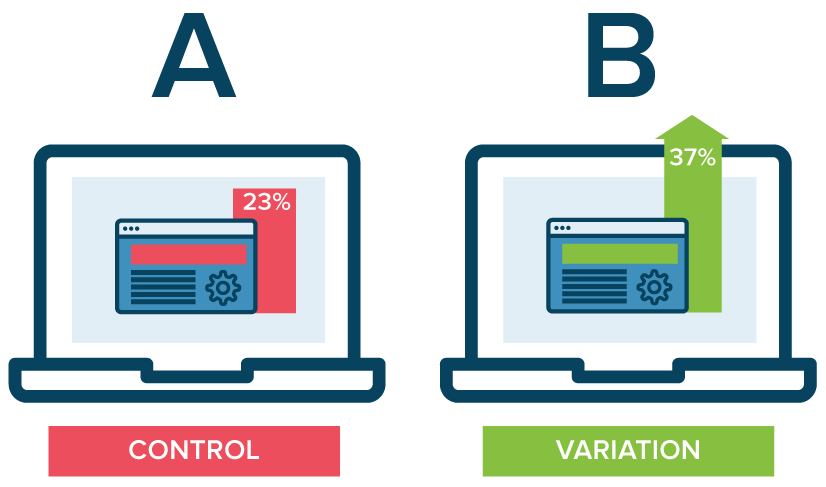
Business leaders and data scientists alike face a difficult trade-off when running A/B tests: How big should the A/B test be? Or in other words, After collecting how many data points, or running for how many days, should we make a decision whether A or B is the best way to go?

This is a tradeoff because the sample size of an A/B test determines its statistical power. This statistical power, in simple terms, determines the probability of a A/B test showing an effect if there is actually really an effect. In general, the more data you collect, the higher the odds of you finding the real effect and making the right decision.

By default, researchers often aim for 80% power, with a 5% significance cutoff. But is this general guideline really optimal for the tradeoff between costs and benefits in your specific business context? Chris thinks not.

Chris said wrote a great three-piece blog in which he explains how you can mathematically determine the optimal duration of A/B-testing in your own company setting:

Part I: General Overview. Starts with a mostly non-technical overview and ends with a section called “Three lessons for practitioners”.

Part II: Expected lift. A more technical section that quantifies the benefits of experimentation as a function of sample size.

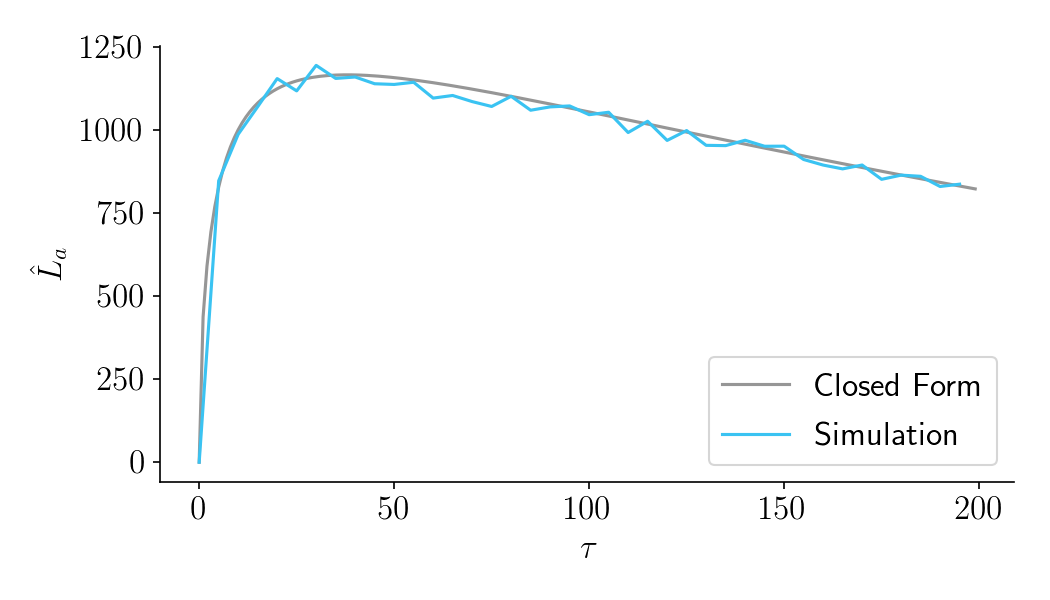
Part III: Aggregate time-discounted lift. A more technical section that quantifies the costs of experimentation as a function of sample size. It then combines costs and benefits into a closed-form expression that can be optimized. Ends with an FAQ.

Chris Said (via)

Moreover, Chris provides three practical advices that show underline 80% statistical power is not always the best option:

  1. You should run “underpowered” experiments if you have a very high discount rate
  2. You should run “underpowered” experiments if you have a small user base
  3. Neverheless, it’s far better to run your experiment too long than too short
Simulations shows that for Chris’ hypothetical company and A/B test, 38 days would be the optimal period of time to gather data
via chris-said.io/2020/01/10/optimizing-sample-sizes-in-ab-testing-part-I/

Chris ran all his simulations in Python and shared the notebooks.

CodeWars: Learn programming through test-driven development

CodeWars: Learn programming through test-driven development

As I wrote about Project Euler and CodingGame before, someone recommended me CodeWars. CodeWars offers free online learning exercises to develop your programming skills through fun daily challenges.

In line with Project Euler, you are tasked with solving increasingly complex programming challenges. At CodeWars, these little problems you need to solve with code are called kata.

Kata take a test-driven development approach: the programs you write need to pass the tests of the developer who made the kata in the first place. Only then are you awarded with honour and can you earn your ranks and progress to the more complex kata.

Sounds fun right? I’m definitely going to check this out, as they support a wide range of programming languages, each with many kata to solve!

Python, Ruby, C++, Java, JavaScript and many other main programming languages are already supported, but CodeWards is also still developing kata for more niche or upcoming languages like R, Lua, Kotlin, and Scala.

Caselaw Access Project: Structured data of over 6 million U.S. court decisions

Caselaw Access Project: Structured data of over 6 million U.S. court decisions

Case.law seems like a very interesting data source for a machine learning or text mining project:

The Caselaw Access Project (“CAP”) expands public access to U.S. law. Our goal is to make all published U.S. court decisions freely available to the public online, in a consistent format, digitized from the collection of the Harvard Law Library.

The capstone of the Caselaw Access Project is a robust set of tools which facilitate access to the cases and their associated metadata. We currently offer five ways to access the data: APIbulk downloadssearchbrowse, and a historical trends viewer.

https://case.law/about/

Our open-source API is the best option for anybody interested in programmatically accessing our metadata, full-text search, or individual cases.

If you need a large collection of cases, you will probably be best served by our bulk data downloads. Bulk downloads for Illinois and Arkansas are available without a login, and unlimited bulk files are available to research scholars.

https://case.law/about/

Case metadata, such as the case name, citation, court, date, etc., is freely and openly accessible without limitation. Full case text can be freely viewed or downloaded but you must register for an account to do so, and currently you may view or download no more than 500 cases per day. In addition, research scholars can qualify for bulk data access by agreeing to certain use and redistribution restrictions. You can request a bulk access agreement by creating an account and then visiting your account page.

Access limitations on full text and bulk data are a component of Harvard’s collaboration agreement with Ravel Law, Inc. (now part of Lexis-Nexis). These limitations will end, at the latest, in March of 2024. In addition, these limitations apply only to cases from jurisdictions that continue to publish their official case law in print form. Once a jurisdiction transitions from print-first publishing to digital-first publishing, these limitations cease. Thus far, Illinois and Arkansas have made this important and positive shift and, as a result, all historical cases from these jurisdictions are freely available to the public without restriction. We hope many other jurisdictions will follow their example soon.

https://case.law/about/

A different project altogether is helping the team behind Caselaw improve its data quality:

Our data inevitably includes countless errors as part of the digitization process. The public launch of this project is only the start of discovering errors, and we hope you will help us in finding and fixing them.

Some parts of our data are higher quality than others. Case metadata, such as the party names, docket number, citation, and date, has received human review. Case text and general head matter has been generated by machine OCR and has not received human review.

You can report errors of all kinds at our Github issue tracker, where you can also see currently known issues. We particularly welcome metadata corrections, feature requests, and suggestions for large-scale algorithmic changes. We are not currently able to process individual OCR corrections, but welcome general suggestions on the OCR correction process.

https://case.law/about/
Online Workshop Tidy Data Science in R, by Jake Thompson

Online Workshop Tidy Data Science in R, by Jake Thompson

Here’s a website hosting for a five-day hands-on workshop based on the book “R for Data Science”.

The workshop was originally offered as part of the Stats Camp: Summer Statistical Institute in Lawrence, KS and hosted by the Center for Research Methods and Data Analysis and the Achievement and Assessment Instituteat the University of Kansas. It is designed for those who want to learn practical applications of R for data analysis.

You can download the Workshop files, but I suggest you do so via the original workshop webpage.

This workshop is designed for those who want to learn how to use R to analyze data. The material is based on Hadley Wickham and Garrett Grolemund’s R for Data Science. We’ll talk about how to conduct a complete data analysis from data import to final reporting in R using a suite of packages known as the tidyverse. The two goals of this workshop are: 1) learn how to use R to answer questions about our data; and 2) write code that is human readable and reproducible. We will also talk about how to share our code and analyses with others.

You should take this workshop if you are new to R, or to the tidyverse, and want to learn how to take advantage of this ecosystem to do data analysis. You’ll get the most from the workshop if you are primarily interested in applying pre-existing R packages and functions to your own data. We will give minimal tutorials on how to write your own functions; however, the main focus will be on using existing tools, rather than building our own.

About this workshop

=

Generalized Additive Models Tutorial in R, by Noam Ross

Generalized Additive Models Tutorial in R, by Noam Ross

Generalized Additive Models — or GAMs in short — have been somewhat of a mystery to me. I’ve known about them, but didn’t know exactly what they did, or when they’re useful. That came to an end when I found out about this tutorial by Noam Ross.

In this beautiful, online, interactive course, Noam allows you to program several GAMs yourself (in R) and to progressively learn about the different functions and features. I am currently halfway through, but already very much enjoy it.

If you’re already familiar with linear models and want to learn something new, I strongly recommend this course!

The interactive course asks you to program several GAMs yourself https://noamross.github.io/gams-in-r-course/
You progressively learn how to run, interpret, and visualize GAMs yourself https://noamross.github.io/gams-in-r-course/
After a while you are even able to visualize smoothed interactions between variables https://noamross.github.io/gams-in-r-course/