Tag: table

10 Guidelines to Better Table Design

10 Guidelines to Better Table Design

Jon Schwabisch recently proposed ten guidelines for better table design.

Next to the academic paper, Jon shared his recommendations in a Twitter thread.

Let me summarize them for you:

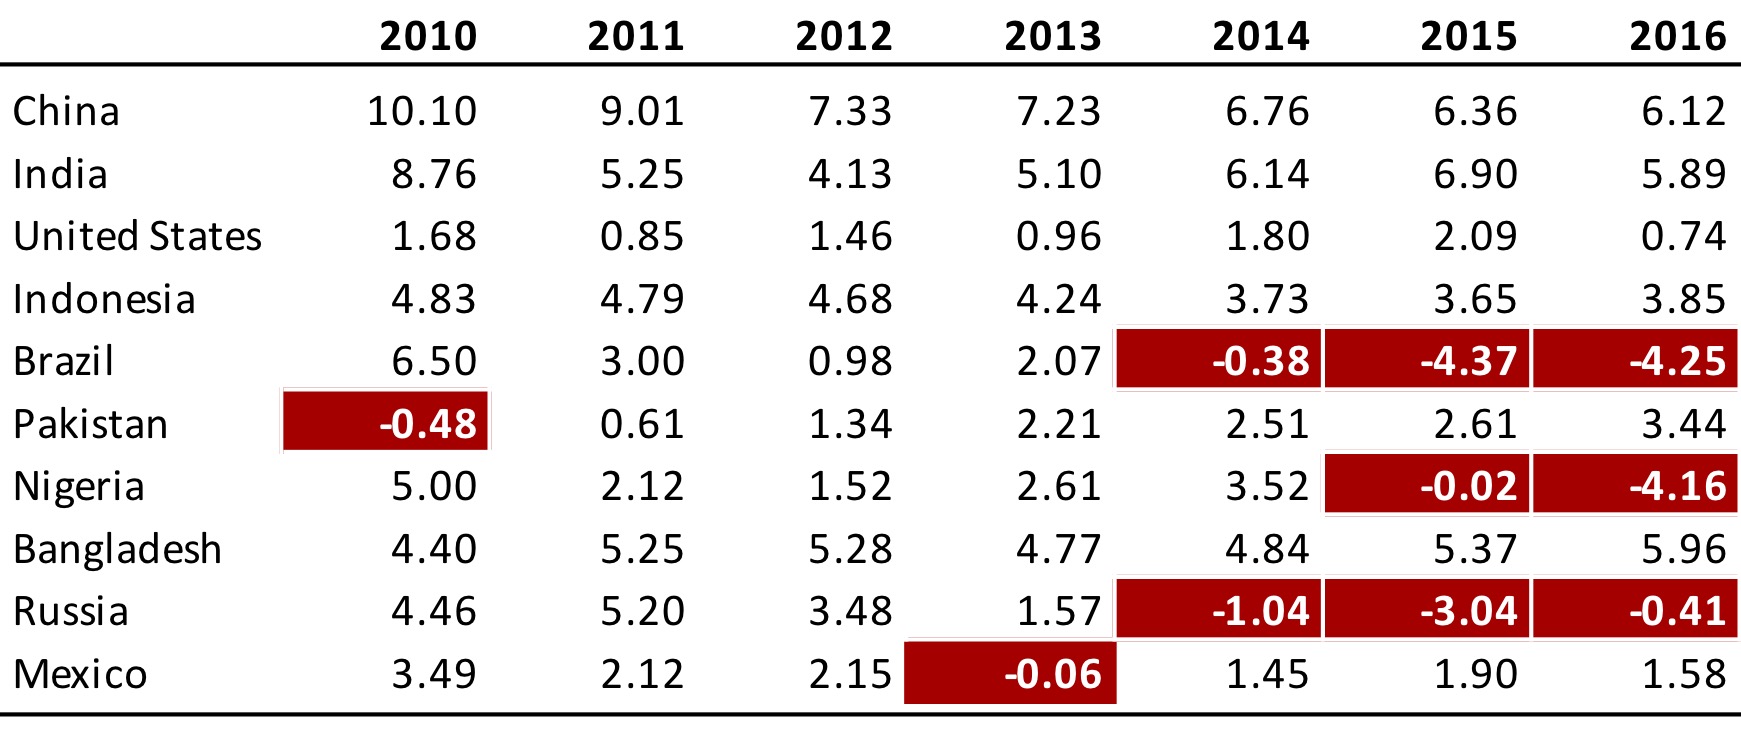
  • Right-align your numbers
  • Left-align your texts
  • Use decimals appropriately (one or two is often enough)
  • Display units (e.g., $, %) sparsely (e.g., only on first row)
  • Highlight outliers
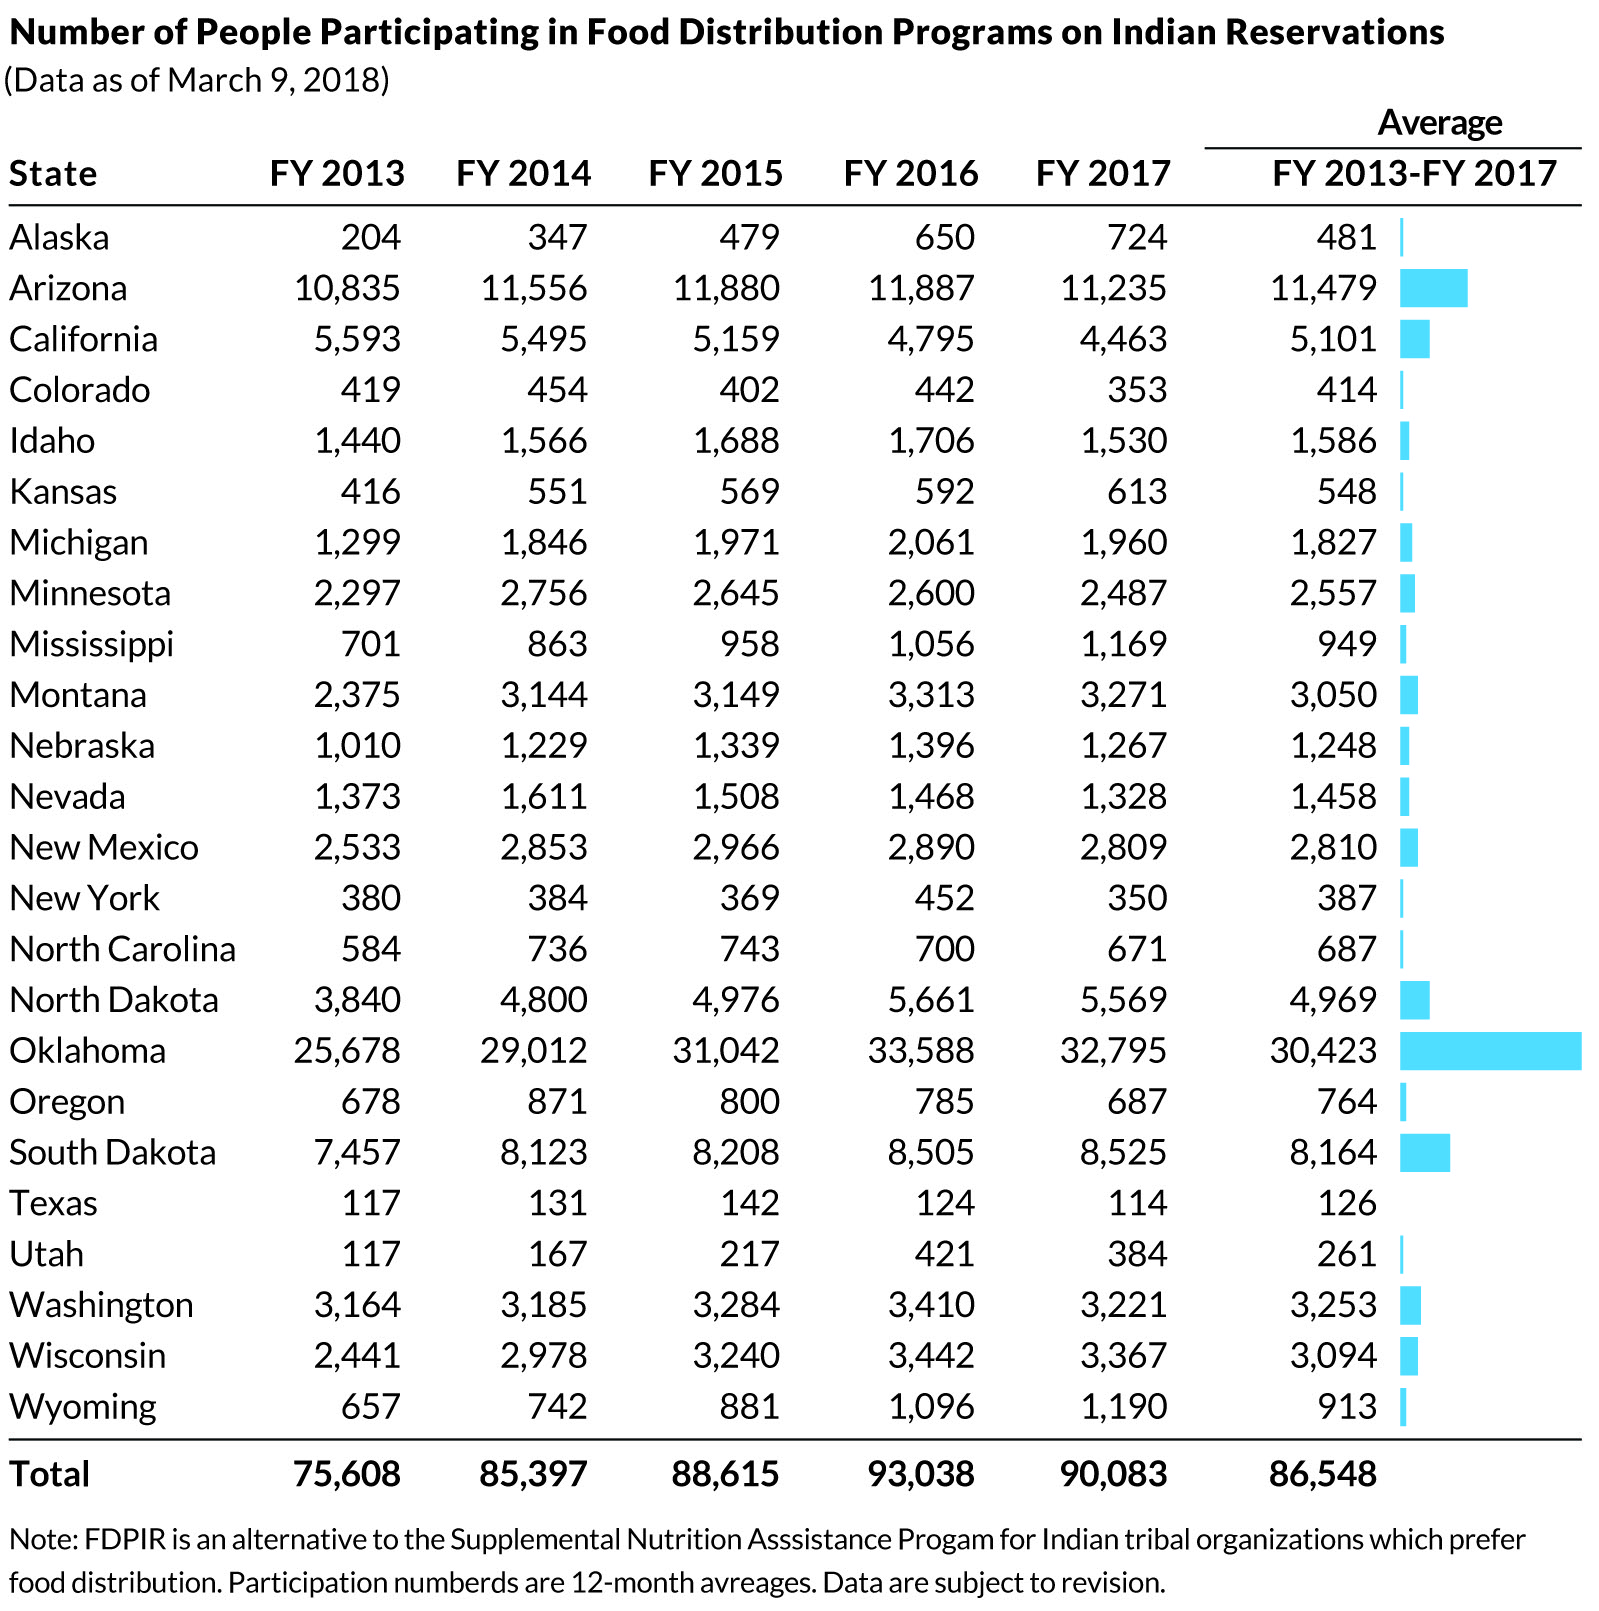
  • Highlight column headers
  • Use subtle highlights and dividers
  • Use white space between rows and columns
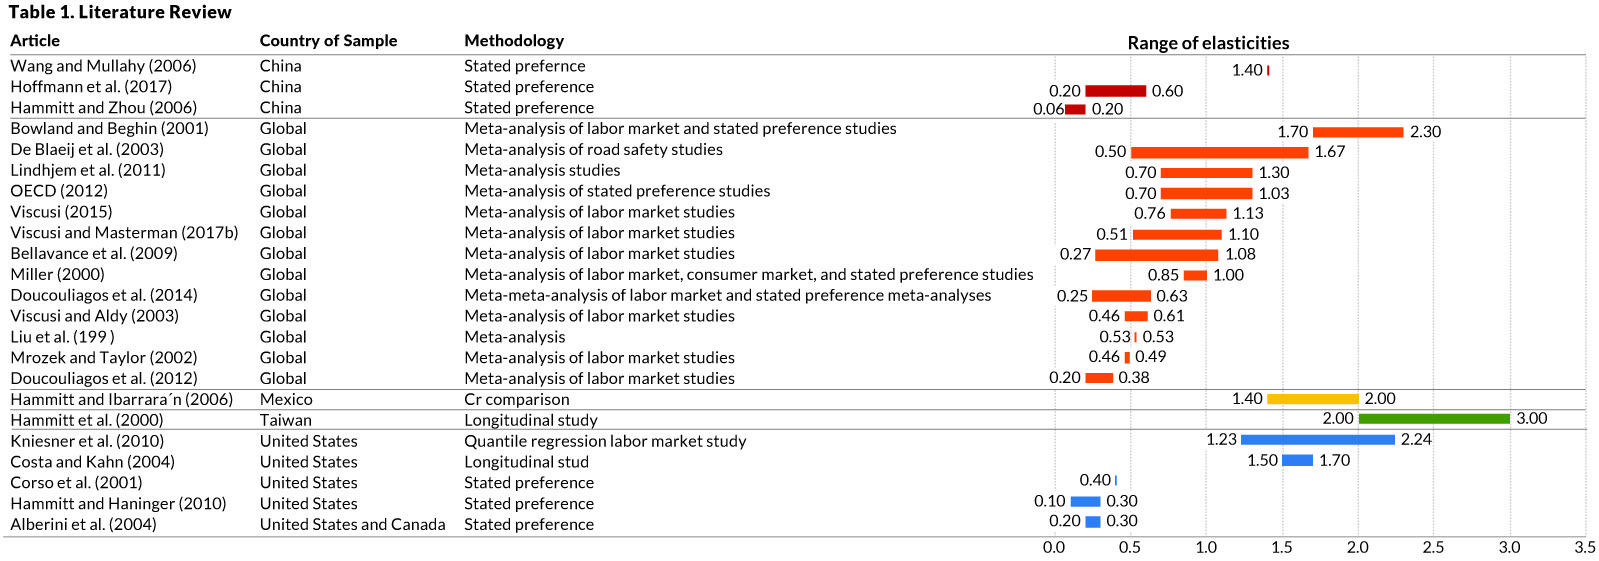
  • Use white space (or dividers) to highlight groups
  • Use visualizations for large tables
Afbeelding
Highlights in a table. Via twitter.com/jschwabish/status/1290324966190338049/photo/2
Afbeelding
Visualizations in a table. Via twitter.com/jschwabish/status/1290325409570197509/photo/3
Afbeelding
Example of a well-organized table. Via twitter.com/jschwabish/status/1290325663543627784/photo/2
The Dataviz Project: Find just the right visualization

The Dataviz Project: Find just the right visualization

Do you have a bunch of data but you can’t seem to figure out how to display it? Or looking for that one specific visualization of which you can’t remember the name?

www.datavizproject.com provides a most comprehensive overview of all the different ways to visualize your data. You can sort all options by Family, Input, Function, and Shape to find that one dataviz that best conveys your message.

datavizproject overview

Update: look at some of these other repositories here or here.