Update March, 2021: My R package for the predictive power score (ppsr) is live on CRAN!
Try install.packages("ppsr") in your R terminal to get the latest version.
Last week, I shared this Medium blog on PPS — or Predictive Power Score — on my LinkedIn and got so many enthousiastic responses, that I had to share it with here too.
Basically, the predictive power score is a normalized metric (values range from 0 to 1) that shows you to what extent you can use a variable X (say age) to predict a variable Y (say weight in kgs).
A PPS high score of, for instance, 0.85, would show that weight can be predicted pretty good using age.
A low PPS score, of say 0.10, would imply that weight is hard to predict using age.
The PPS acts a bit like a correlation coefficient we’re used too, but it is also different in many ways that are useful to data scientists:
- PPS also detects and summarizes non-linear relationships
- PPS is assymetric, so that it models Y ~ X, but not necessarily X ~ Y
- PPS can summarize predictive value of / among categorical variables and nominal data
However, you may argue that the PPS is harder to interpret than the common correlation coefficent:
- PPS can reflect quite complex and very different patterns
- Therefore, PPS are hard to compare: a 0.5 may reflect a linear relationship but also many other relationships
- PPS are highly dependent on the used algorithm: you can use any algorithm from OLS to CART to full-blown NN or XGBoost. Your algorithm hihgly depends the patterns you’ll detect and thus your scores
- PPS are highly dependent on the the evaluation metric (RMSE, MAE, etc).
Here’s an example picture from the original blog, showing a case in which PSS shows the relevant predictive value of Y ~ X, whereas a correlation coefficient would show no relationship whatsoever:

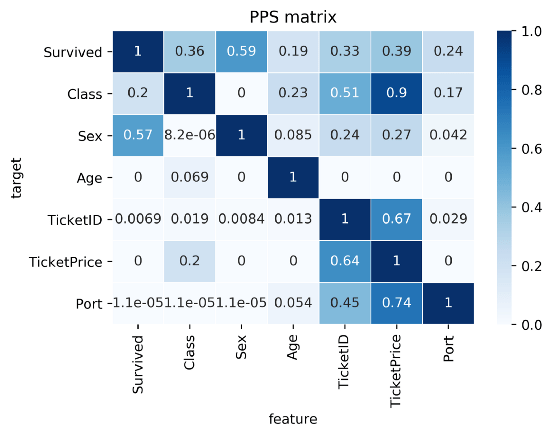
Here’s two more pictures from the original blog showing the differences with a standard correlation matrix on the Titanic data:

I highly suggest you read the original blog for more details and information, and that you check out the associated Python package ppscore:
Installing the package:
pip install ppscore
Calculating the PPS for a given pandas dataframe:
import ppscore as pps
pps.score(df, "feature_column", "target_column")
You can also calculate the whole PPS matrix:
pps.matrix(df)
There’s no R package yet, but it should not be hard to implement this general logic.
Florian Wetschoreck — the author — already noted that there may be several use cases where he’d think PPS may add value:
Find patterns in the data [red: data exploration]: The PPS finds every relationship that the correlation finds — and more. Thus, you can use the PPS matrix as an alternative to the correlation matrix to detect and understand linear or nonlinear patterns in your data. This is possible across data types using a single score that always ranges from 0 to 1.
Feature selection: In addition to your usual feature selection mechanism, you can use the predictive power score to find good predictors for your target column. Also, you can eliminate features that just add random noise. Those features sometimes still score high in feature importance metrics. In addition, you can eliminate features that can be predicted by other features because they don’t add new information. Besides, you can identify pairs of mutually predictive features in the PPS matrix — this includes strongly correlated features but will also detect non-linear relationships.
Detect information leakage: Use the PPS matrix to detect information leakage between variables — even if the information leakage is mediated via other variables.
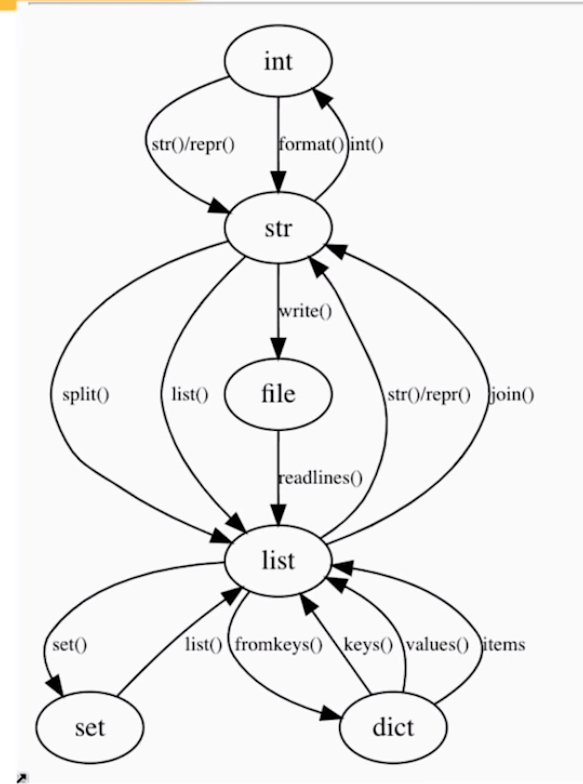
Data Normalization: Find entity structures in the data via interpreting the PPS matrix as a directed graph. This might be surprising when the data contains latent structures that were previously unknown. For example: the TicketID in the Titanic dataset is often an indicator for a family.
https://towardsdatascience.com/rip-correlation-introducing-the-predictive-power-score-3d90808b9598