Tag: personaldevelopment

#100DaysOfCode: Machine Learning & Data Visualization

#100DaysOfCode: Machine Learning & Data Visualization

2018 seemed to be the year of challenges going viral on the web. Most of them were plain stupid and/or dangerous. However, one viral challenge I did like: #100DaysOfCode

1. Code minimum an hour every day for the next 100 days.

2. Tweet your progress every day with the #100DaysOfCode hashtag.

3. Each day, reach out to at least two people on Twitter who are also doing the challenge

100 Days of Code rulebook

Many (aspiring) programming professionals competed in this challenge, sharing their learning journeys in domains from web development, machine learning, or data visualization.

With this blog, I wanted to share two of those learning journeys that stood out for me.

Machine learning

First, there’s Avik Jain’s 100 days of Machine Learning code repository on Github. Avik’s repository contains all learning activities he followed during the 53 days of programming he completed. Some of Avik’s entries really stood out, and I particularly liked his educational infographics:

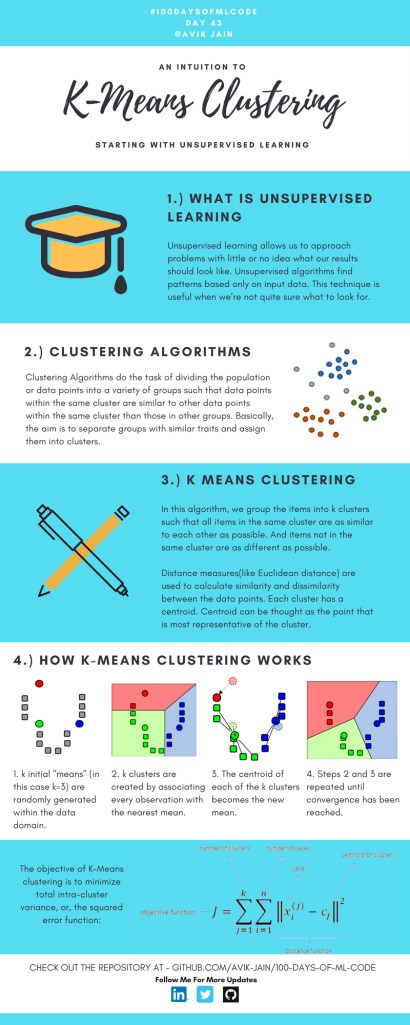
Just look at the wonderful design and visual aids on this decision tree for dummies infographic, pseudocode and all:

Day 23: Decision trees for dummies. This just looks fabulous right?!

Apart from the infographics, Avik also links to many very well produced tutorials that helped him improve his machine learning skills. Such as the free Python for Data Science Handbook Avik worked through, or this Youtube tutorial on deep learning in Python with Tensorflow and Keras:

Although Avik didn’t seem to have completed the full 100 days, many others did.

Data visualization

I have blogged about Hannah Yan Han‘s 100 days of code project before, but she definately deserves another mention here. Her 100 days revolved around data science, data visualization, and storytelling using both R and Python. You can find her #100DaysOfCode Medium page here, and her associated Github repository here.

For example, one day Hannah explored where instant noodles come from, how they are served, and whether people like them or not.

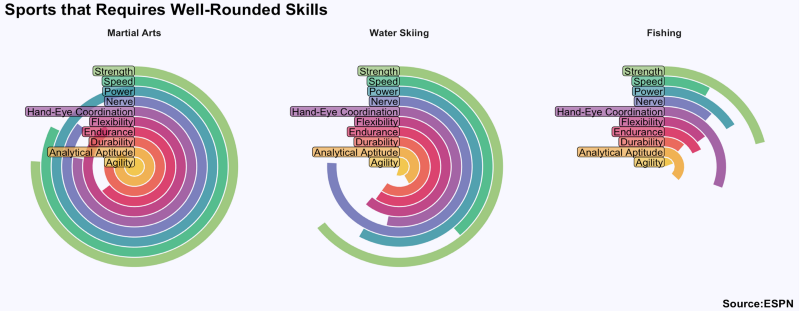
A different day she would examine which sports are the thoughest:

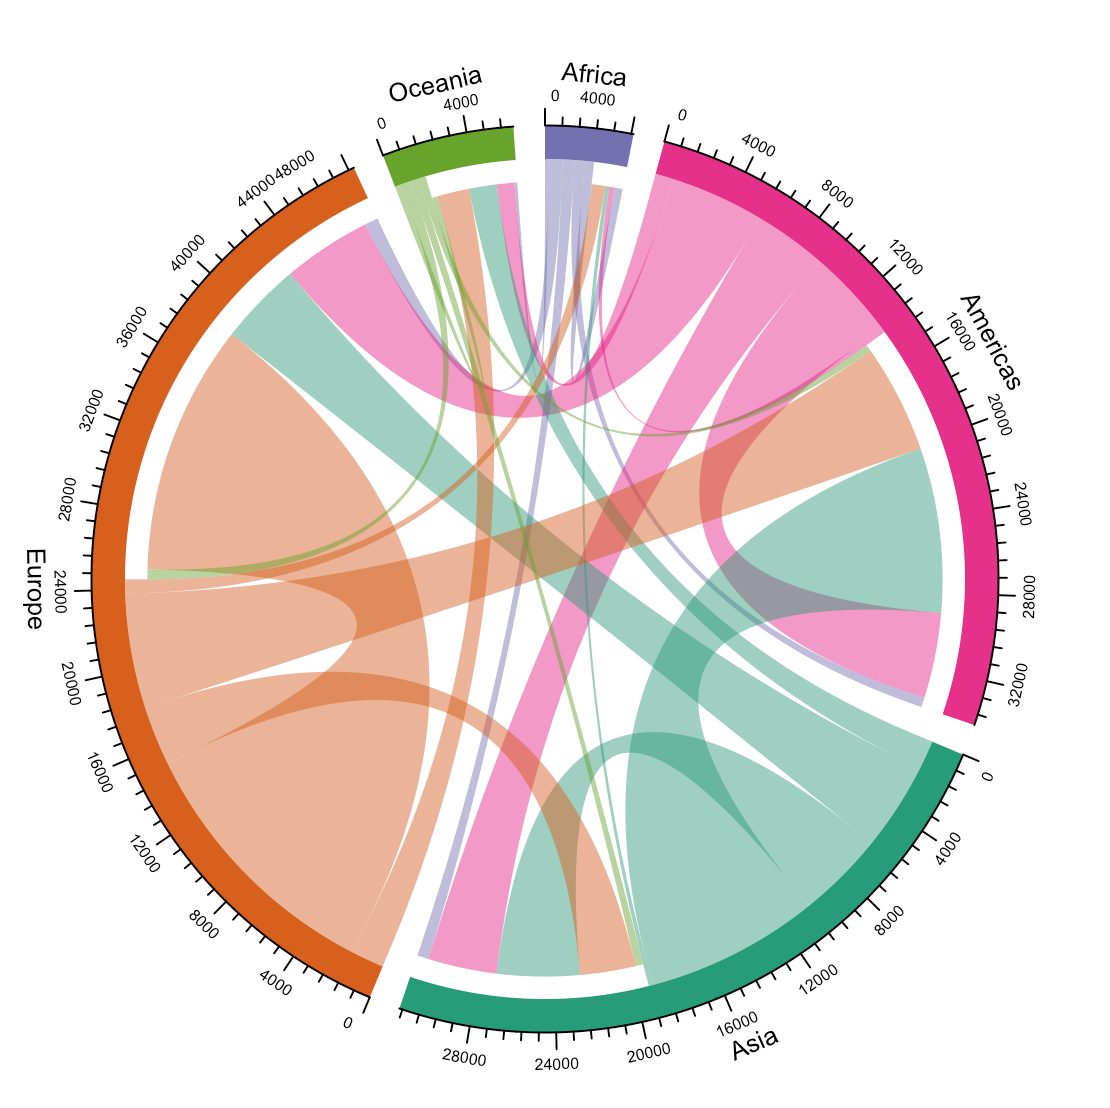
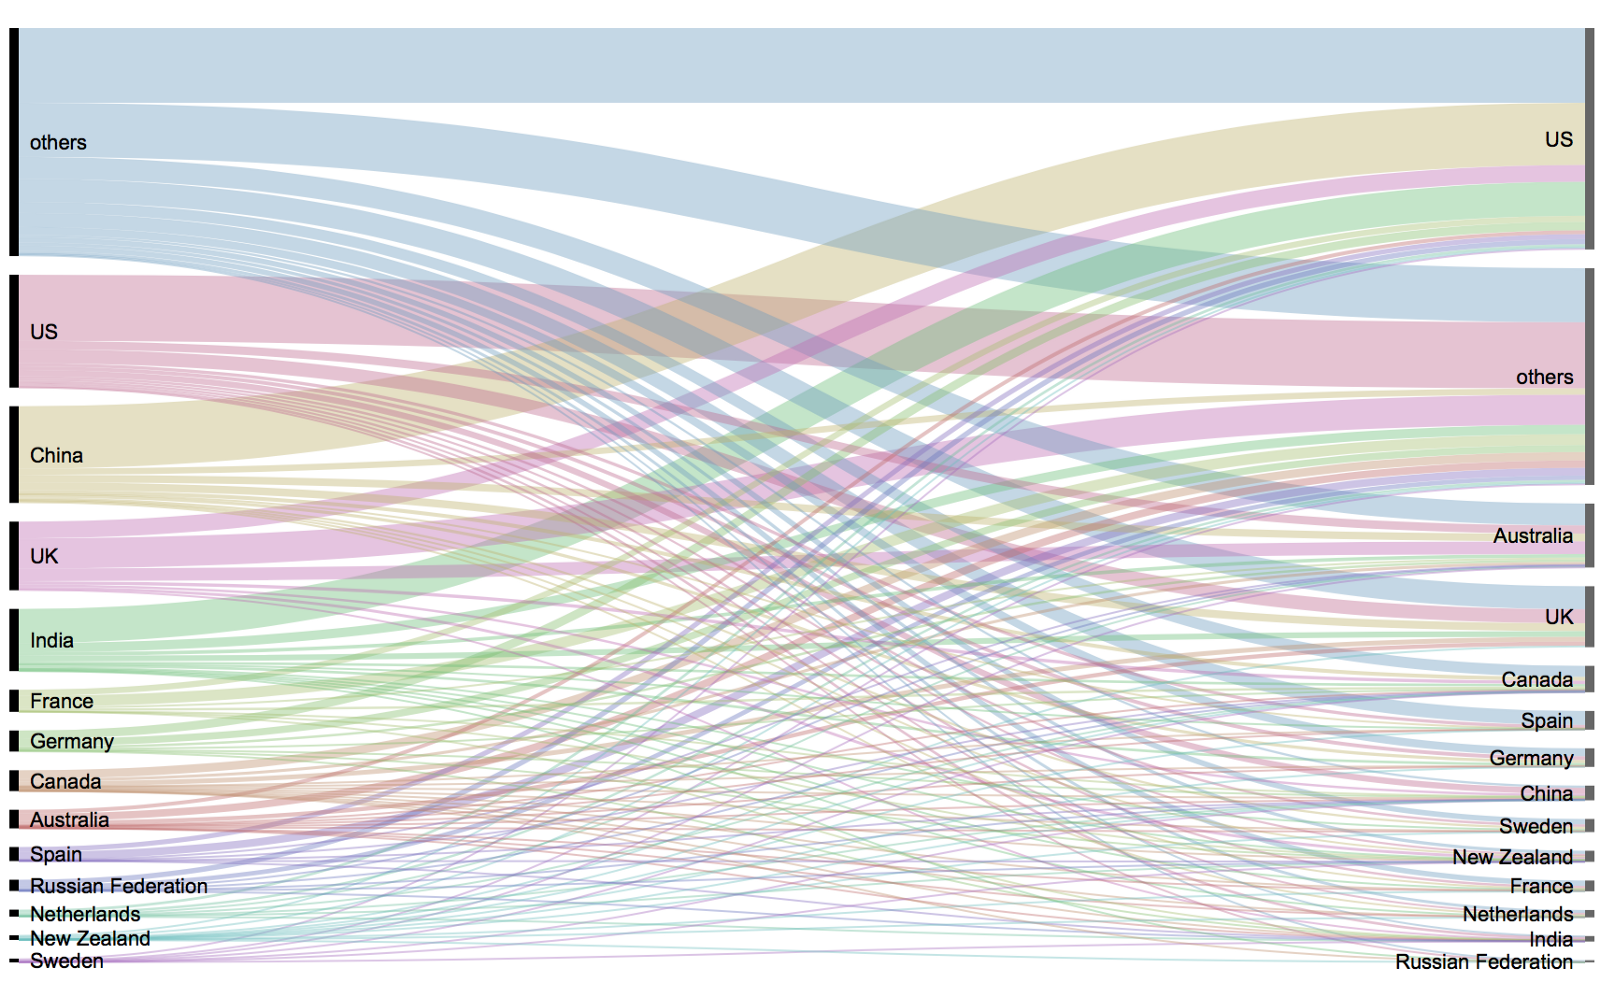
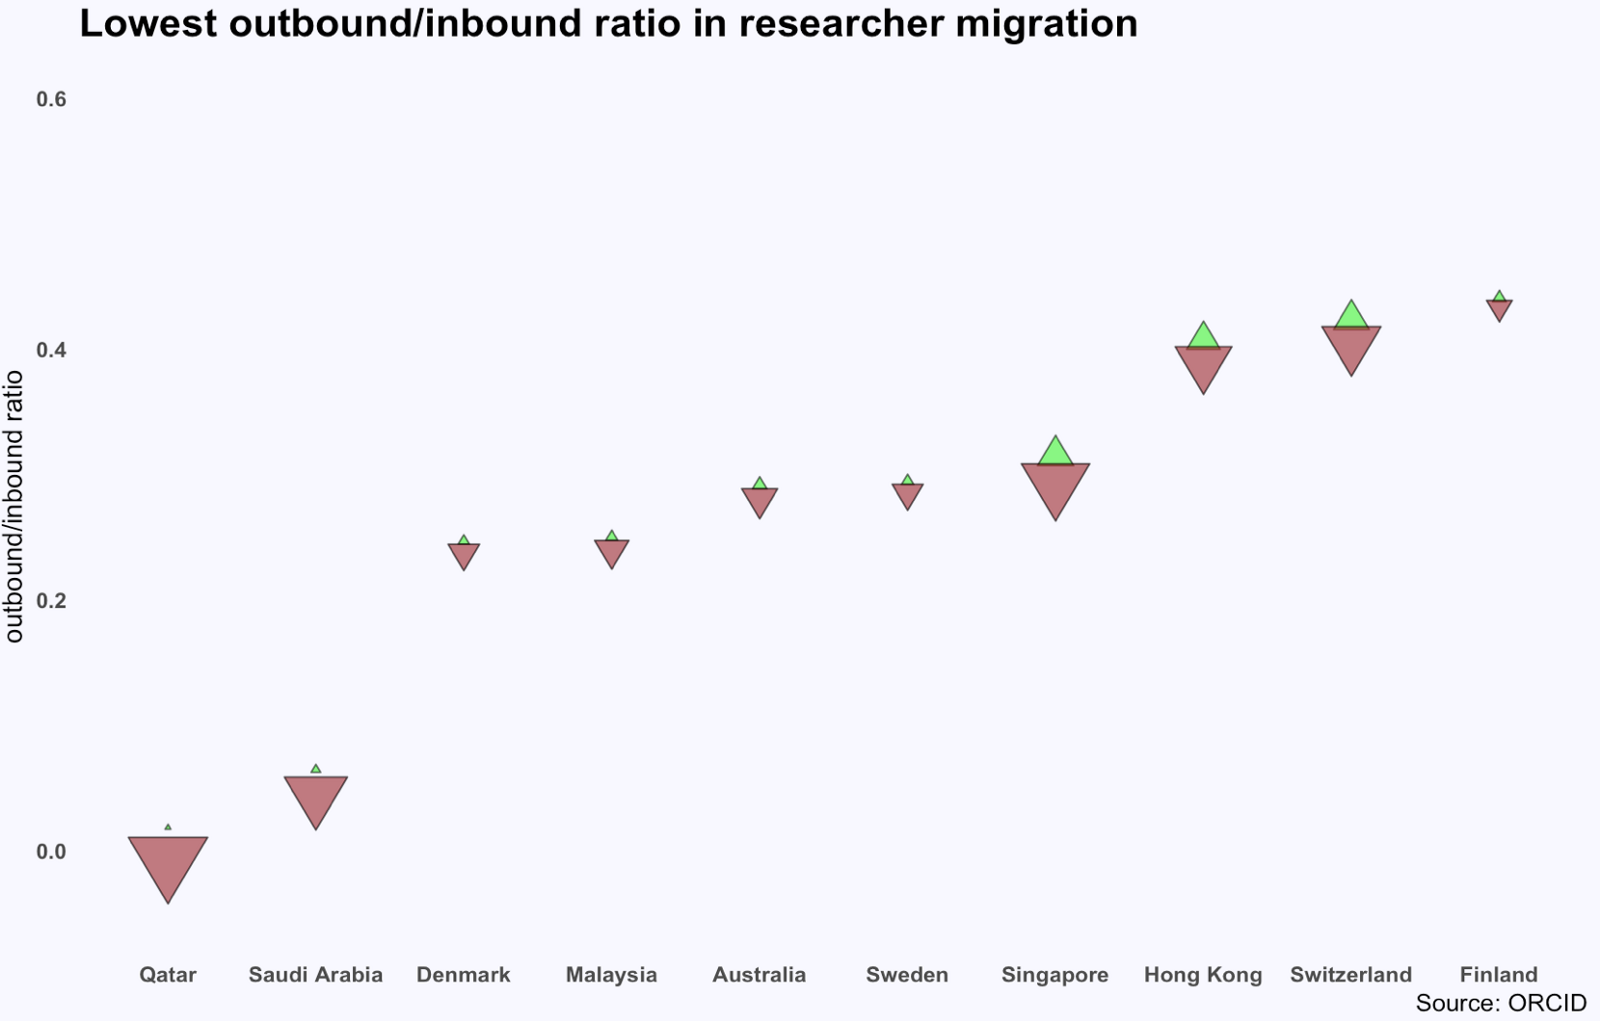
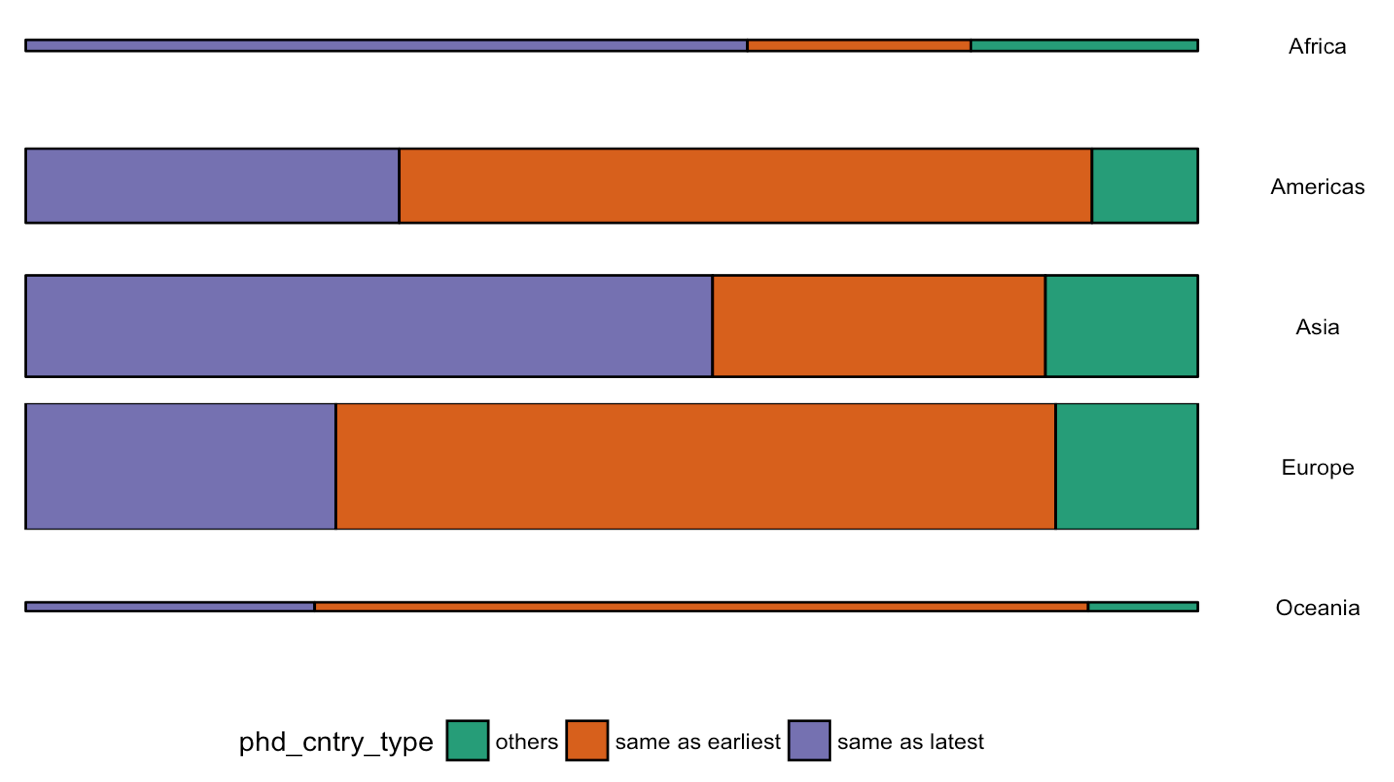
Or how scientific researchers migrate across the globe:

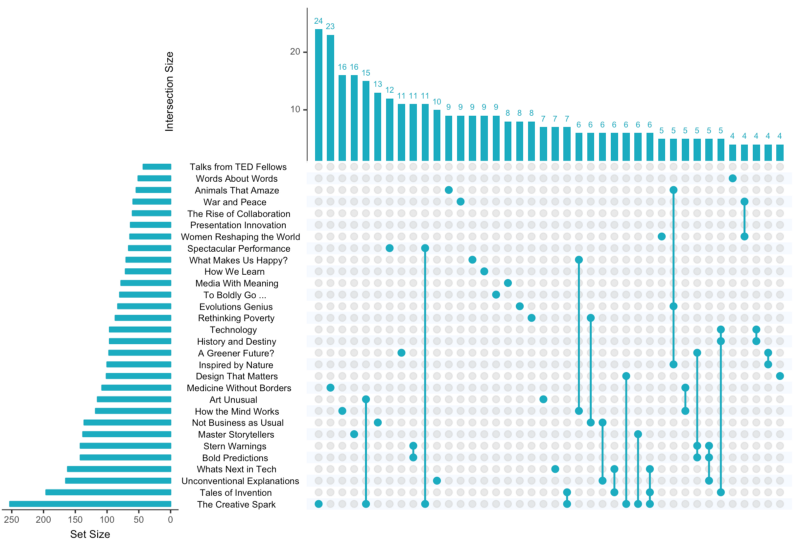
Hannah used many different plot types in those 100 days. Also some lesser known ones, like these upset plots on TED talk data:

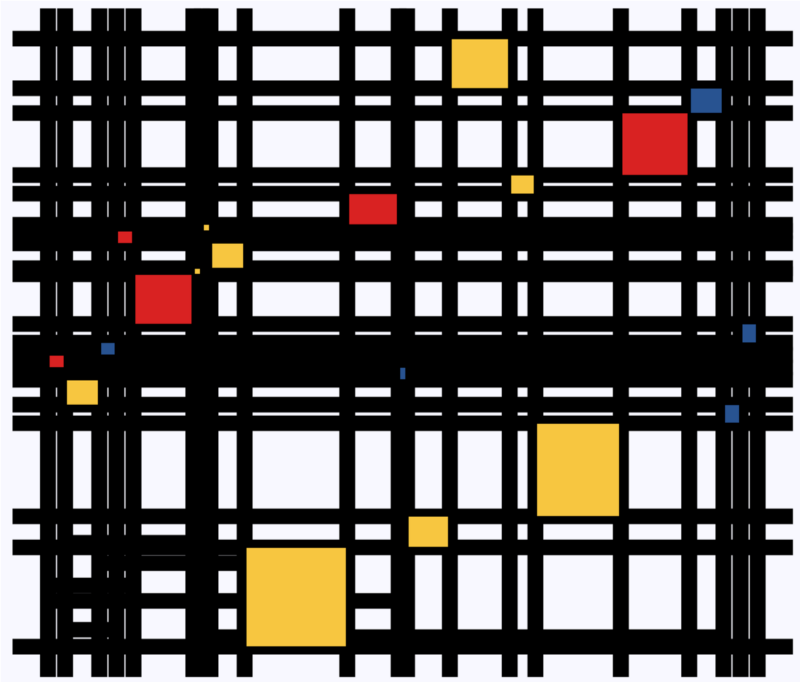
Heck, she even made her own R package to generate Mondriaan-like paintings on one of the days:

What I found so great about Hannah’s project is that she picked a novel dataset every couple of days. Moreover, she used a extremely large variety of different visualization formats. All visuals were equally beautiful, but Hannah made sure to pick the right one for the purpose she was trying to serve. If you are interested in data visualization, you seriously should check out Hannah’s 100DaysOfCode Medium page.

Predictive HR Analytics

Predictive HR Analytics

Tilburg University has set up a masterclass Predictive HR Analytics. In 3 days, the Professional Learning program will teach you all you need to know to implement predictive analytics and take HR to the next level. More information can be found here.

What makes this program unique?

  • The masterclass Predictive HR Analytics goes beyond HR analytics and focuses on transformational people predictions. You learn how to embed predictive HR analytics into your HR Strategy and how to use your findings to convince others.
  • The masterclass is developed at the prestigious Human Resources department at Tilburg University, which has obtained international recognition with its high-quality academic research in the HRM field.
  • The mix of professors in conjunction with leading HR professionals leads to a strong academic program with a practical approach.
  • Your peer participants will make sure that the class opens up a high-quality network of HR specialists. The diversity of leading companies from different sectors in the classroom creates new insights for all the participants.
  • The program is like a 3-day pressure cooker. By combining online and offline components, we can create more in-depth discussions in the classroom.
  • You will experience a high impact on your daily practice, since the program is focused on direct implementation.

Your profile

This course is ideal for anyone in HR seeking to become more adept in using quantitative data for decision making. Typical participants are (future) HR analysts, HR managers, HR business partners, HR consultants and (financial) business analysts with a strong link on people resources. Participants are from various sectors, such as financial services, healthcare institutions, government agencies and business services.

New to R? Kickstart your learning and career with these 6 steps!

New to R? Kickstart your learning and career with these 6 steps!

For newcomers, R code can look like old Egyptian hieroglyphs with its weird operators (%in%,<-,||, or %/%). The R language has been said to have a steep learning curve and although there are many introductory courses and books (see R Resources), it’s hard to decide where to start.

Fortunately, I am here to help! The below is a six-step guide on how to learning R, using only open access (i.e., free!) materials.

Although oriented at complete newcomers, it will have you writing your own practical scripts and programs in no time: just start at #1 and work your way to coding mastery!

If you already feel comfortable with the basics of R — or don’t like basics — you can start at #5 and jump into practical learning via the tidyverse.

Good luck!!!

Step 1: An R Folder (15 min)

Create a directory for your R learning stuff somewhere on your computer. Download this (very) short introduction to R by Paul Torfs and Claudia Bauer and store it in that folder. Now read the introduction and follow the steps. It will help you install all R software on your own computer and familiarize you with the standard data types.

Step 2: Handy Cheat Sheets (15 min)

Many standard functions exist in R and after a while you will remember them by heart. For now, it’s good to have a dictionary or references close by hand. Download and read the cheat sheets for base R (Mhairi McNeill) and R base functions (Tom Short). Because you’ll be writing most of your R scripts in RStudio, it’s also recommended to have an RStudio cheat sheet as well as an RStudio keyboard shortcuts cheat sheet by hand.

Step 3: swirl Away in RStudio (8h)

Now you’re ready to really start learning and we’re going to accelerate via swirl. Open up your RStudio and enter the two lines of code below in your console window.

install.packages('swirl') #download swirl package 
library(swirl) #load in swirl package

swirl (webpage) will automatically start and after a couple of prompts you will be able to choose the learning course called 1: R Programming: The basics of programming in R (see below). This course consists of 15 modules via which you will master the basics of R in the environment itself. Start with module 1 and complete between one to three modules per day, so that you finish the swirl course in a week.

Starting up swirl in RStudio
swirl’s R 4 learning courses and the 15 modules belonging to the basics of R programming course

Step 4: A Pirate’s Guide to R (10h)

OK, you should now be familiar with the basics of R. However, knowledge is crystallized via repetition. I therefore suggest, you walk through the book YaRrr! The Pirate’s Guide to R (Phillips, 2017) starting in chapter 3. It’s a fun book and will provide you with more knowledge on how to program custom functions, loops, and some basic statistical modelling techniques – the thing R was actually designed for.

Step 5: R for Data Science (16h)

By now, you can say you might say you are an adapt R programmer with statistical modelling experience. However, you have been working with base R functions mostly, knowledge of which is a must-have to really understand the language. In practice, R programmers rely strongly on developed packages nevertheless. A very useful group of packages is commonly referred to as the tidyverse. You will be amazed at how much this set of packages simplifies working in R. The next step therefore, is to work through the book R for Data Science (Grolemund & Wickham, 2017) (hardcopy here).

Step 6: Specialize (∞)

You are now several steps and a couple of weeks further. You possess basic knowledge of the R language, know how to write scripts in RStudio, are capable of programming in base R as well as using the advanced functionality of the tidyverse, and you have even made a start with some basic statistical modelling.

It’s time to set you loose in the wonderful world of the R community. If you had not done this earlier, you should get accounts on Stack Overflow and Cross Validated. You might also want to subscribe to the R Help Mailing ListR Bloggers, and to my website obviously.

Join 1,405 other followers

On Twitter, have a look at #rstats and, on reddit, subscribe to the rstats, rstudio, and statistics threads. At this time, I can’t but advise you to return to the R Resources Overview and to continue broadening your R programming skills. Pick materials in the area that interests you: