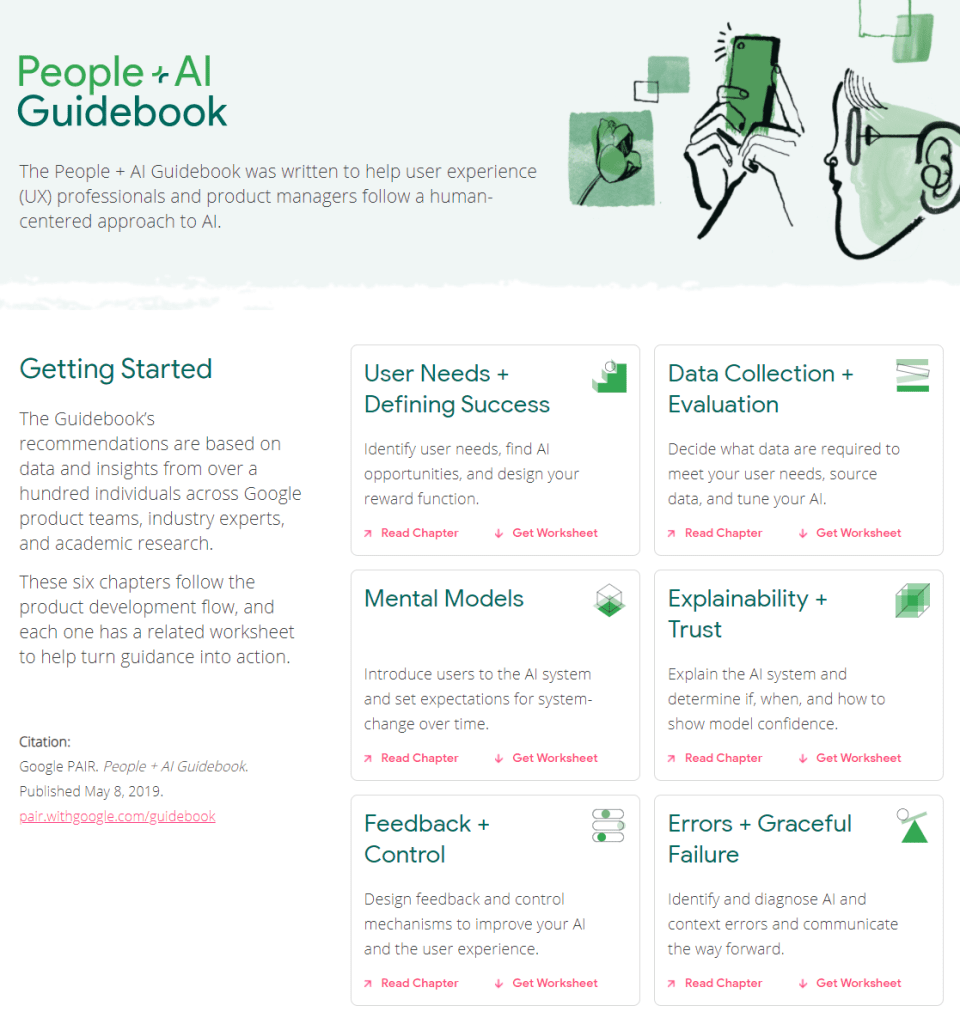
The People + AI Guidebook was written to help user experience (UX) professionals and product managers follow a human-centered approach to AI.
The Guidebook’s recommendations are based on data and insights from over a hundred individuals across Google product teams, industry experts, and academic research.
These six chapters follow the product development flow, and each one has a related worksheet to help turn guidance into action.
The People & AI guidebook is one of the products of the major PAIR project team (People & AI Research).
Here are the direct links to the six guidebook chapters:
Most data scientists favor Python as a programming language these days. However, there’s also still a large group of data scientists coming from a statistics, econometrics, or social science and therefore favoring R, the programming language they learned in university. Now there’s a new kid on the block: Julia.
According to some, you can think of Julia as a mixture of R and Python, but faster. As a programming language for data science, Julia has some major advantages:
Julia is light-weight and efficient and will run on the tiniest of computers
Julia is just-in-time (JIT) compiled, and can approach or match the speed of C
Julia is a functional language at its core
Julia support metaprogramming: Julia programs can generate other Julia programs
Julia has a math-friendly syntax
Julia has refined parallelization compared to other data science languages
Julia can call C, Fortran, Python or R packages
However, others also argue that Julia comes with some disadvantages for data science, like data frame printing, 1-indexing, and its external package management.
Comparing Julia to Python and R
Open Risk Manual published this side-by-side review of the main open source Data Science languages: Julia, Python, R.
You can click the links below to jump directly to the section you’re interested in. Once there, you can compare the packages and functions that allow you to perform Data Science tasks in the three languages.
Here’s a very well written Medium article that guides you through installing Julia and starting with some simple Data Science tasks. At least, Julia’s plots look like:
After several years of proscrastinating, the inevitable finally happened: Three months ago, I committed to learning Python!
I must say that getting started was not easy. One afternoon three months ago, I sat down, motivated to get started. Obviously, the first step was to download and install Python as well as something to write actual Python code. Coming from R, I had expected to be coding in a handy IDE within an hour or so. Oh boy, what was I wrong.
Apparently, there were already a couple of versions of Python present on my computer. And apparently, they were in grave conflict. I had one for the R reticulate package; one had come with Anaconda; another one from messing around with Tensorflow; and some more even. I was getting all kinds of error, warning, and conflict messages already, only 10 minutes in. Nothing I couldn’t handle in the end, but my good spirits had dropped slightly.
With Python installed, the obvious next step was to find the RStudio among the Python IDE’s and get working in that new environment. As an rational consumer, I went online to read about what people recommend as a good IDE. PyCharm seemed to be quite fancy for Data Science. However, what’s this Spyder alternative other people keep talking about? Come again, there are also Rodeo, Thonny, PyDev, and Wing? What about those then? A whole other group of Pythonista’s said that, as I work in Data Science, I should get Anaconda and work solely in Jupyter Notebooks! Okay…? But I want to learn Python to broaden my skills and do more regular software development as well. Maybe I start simple, in a (code) editor? However, here we have Atom, Sublime Text, Vim, and Eclipse? All these decisions. And I personally really dislike making regrettable decisions or committing to something suboptimal. This was already taking much, much longer than the few hours I had planned for setup.
This whole process demotivated so much that I reverted back to programming in R and RStudio the week after. However, I had not given up. Over the course of the week, I brought the selection back to Anaconda Jupyter Notebooks, PyCharm, and Atom, and I was ready to pick one. But wait… What’s this Visual Studio Code (VSC) thing by Microsoft. This looks fancy. And it’s still being developed and expanded. I had already been working in Visual Studio learning C++, and my experiences had been good so far. Moreover, Microsoft seems a reliable software development company, they must be able to build a good IDE? I decided to do one last deepdive.
The more I read about VSC and its features for Python, the more excited I got. Hey, VSC’s Python extension automatically detects Python interpreters, so it solves my conflicts-problem. Linting you say? Never heard of it, but I’ll have it. Okay, able to run notebooks, nice! Easy debugging, testing, and handy snippets… Okay! Machine learning-based IntelliSense autocompletes your Python code – that sounds like something I’d like. A shit-ton of extensions? Yes please! Multi-language support – even tools for R programming? Say no more! I’ll take it. I’ll take it all!
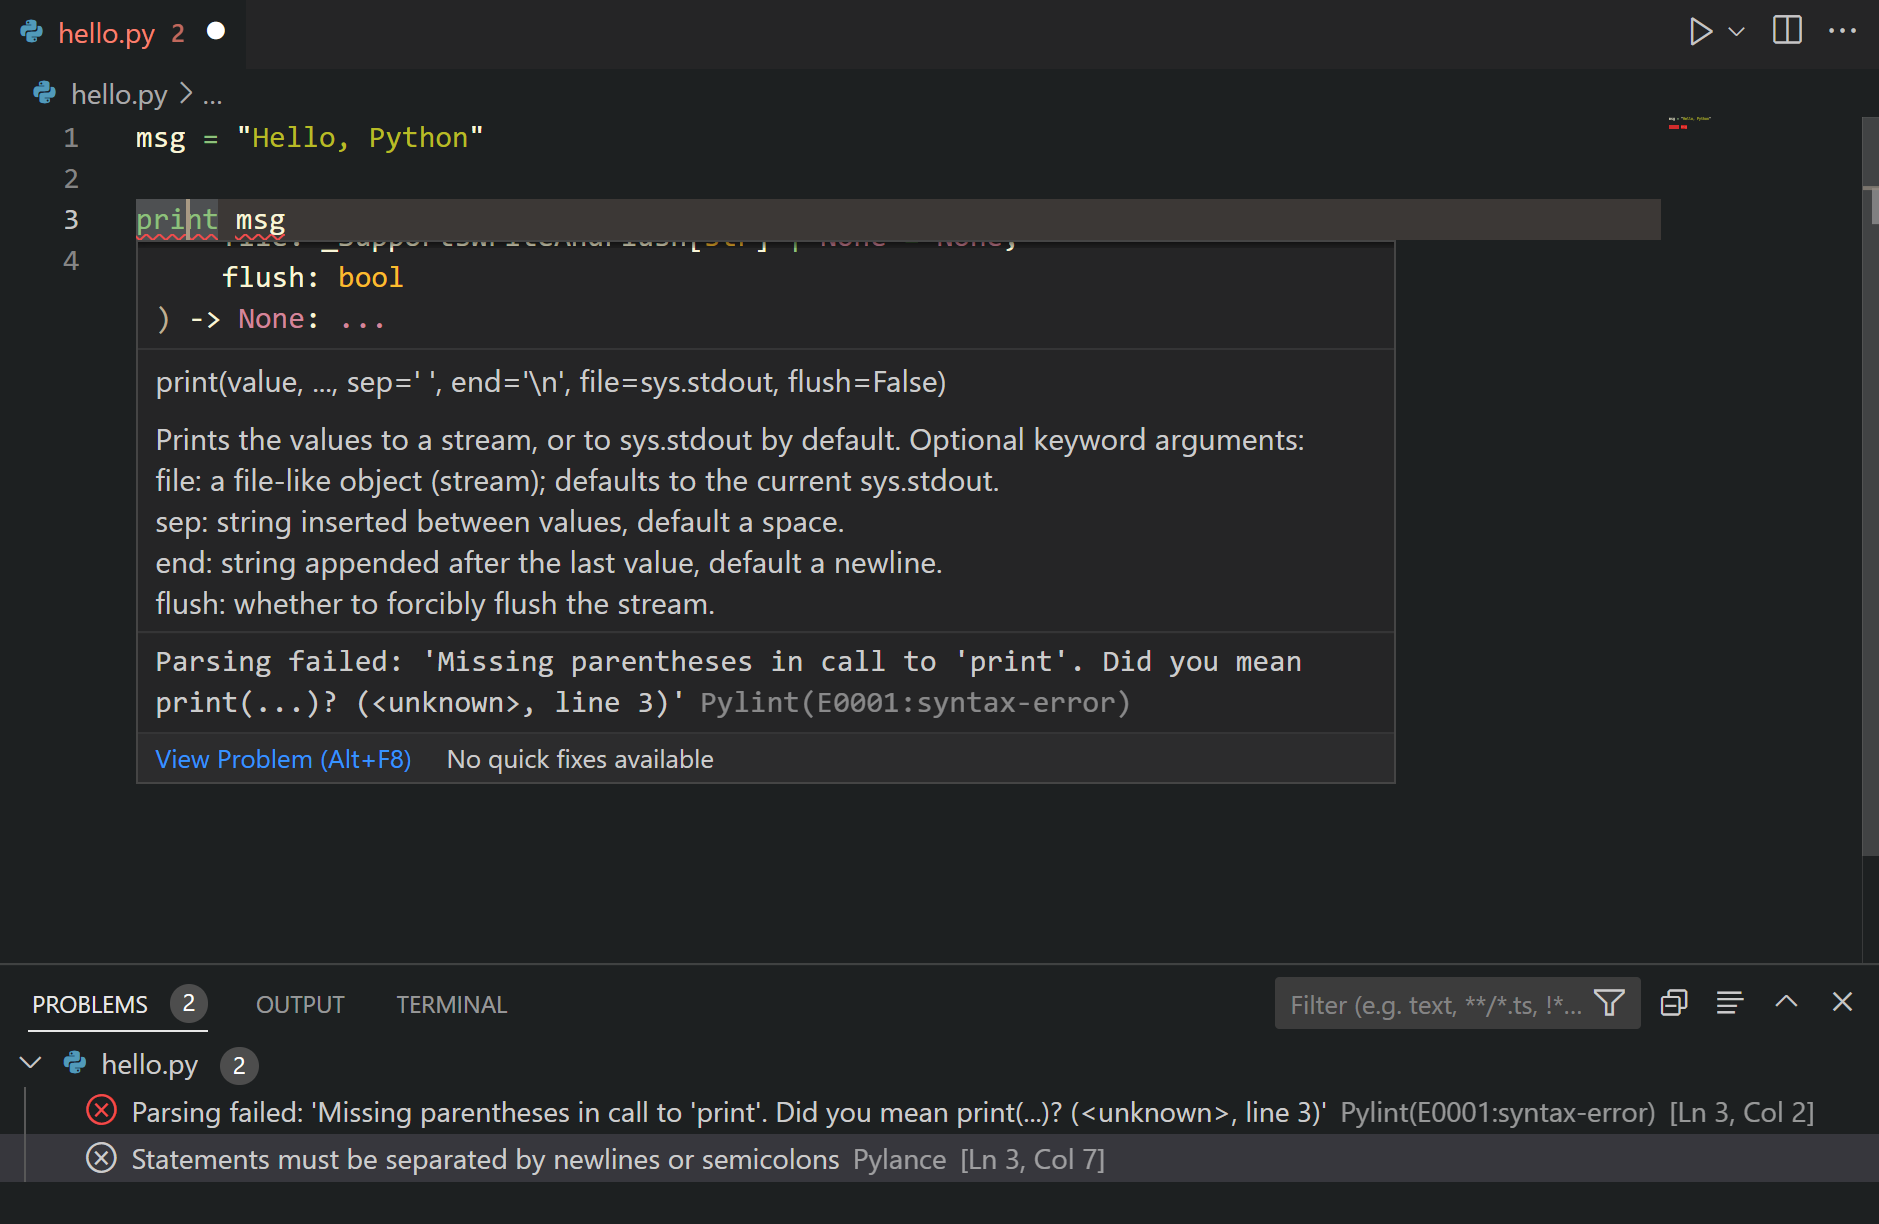
Linting in VSC provides code suggestions
My goods friends at Microsoft were not done yet though. To top it all of, they have documented everything so well. It’s super easy to get started! There are numerous ordered pages dedicated to helping you set up and discover your new Python environment in VSC:
The Microsoft VSC pages also link to some more specific resources:
Editing Python in VS Code: Learn more about how to take advantage of VS Code’s autocomplete and IntelliSense support for Python, including how to customize their behvior… or just turn them off.
Linting Python: Linting is the process of running a program that will analyse code for potential errors. Learn about the different forms of linting support VS Code provides for Python and how to set it up.
Debugging Python: Debugging is the process of identifying and removing errors from a computer program. This article covers how to initialize and configure debugging for Python with VS Code, how to set and validate breakpoints, attach a local script, perform debugging for different app types or on a remote computer, and some basic troubleshooting.
Unit testing Python: Covers some background explaining what unit testing means, an example walkthrough, enabling a test framework, creating and running your tests, debugging tests, and test configuration settings.
Python IntelliSense in VSC makes real-time code autocomplete suggestions
My Own Python Journey
So three months in I am completely blown away at how easy, fun, and versatile the language is. Nearly anything is possible, most of the language is intuitive and straightforward, and there’s a package for anything you can think of. Although I have spent many hours, I am very happy with the results. I did not get this far, this quickly, in any other language. Let me share some of the stuff I’ve done the past three months.
I’ve mainly been building stuff. Some things from scratch, others by tweaking and recycling other people’s code. In my opinion, reusing other people’s code is not necessarily bad, as long as you understand what the code does. Moreover, I’ve combed through lists and lists of build-it-yourself projects to get inspiration for projects and used stuff from my daily work and personal life as further reasons to code. I ended up building:
solutions to the first 31 problems of Project Euler, which I highly recommend you try to solve yourself!
solutions to the first dozen problems posed in Automate the Boring Stuff with Python. This book and online tutorial forces you to get your hands dirty right from the start. Simply amazing content and the learning curve is precisely good
"Programming today is a race between software engineers striving to build bigger and better idiot-proof programs, and the universe trying to build bigger and better idiots. So far, the universe is winning." – Rick Cook#programming#coding#ArtificialStupidity no.20 pic.twitter.com/cBiR1HQszn
all Socratica Python Youtube videos. They are simply a fantastic introduction to the language and amazingly amusing. You can sponsor them here
hours and hours of Corey Shafer’s Youtube channel. Seriously good quality content, and more in-depth than Socratica. Corey covers the versatile functionalities included in the standard Python libraries and then some more
Although it is no longer maintained, you might find some more, interesting links on my Python resources page or here, for those transitioning from R. If only the links to the more up-to-date resources pages. Anyway, hope this current blog helps you on your Python journey or to get Python and Visual Studio Code working on your computer. Please feel free to share any of the stories, struggles, or successes you experience!
Last week, this interesting reddit thread was filled with overviews for cool projects that may help you learn a programming language. The top entries are:
2018 seemed to be the year of challengesgoing viral on the web. Most of them were plain stupid and/or dangerous. However, one viral challenge I did like: #100DaysOfCode
1. Code minimum an hour every day for the next 100 days.
2. Tweet your progress every day with the #100DaysOfCode hashtag.
3. Each day, reach out to at least two people on Twitter who are also doing the challenge
Many (aspiring) programming professionals competed in this challenge, sharing their learning journeys in domains from web development, machine learning, or data visualization.
With this blog, I wanted to share two of those learning journeys that stood out for me.
Machine learning
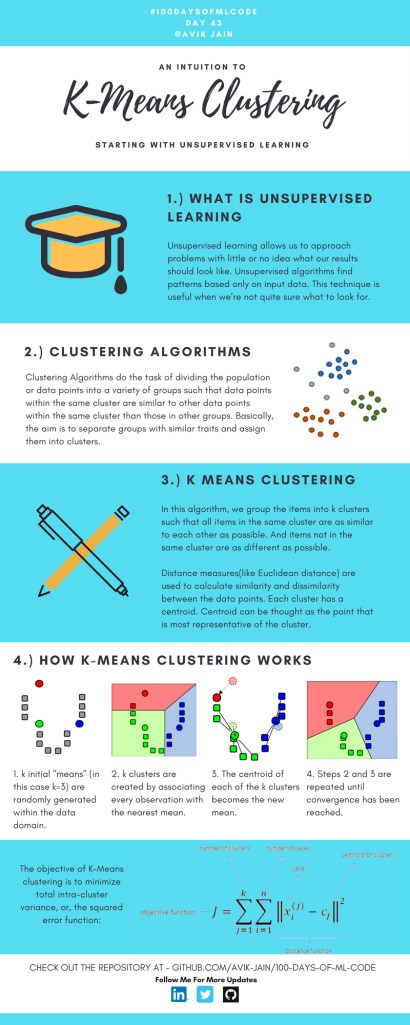
First, there’s Avik Jain’s 100 days of Machine Learning code repository on Github. Avik’s repository contains all learning activities he followed during the 53 days of programming he completed. Some of Avik’s entries really stood out, and I particularly liked his educational infographics:
Just look at the wonderful design and visual aids on this decision tree for dummies infographic, pseudocode and all:
Day 23: Decision trees for dummies. This just looks fabulous right?!
Although Avik didn’t seem to have completed the full 100 days, many others did.
Data visualization
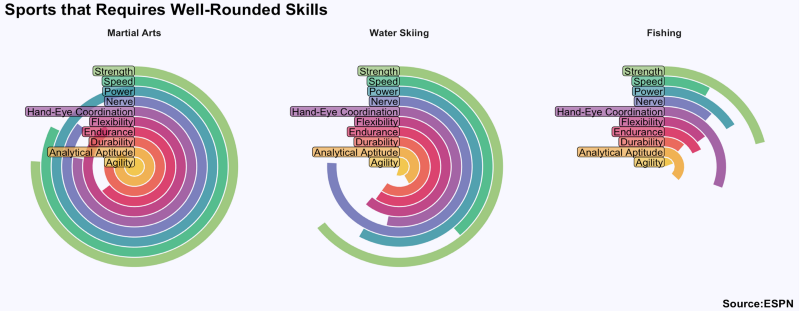
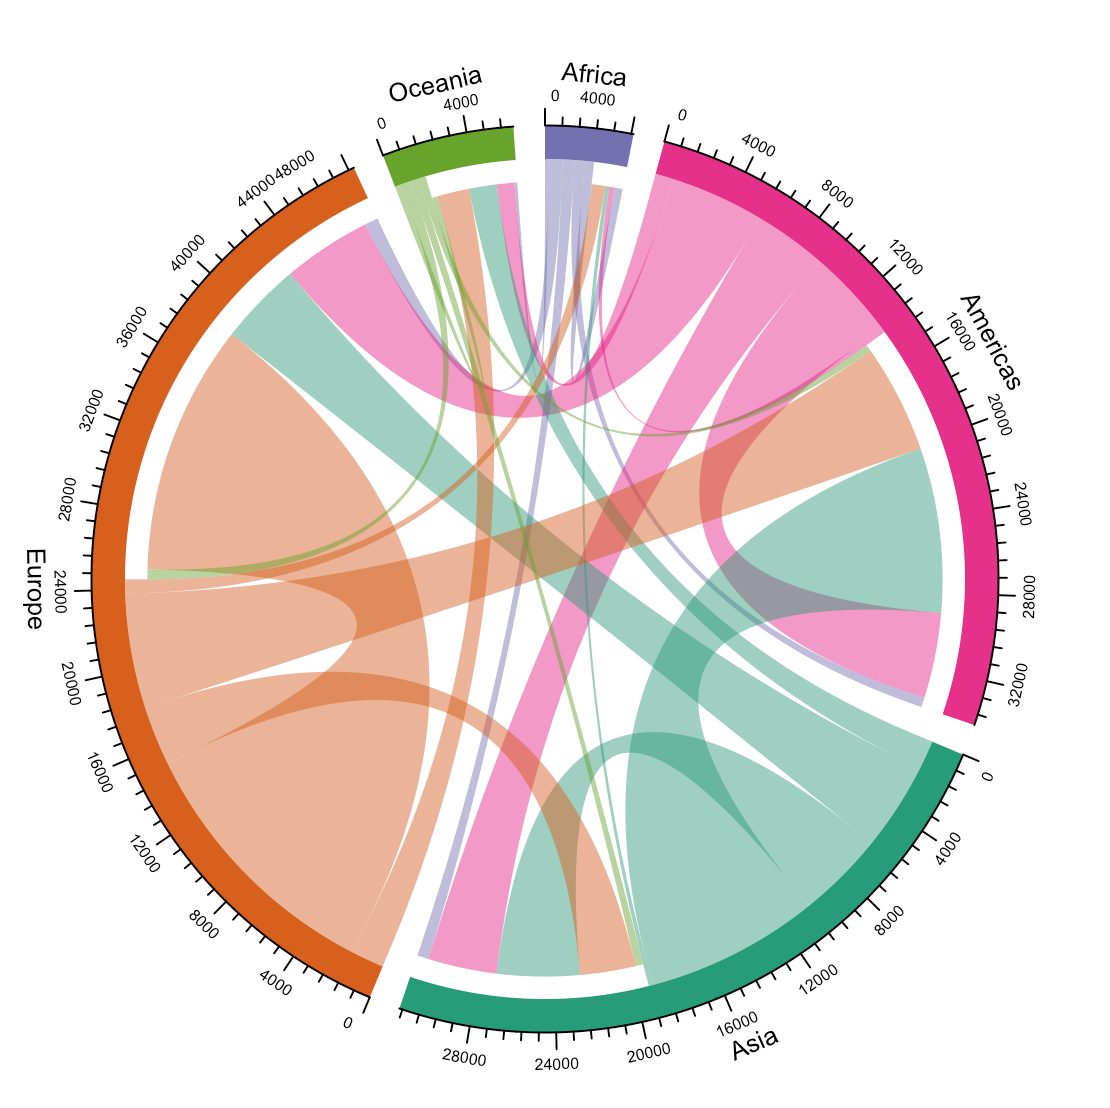
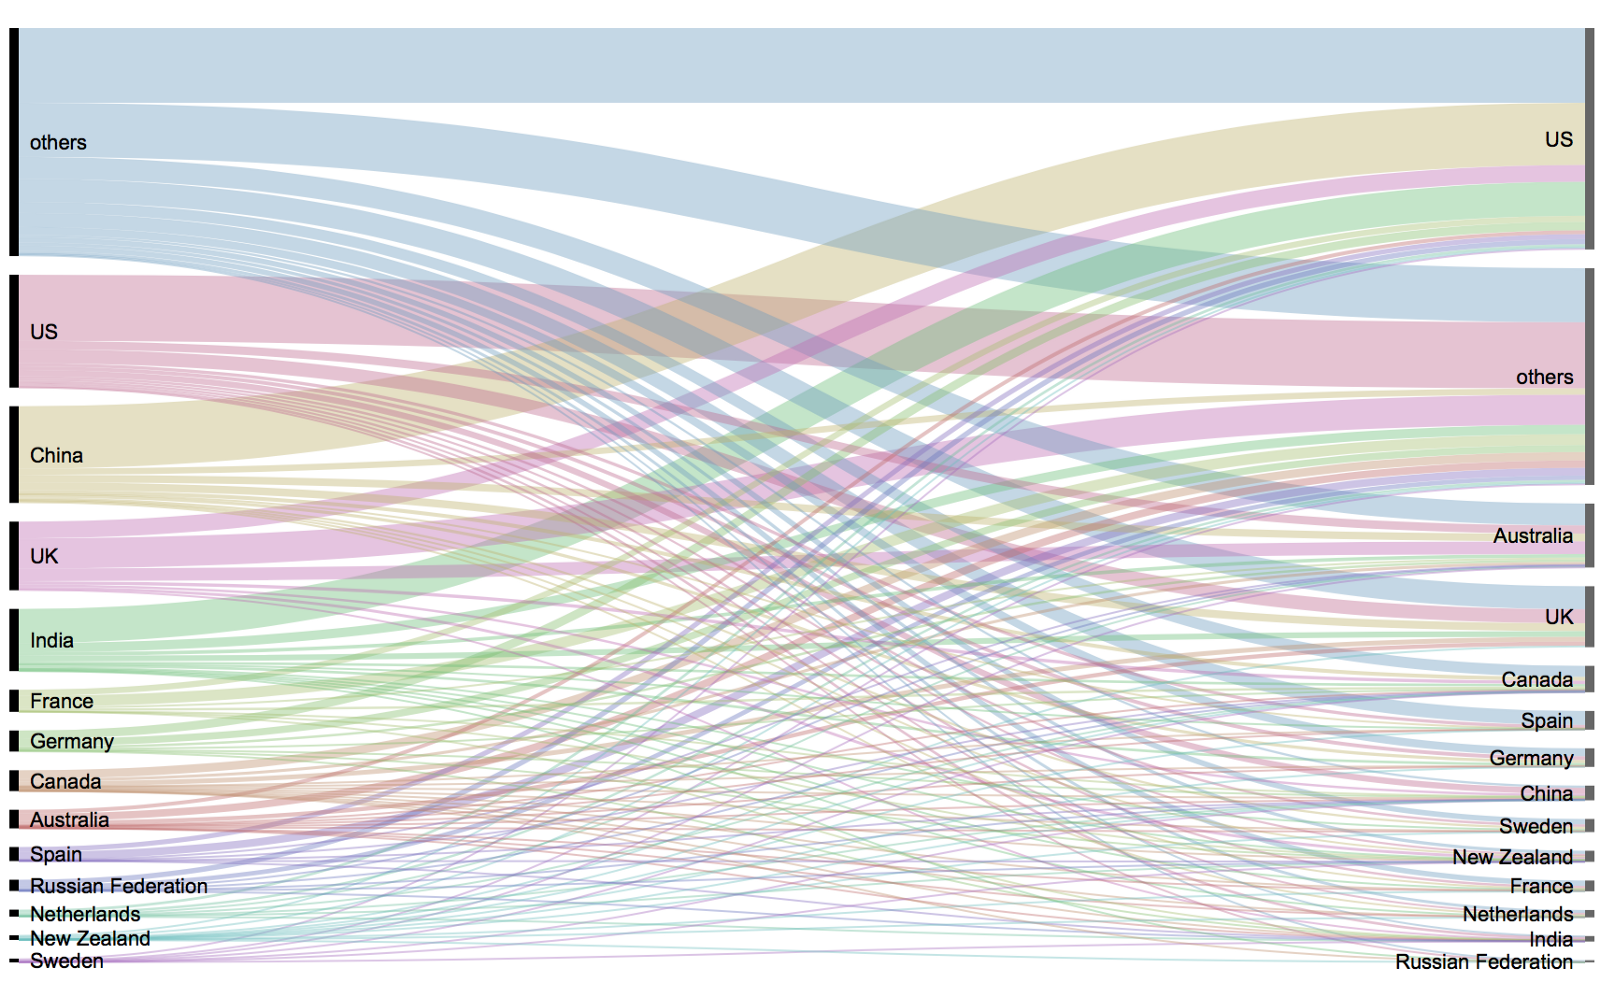
I have blogged about Hannah Yan Han‘s 100 days of code project before, but she definately deserves another mention here. Her 100 days revolved around data science, data visualization, and storytelling using both R and Python. You can find her #100DaysOfCode Medium page here, and her associated Github repository here.
For example, one day Hannah explored where instant noodles come from, how they are served, and whether people like them or not.
What I found so great about Hannah’s project is that she picked a novel dataset every couple of days. Moreover, she used a extremely large variety of different visualization formats. All visuals were equally beautiful, but Hannah made sure to pick the right one for the purpose she was trying to serve. If you are interested in data visualization, you seriously should check out Hannah’s 100DaysOfCode Medium page.
ungeviz is a new R package by Claus Wilke, whom you may know from his amazing work and books on Data Visualization. The package name comes from the German word “Ungewissheit”, which means uncertainty. You can install the developmental version via:
devtools::install_github("clauswilke/ungeviz")
The package includes some bootstrapping functionality that, when combined with ggplot2 and gganimate, can produce some seriousy powerful visualizations. For instance, take the below piece of code:
data(BlueJays, package="Stat2Data")
# set up bootstrapping object that generates 20 bootstraps# and groups by variable `KnownSex`bs<-ungeviz::bootstrapper(20, KnownSex)
ggplot(BlueJays, aes(BillLength, Head, color=KnownSex)) +
geom_smooth(method="lm", color=NA) +
geom_point(alpha=0.3) +# `.row` is a generated column providing a unique row number# to all rows in the bootstrapped data frame
geom_point(data=bs, aes(group= .row)) +
geom_smooth(data=bs, method="lm", fullrange=TRUE, se=FALSE) +
facet_wrap(~KnownSex, scales="free_x") +
scale_color_manual(values= c(F="#D55E00", M="#0072B2"), guide="none") +
theme_bw() +
transition_states(.draw, 1, 1) +
enter_fade() +
exit_fade()
Here’s what’s happening:
Claus loads in the BlueJays dataset, which contains some data on birds.
He then runs the ungezviz::bootstrapper function to generate a new dataset of bootstrapped samples.
Next, Claus uses ggplot2::geom_smooth(method = "lm") to run a linear model on the orginal BlueJays dataset, but does not color in the regression line (color = NA), thus showing only the confidence interval of the model.
Moreover, Claus uses ggplot2::geom_point(alpha = 0.3) to visualize the orginal data points, but slightly faded.
Subsequent, for each of the bootstrapped samples (group = .row), Claus again draws the data points (unfaded), and runs linear models while drawing only the regression line (se = FALSE).
Using ggplot2::facet_wrap, Claus seperates the data for BlueJays$KnownSex.
Using gganimate::transition_states(.draw, 1, 1), Claus prints each linear regression line to a row of the bootstrapped dataset only one second, before printing the next.
The result an astonishing GIF of the regression lines that could be fit to bootstrapped subsamples of the BlueJays data, along with their confidence interval:
One example of the practical use of ungeviz, original on its GitHub page
Another valuable use of the new package is the visualization of uncertainty from fitted models, for example as confidence strips. The below code shows the powerful combination of broom::tidy with ungeviz::stat_conf_strip to visualize effect size estimates of a linear model along with their confidence intervals.
library(broom)
#> #> Attaching package: 'broom'#> The following object is masked from 'package:ungeviz':#> #> bootstrapdf_model<- lm(mpg~disp+hp+qsec, data=mtcars) %>%
tidy() %>%
filter(term!="(Intercept)")
ggplot(df_model, aes(estimate=estimate, moe=std.error, y=term)) +
stat_conf_strip(fill="lightblue", height=0.8) +
geom_point(aes(x=estimate), size=3) +
geom_errorbarh(aes(xmin=estimate-std.error, xmax=estimate+std.error), height=0.5) +
scale_alpha_identity() +
xlim(-2, 1)
Visualizing effect size estimates with ungeviz, via its GitHub page
Very curious to see where this package develops into. What use cases can you think of?