Data types are one of those things that you don’t tend to care about until you get an error or some unexpected results. It is also one of the first things you should check once you load a new data into pandas for further analysis.
Chris Moffit
In this short tutorial, Chris shows how to the pandasdtypes map to the numpy and base Python data types.
Moreover, Chris demonstrates how to handle and convert data types so you can speed up your data analysis. Both using custom functions and anonymous lambda functions.
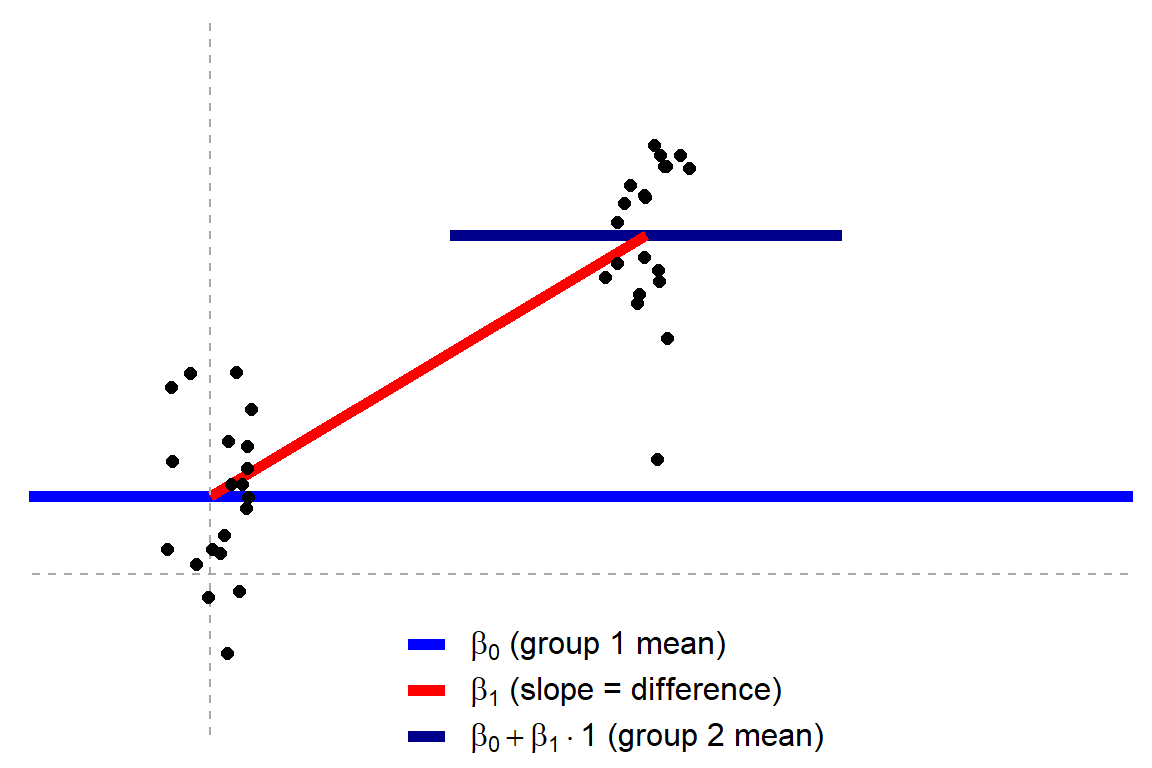
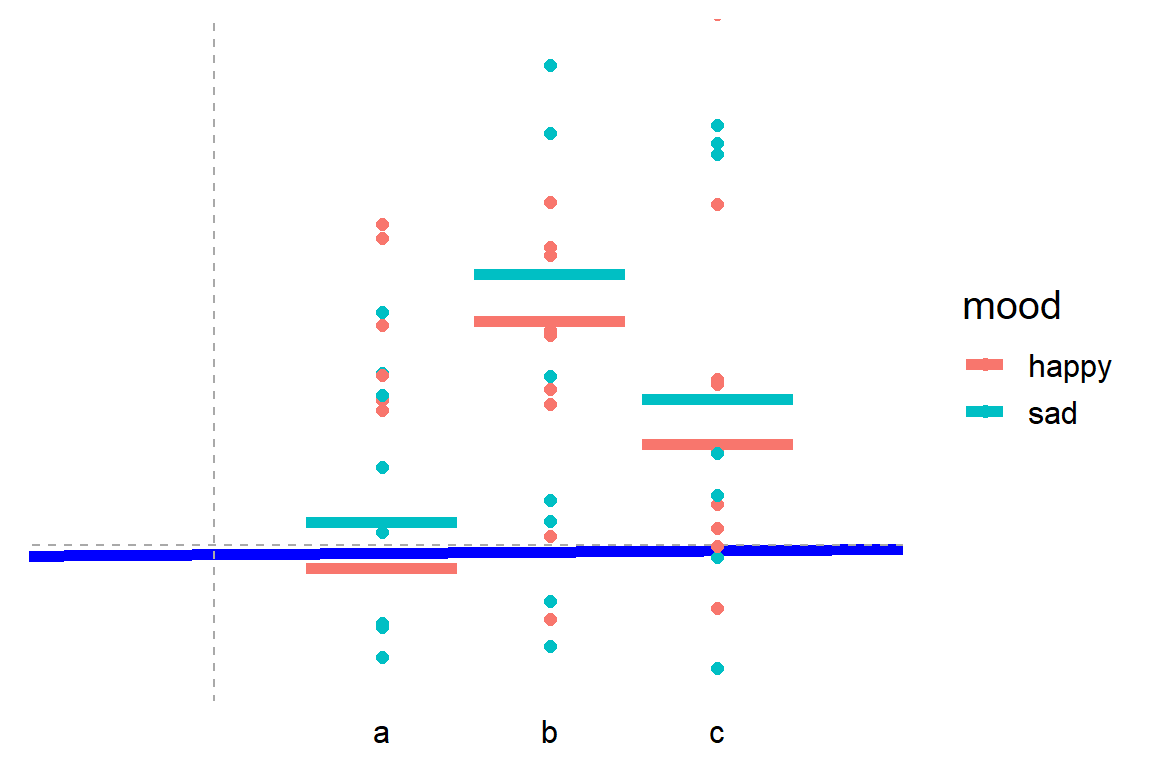
Jonas’ original blog uses R programming to visually show how the tests work, what the linear models look like, and how different approaches result in the same statistics.
Kevin Markham shares his tips and tricks for the most common data handling tasks on twitter. He compiled the top 100 in this one amazing overview page. Find the hyperlinks to specific sections below!
🐼🤹♂️ pandas trick:
Want to plot a DataFrame? It's as easy as: df.plot(kind='…')
You can use: line 📈 bar 📊 barh hist box 📦 kde area scatter hexbin pie 🥧
By adjusting the three elements in this simple framework, you can build any type of machine learning program.
In the tutorial, Eric shows you how to implement this same framework in Python (using jax) and implement linear regression, logistic regression, and artificial neural networks all in the same way (using gradient descent).
I can’t even begin to explain it as well as Eric does himself, so I highly recommend you watch and code along with the Youtube tutorial (~1 hour):
Have you ever wondered what goes on behind the scenes of a deep learning framework? Or what is going on behind that pre-trained model that you took from Kaggle? Then this tutorial is for you! In this tutorial, we will demystify the internals of deep learning frameworks – in the process equipping us with foundational knowledge that lets us understand what is going on when we train and fit a deep learning model. By learning the foundations without a deep learning framework as a pedagogical crutch, you will walk away with foundational knowledge that will give you the confidence to implement any model you want in any framework you choose.
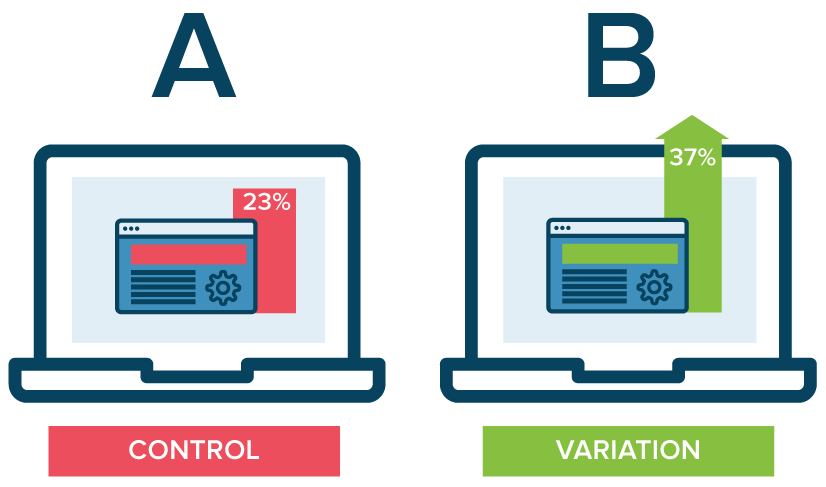
A/B testing is a method of comparing two versions of some thing against each other to determine which is better. A/B tests are often mentioned in e-commerce contexts, where the things we are comparing are web pages.
Business leaders and data scientists alike face a difficult trade-off when running A/B tests: How big should the A/B test be? Or in other words, After collecting how many data points, or running for how many days, should we make a decision whether A or B is the best way to go?
This is a tradeoff because the sample size of an A/B test determines its statistical power. This statistical power, in simple terms, determines the probability of a A/B test showing an effect if there is actually really an effect. In general, the more data you collect, the higher the odds of you finding the real effect and making the right decision.
By default, researchers often aim for 80% power, with a 5% significance cutoff. But is this general guideline really optimal for the tradeoff between costs and benefits in your specific business context? Chris thinks not.
Chris said wrote a great three-piece blog in which he explains how you can mathematically determine the optimal duration of A/B-testing in your own company setting:
Part I: General Overview. Starts with a mostly non-technical overview and ends with a section called “Three lessons for practitioners”.
Part II: Expected lift. A more technical section that quantifies the benefits of experimentation as a function of sample size.
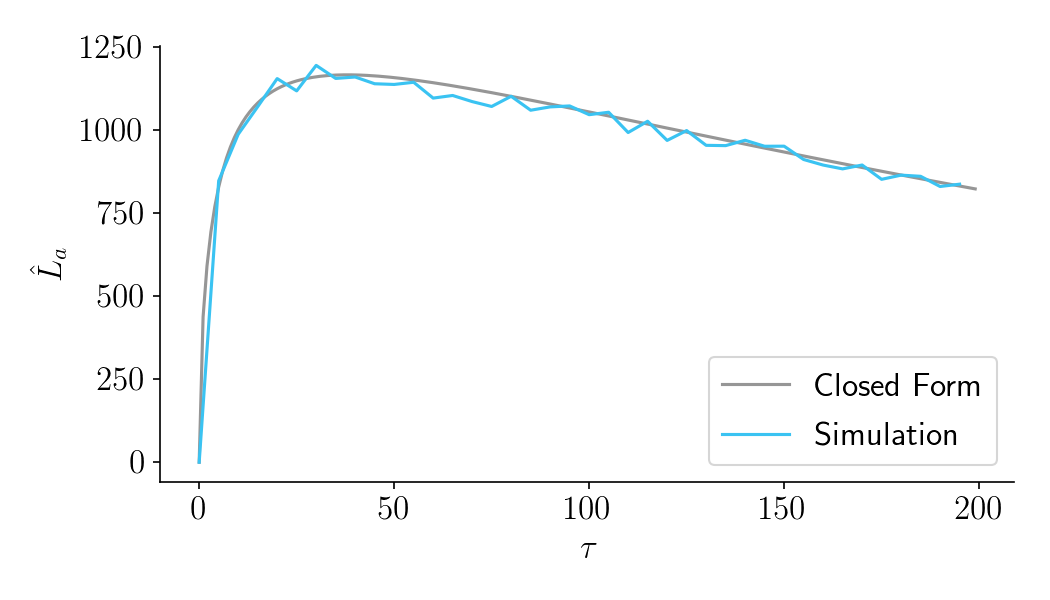
Part III: Aggregate time-discounted lift. A more technical section that quantifies the costs of experimentation as a function of sample size. It then combines costs and benefits into a closed-form expression that can be optimized. Ends with an FAQ.
Several Chinese Ph.D. students wrote a PyTorch program that can turn your holiday pictures into 3D sceneries. They call it 3D photo inpainting. Here are some examples
And here’s the new method compares to previous techniques:
We propose a method for converting a single RGB-D input image into a 3D photo, i.e., a multi-layer representation for novel view synthesis that contains hallucinated color and depth structures in regions occluded in the original view. We use a Layered Depth Image with explicit pixel connectivity as underlying representation, and present a learning-based inpainting model that iteratively synthesizes new local color-and-depth content into the occluded region in a spatial context-aware manner. The resulting 3D photos can be efficiently rendered with motion parallax using standard graphics engines. We validate the effectiveness of our method on a wide range of challenging everyday scenes and show fewer artifacts when compared with the state-of-the-arts.


