Last week, this interesting reddit thread was filled with overviews for cool projects that may help you learn a programming language. The top entries are:
Amy’s list includes many references to the best practices used by some of the leading data journalism companies, such as the BBC, or professional data companies like Salesforce and IBM.
As I’m worried that this great repository may not stand the test of time on the current Google Docs location, here are the base URLs once more:
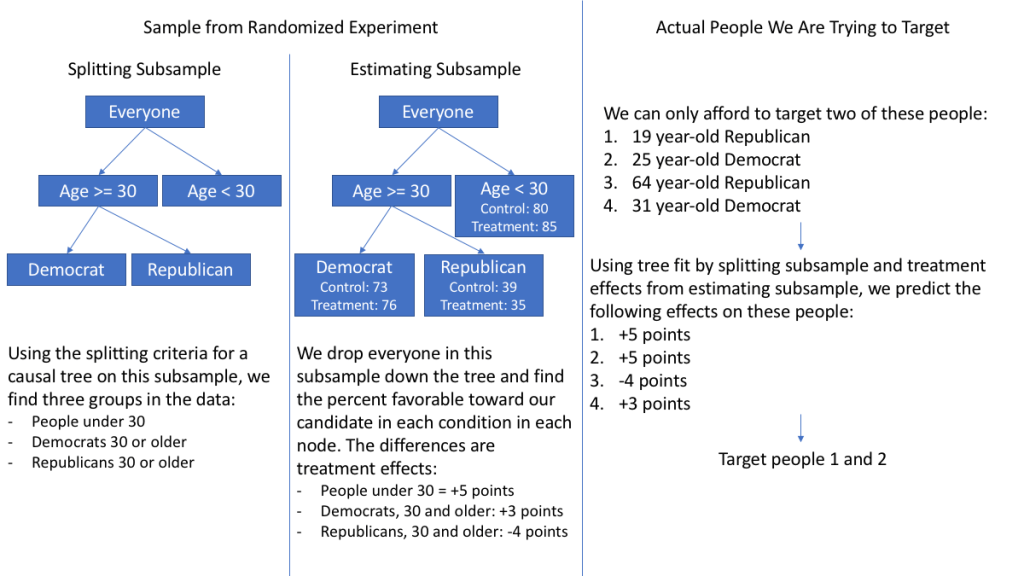
I stumbled accros this incredibly interesting read by Mark White, who discusses the (academic) theory behind, inner workings, and example (R) applications of causal random forests:
These so-called “honest” forests seem a great technique to identify opportunities for personalized actions: think of marketing, HR, medicine, healthcare, and other personalized recommendations. Note that an experimental setup for data collection is still necessary to gather the right data for these techniques.
Since 1988, the Royal Society has celebrated outstanding popular science writing and authors.
Each year, a panel of expert judges choose the book that they believe makes popular science writing compelling and accessible to the public.
Over the decades, the Prize has celebrated some notable winners including Bill Bryson and Stephen Hawking.
The author of the winning book receives £25,000 and £2,500 is awarded to each of the five shortlisted books. And this year’s shortlist includes some definite must-reads on data and statistics!
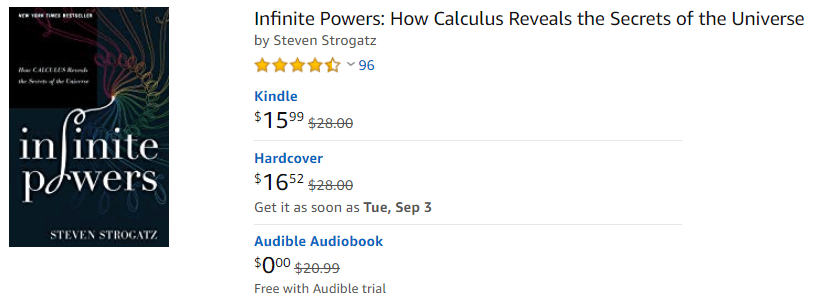
The captivating story of mathematics’ greatest ever idea: calculus. Without it, there would be no computers, no microwave ovens, no GPS, and no space travel. But before it gave modern man almost infinite powers, calculus was behind centuries of controversy, competition, and even death.
Taking us on a thrilling journey through three millennia, Professor Steven Strogatz charts the development of this seminal achievement, from the days of Archimedes to today’s breakthroughs in chaos theory and artificial intelligence. Filled with idiosyncratic characters from Pythagoras to Fourier, Infinite Powers is a compelling human drama that reveals the legacy of calculus in nearly every aspect of modern civilisation, including science, politics, medicine, philosophy, and more.
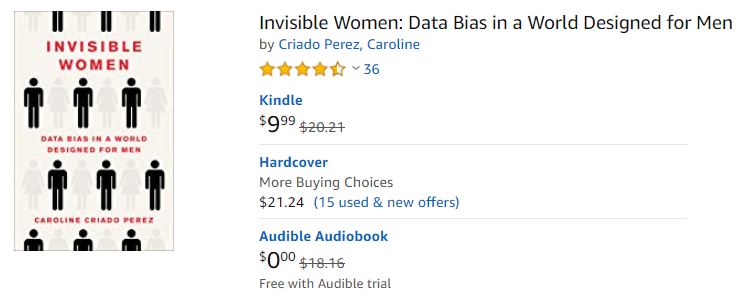
Imagine a world where your phone is too big for your hand, where your doctor prescribes a drug that is wrong for your body, where in a car accident you are 47% more likely to be seriously injured, where every week the countless hours of work you do are not recognised or valued. If any of this sounds familiar, chances are that you’re a woman.
Invisible Women shows us how, in a world largely built for and by men, we are systematically ignoring half the population. It exposes the gender data gap–a gap in our knowledge that is at the root of perpetual, systemic discrimination against women, and that has created a pervasive but invisible bias with a profound effect on women’s lives. From government policy and medical research, to technology, workplaces, urban planning and the media, Invisible Women reveals the biased data that excludes women.
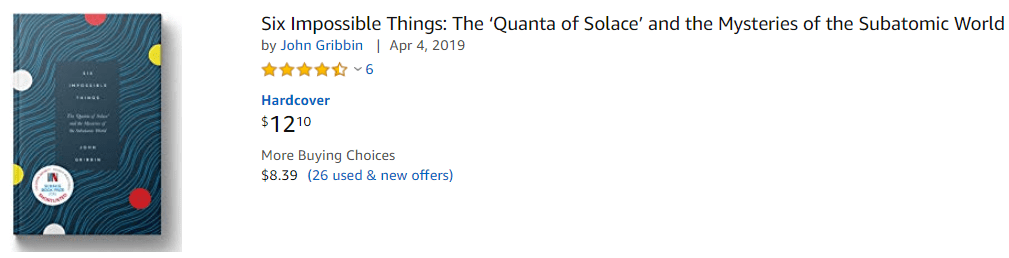
This book does not deal with data or statistics specifically, but might even be more interesting, as it covers the topic of quantum physics:
Quantum physics is strange. It tells us that a particle can be in two places at once. That particle is also a wave, and everything in the quantum world can be described entirely in terms of waves, or entirely in terms of particles, whichever you prefer.
All of this was clear by the end of the 1920s, but to the great distress of many physicists, let alone ordinary mortals, nobody has ever been able to come up with a common sense explanation of what is going on. Physicists have sought ‘quanta of solace’ in a variety of more or less convincing interpretations.
This short guide presents us with the six theories that try to explain the wild wonders of quantum. All of them are crazy, and some are crazier than others, but in this world crazy does not necessarily mean wrong, and being crazier does not necessarily mean more wrong.
Lars Albertsson, former software engineer at Spotify and Google and currently freelance data engineer via mapflat, maintains this list of data engineering resources. It includes many links to videos and courses about data pipelines, batch processing, Kafka, NoSQL, Clojure, Scala, Parquet, Luigi, Storm, Spark, Hadoop, Cassandra, and other tools I am not too familiar with. Looks like it could function as a great curated overview for starters.
Jared Wilber posted this great walkthrough where he codes a simple R data pipeline using purrr and tidyr to train a large variety of models and methods on the same base data, all in a non-repetitive, reproducible, clean, and thus tidy fashion. Really impressive workflow!