Thanks to Sebastian Raschka I am able to share this great GitHub overview page of relevant graph classification techniques, and the scientific papers behind them. The overview divides the algorithms into four groups:
As well as a link to relevant graph classification benchmark datasets.
"Awesome Graph Classification" — A collection of graph classification methods, covering embedding, deep learning, graph kernel, and factorization papers with reference implementations https://t.co/ugpL3xSvf1
I’ve seen some uses of reinforcement learning and generative algorithms for architectural purposes already, like these evolving blueprints for school floorplans. However, this new application called ArchiGAN blew me away!
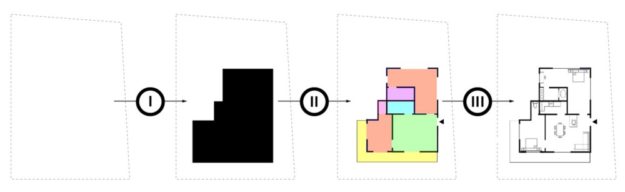
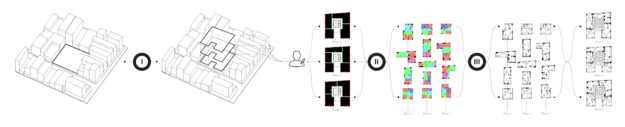
ArchiGAN (try here) was made by Stanislas Chaillou as a Harvard master’s thesis project. The program functions in three steps:
building footprint massing
program repartition
furniture layout
Stanislas’ three generation steps
Each of these three steps uses a TensorFlow Pix2Pix GAN-model (Christopher Hesse’s implementation) in the back-end, and their combination makes for a entire apartment building “generation stack” — according to Stanislas — which also allows for user input at each step.
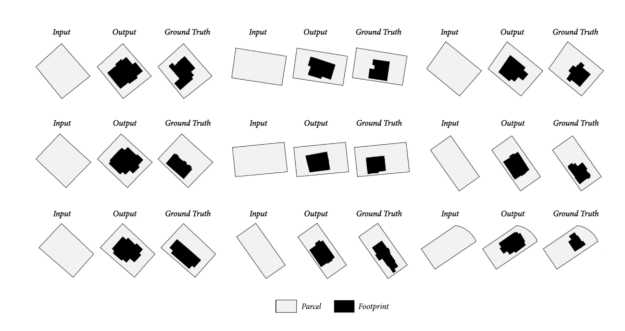
The design of a building can be inferred from the piece of land it stands on. Hence, Stanislas fed his first model using GIS-data (Geographic Information System) from the city of Boston in order to generate typical footprints based on parcel shapes.
The inputs and outputs of model I
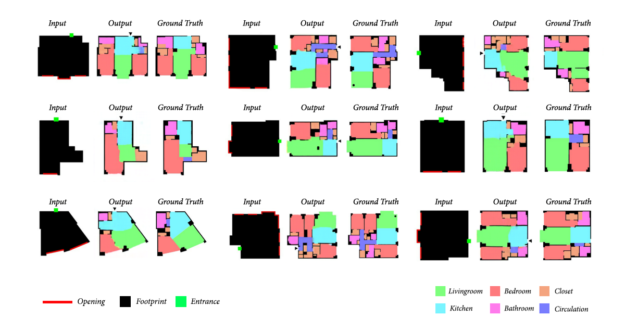
Stanislas’ second model was responsible for repartition and fenestration (the placement of windows and doors). This GAN took the footprint of the building (the output of model I) as input, along with the position of the entrance door (green square), and the positions of the user-specified windows.
Stanislas used a database of 800+ plans of apartments for training. To visualize the output, rooms are color-coded and walls and fenestration are blackened.
The inputs and outputs of model II
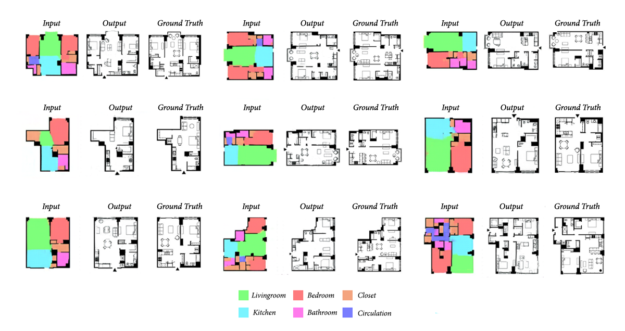
Finally, in the third model, the rooms are filled with appropriate furniture. What training data Stanislas has used here, he did not specify in the original blog.
The inputs and outputs of model III
Now, to put all things together, Stanislas created a great interactive tool you can play with yourself. The original NVIDEA blog contains some great GIFs of the tool being used:
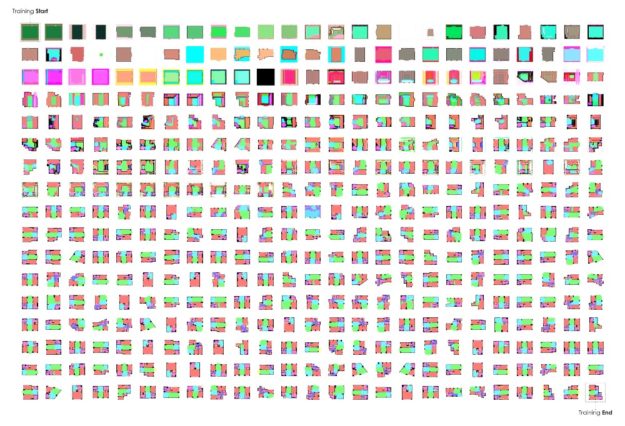
Stanislas’ GAN-models progressively learned to design rooms and realistically position doors and windows. It took about 250 iterations to get some realistic floorplans out of the algorithm. Here’s how an example learning sequence looked like:
Visualization of the training process
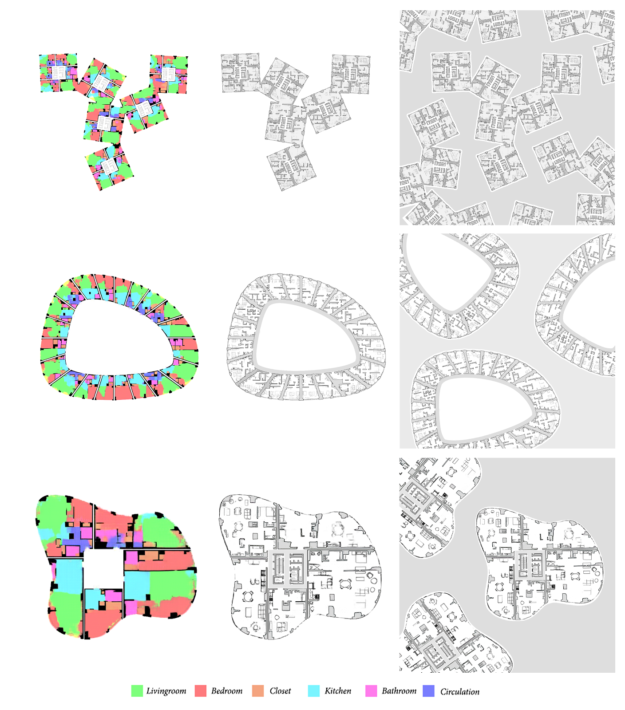
Now, Stanislas was not done yet. He also scaled the utilization of GANs to design whole apartment buildings. Here, he chains the models and processes multiple units as single images at each step.
Generating whole appartment blocks using ArchiGAN
Stanislas did other cool things to improve the flexibility of his ArchiGAN models, about which you can read more in the original blog. Let these visuals entice you to read more:
ArchiGAN scaled to handle whole appartment blocks and neighborhoods.
I believe a statistical approach to design conception will shape AI’s potential for Architecture. This approach is less deterministic and more holistic in character. Rather than using machines to optimize a set of variables, relying on them to extract significant qualities and mimicking them all along the design process represents a paradigm shift.
I am so psyched about these innovative applications of machine learning, so please help me give Stanislas the attention and credit he deserved.
Currently, Stanislas is Data Scientist & Architect at Spacemaker.ai. Read more about him in his NVIDEA developer bio here. He recently published a sequence of articles, laying down the premise of AI’s intersection with Architecture. Read here about the historical background behind this significant evolution, to be followed by AI’s potential for floor plan design, and for architectural style analysis & generation.
Most of my data visualizations I create using R programming — as you might have noticed from the content of my website.
Though I am colorblind myself, I love to work with colors and color palettes in my visualizations. And I’ve come across quite some neat tricks in my time.
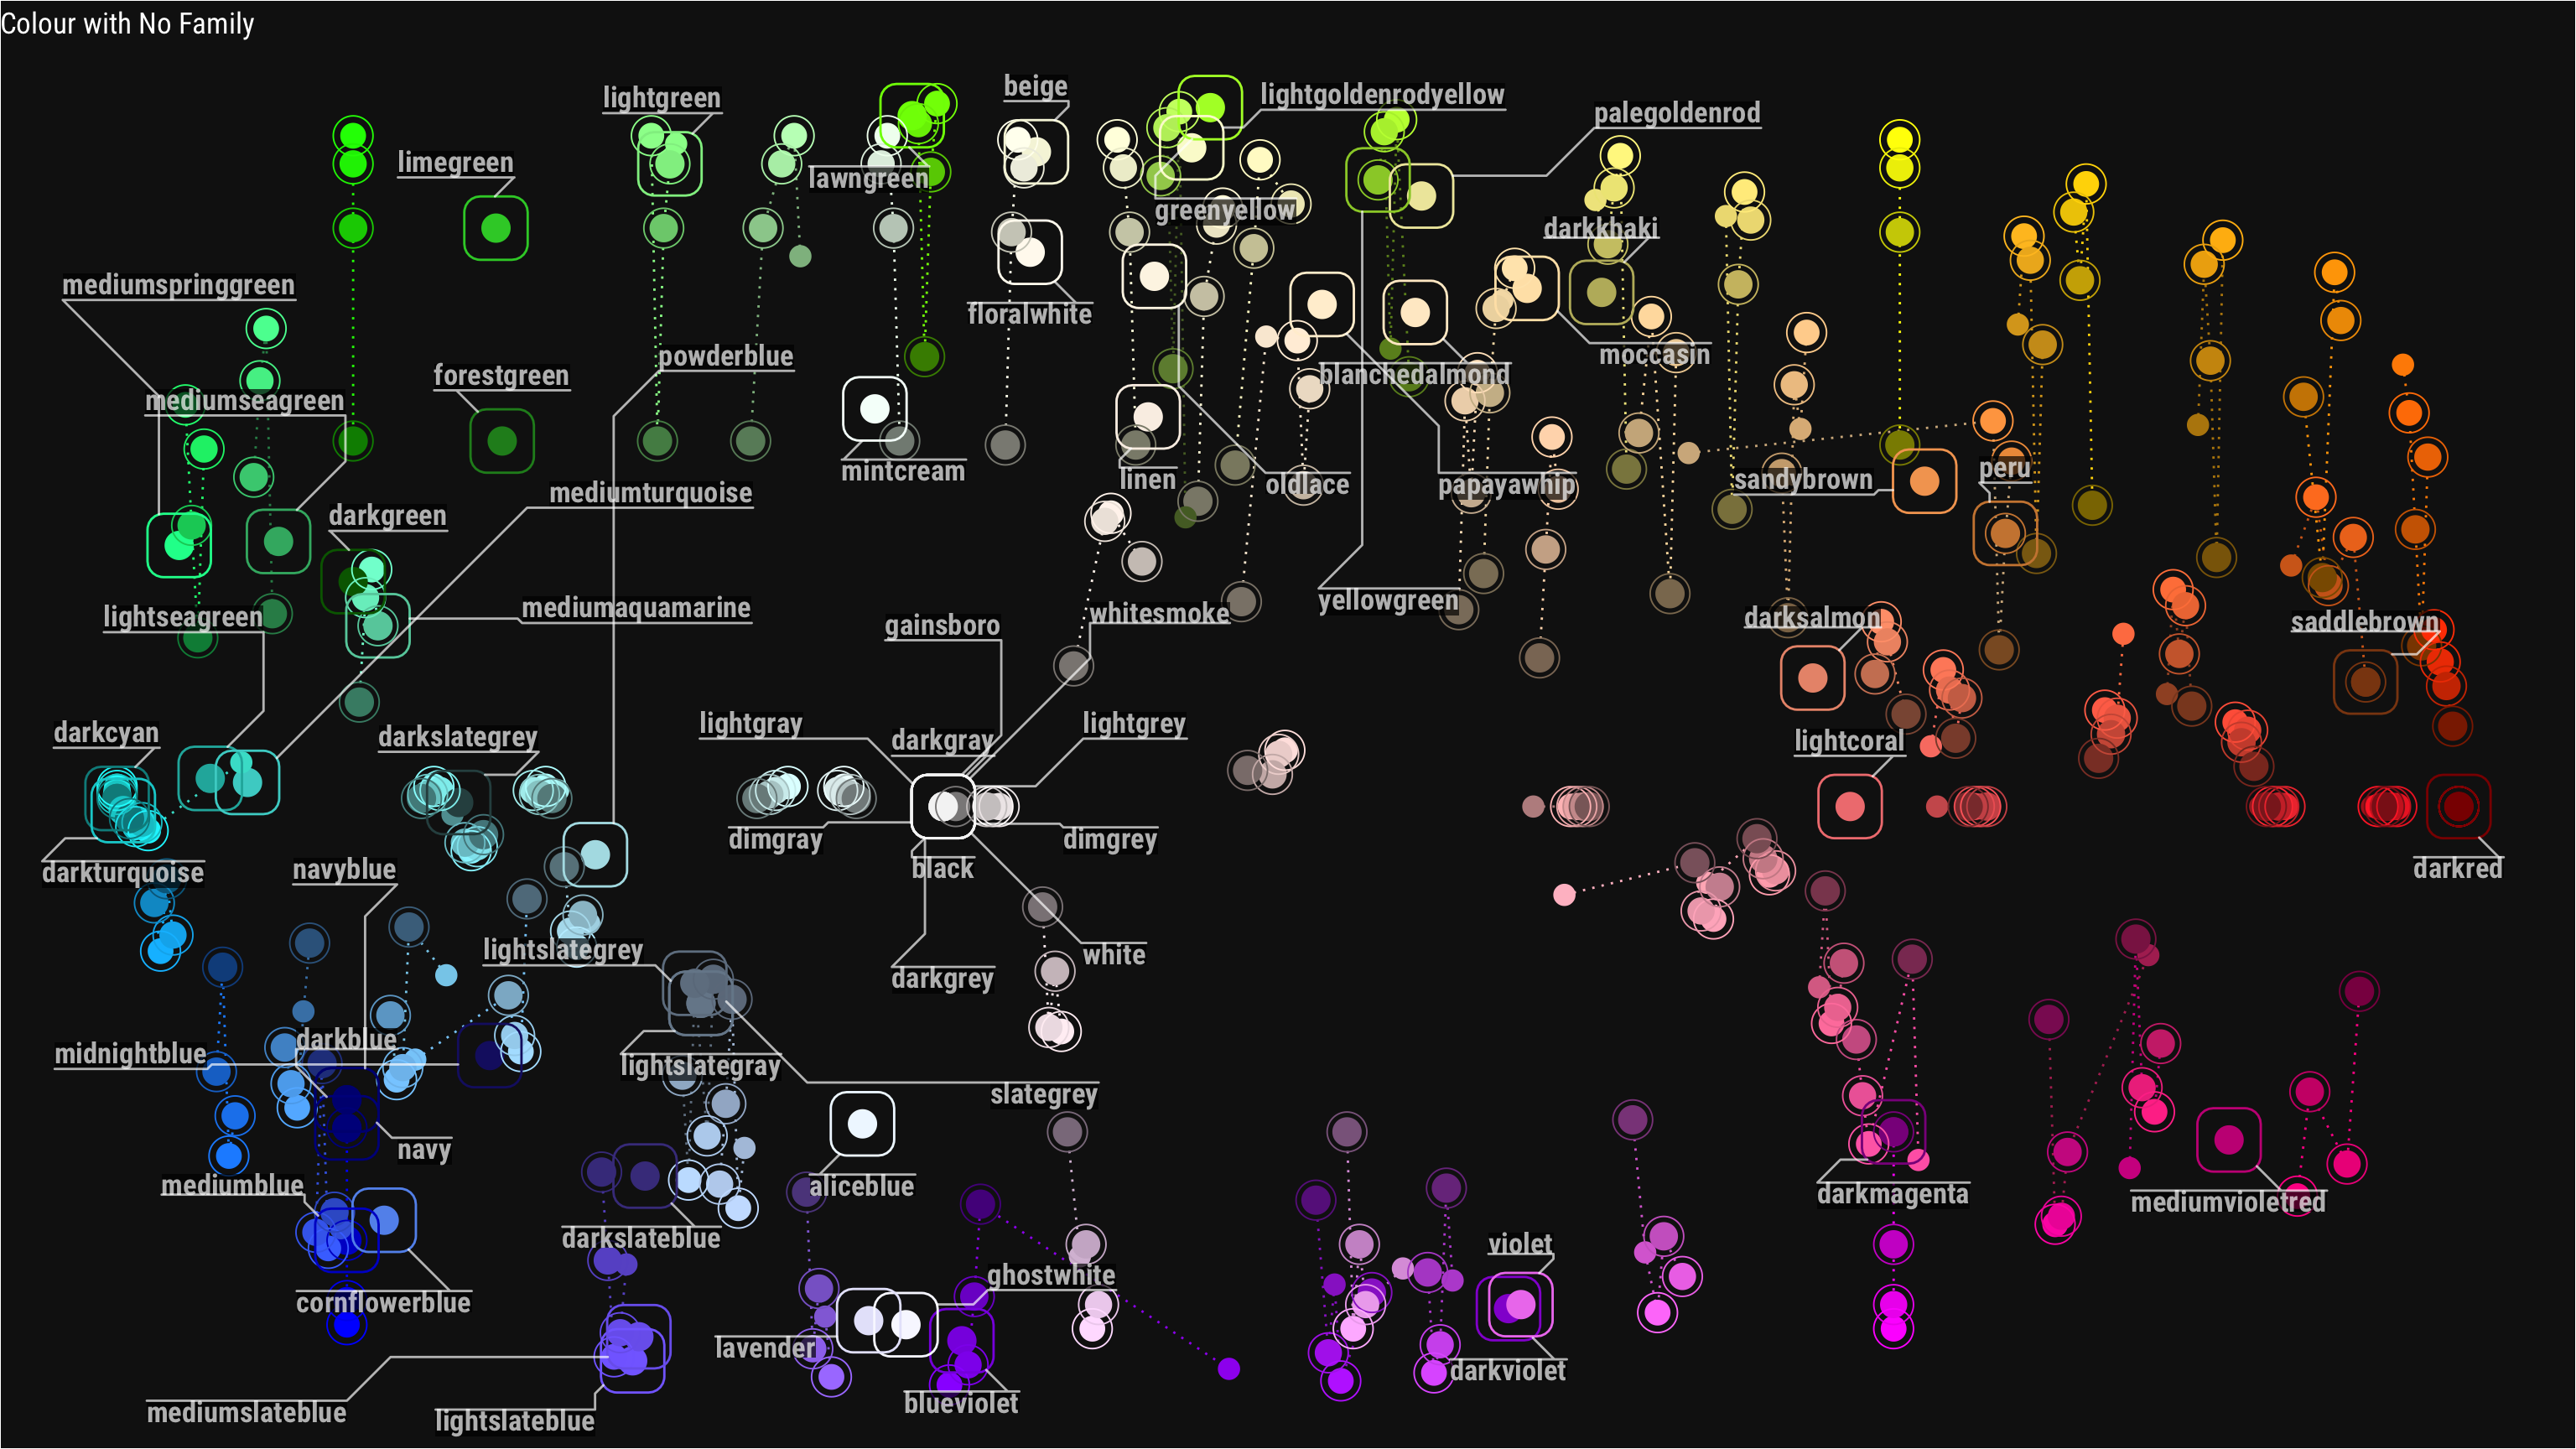
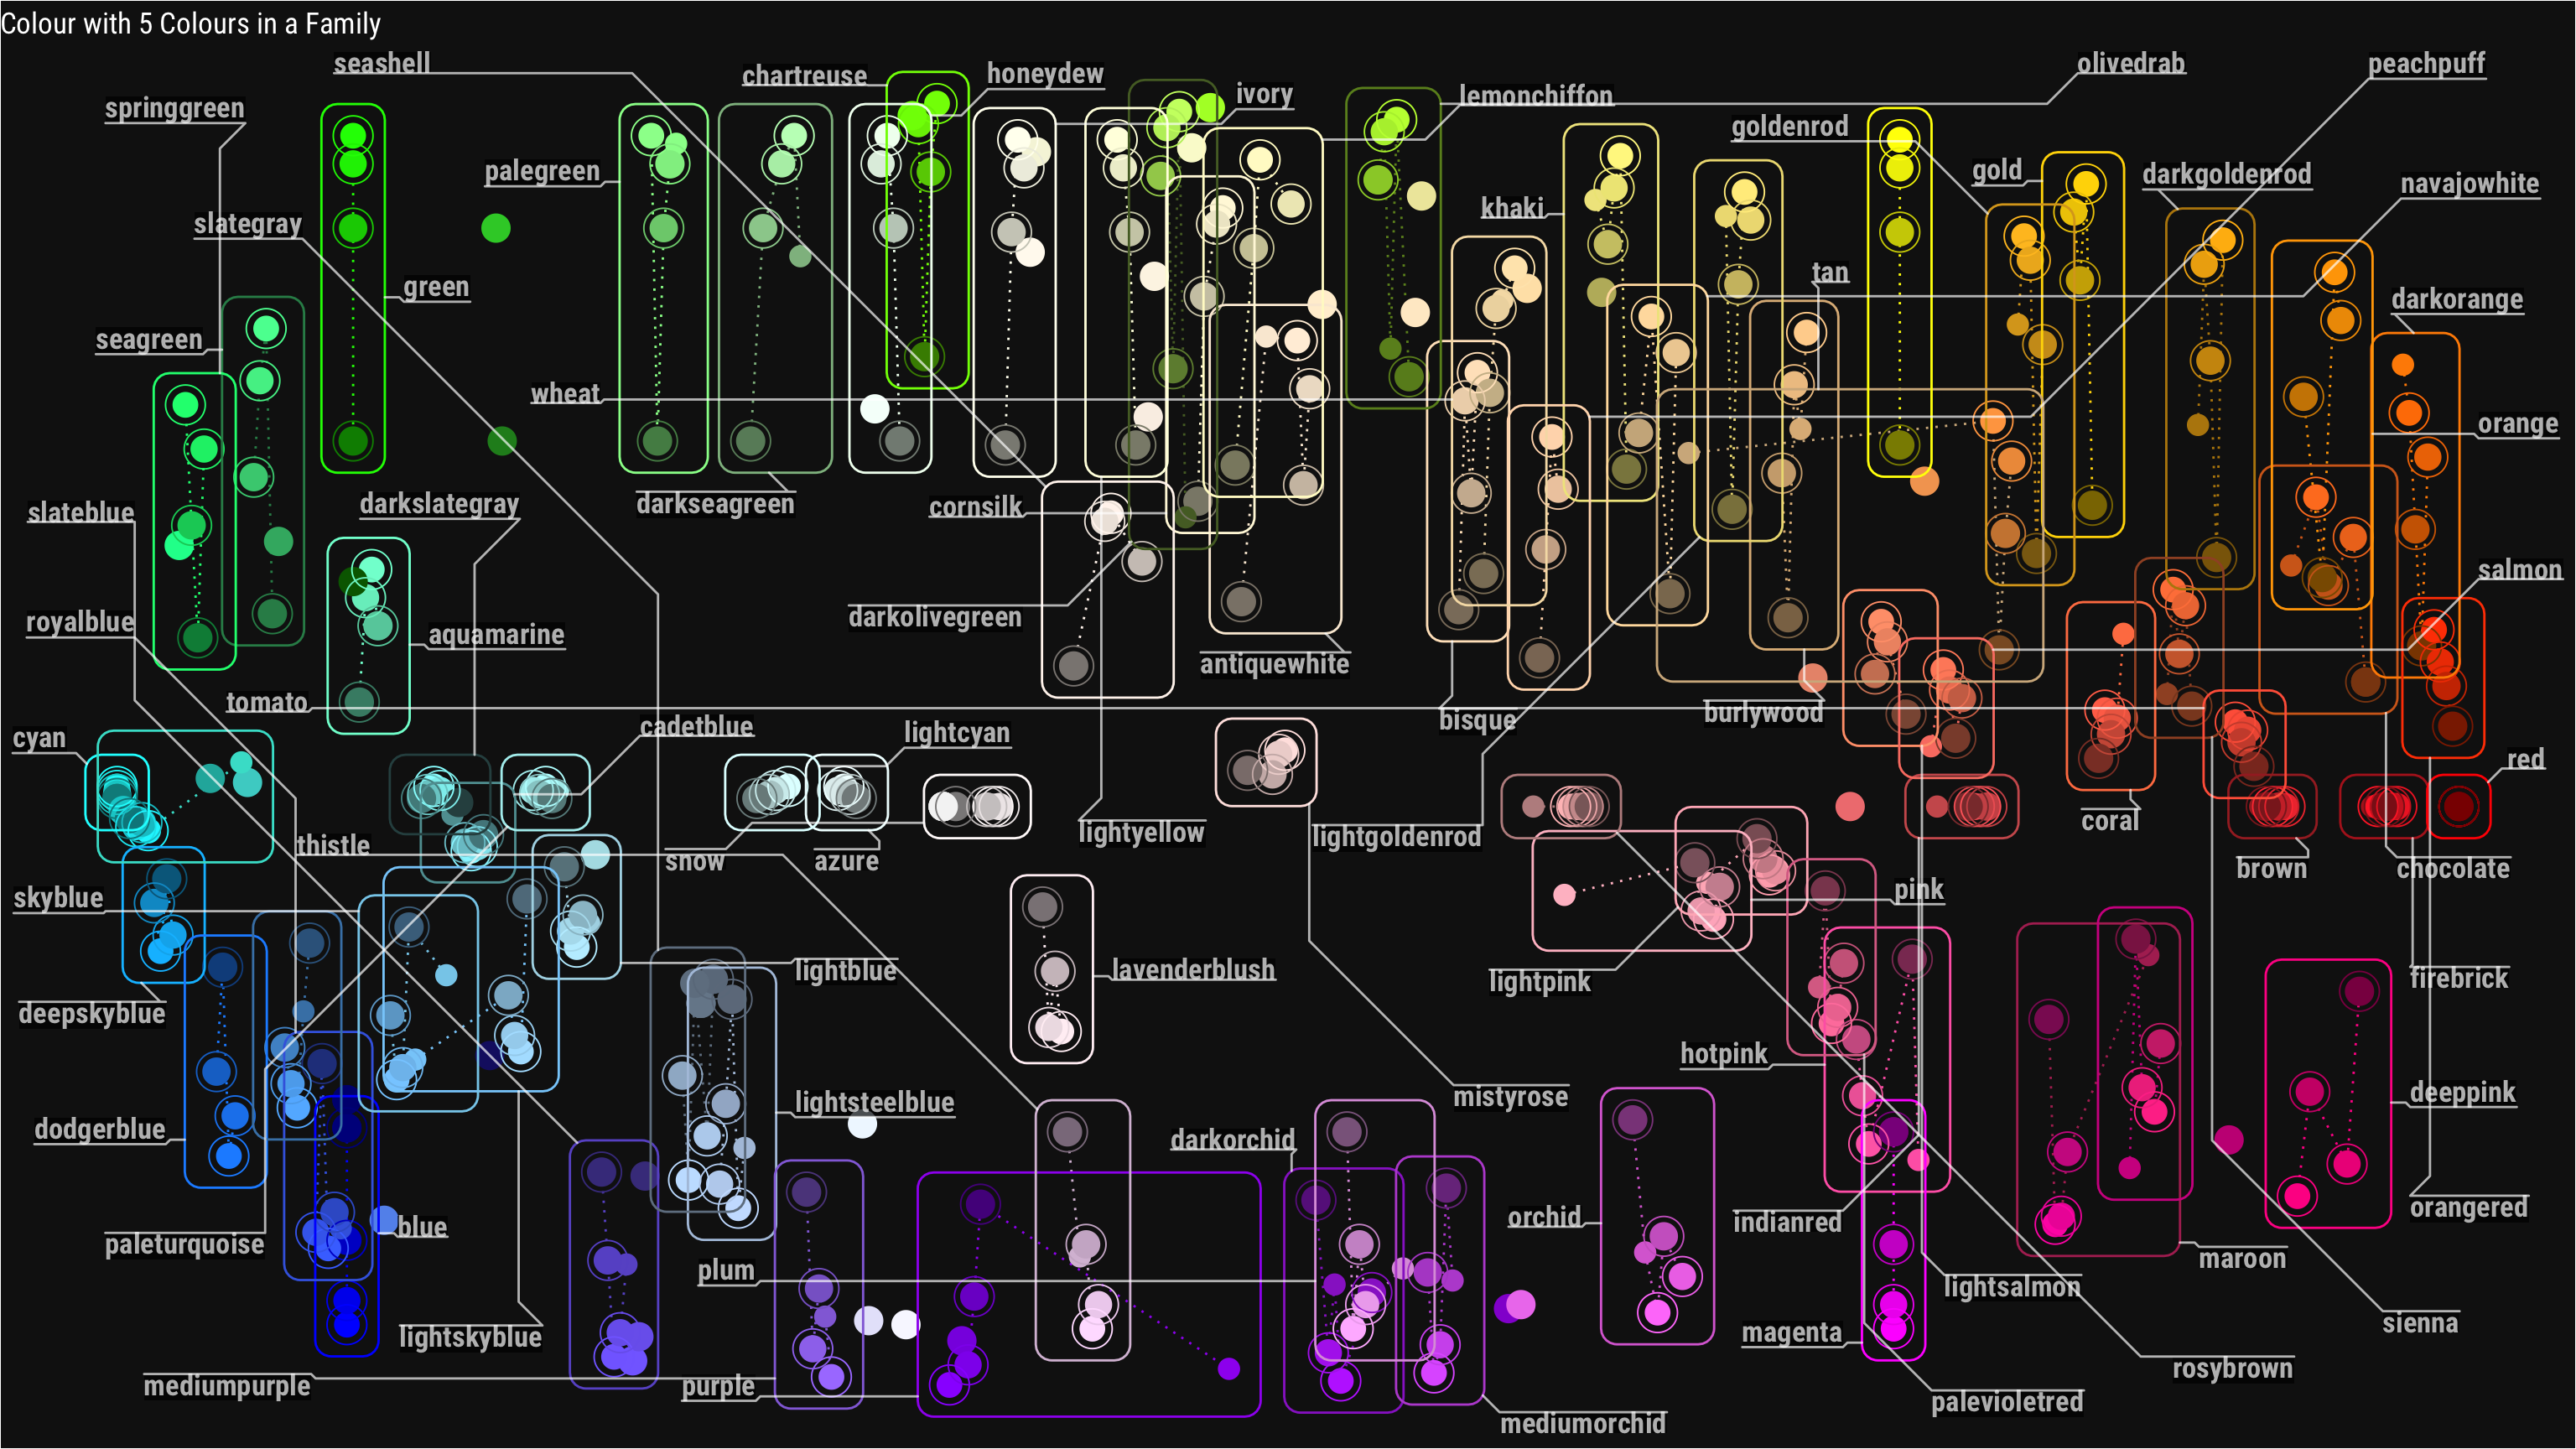
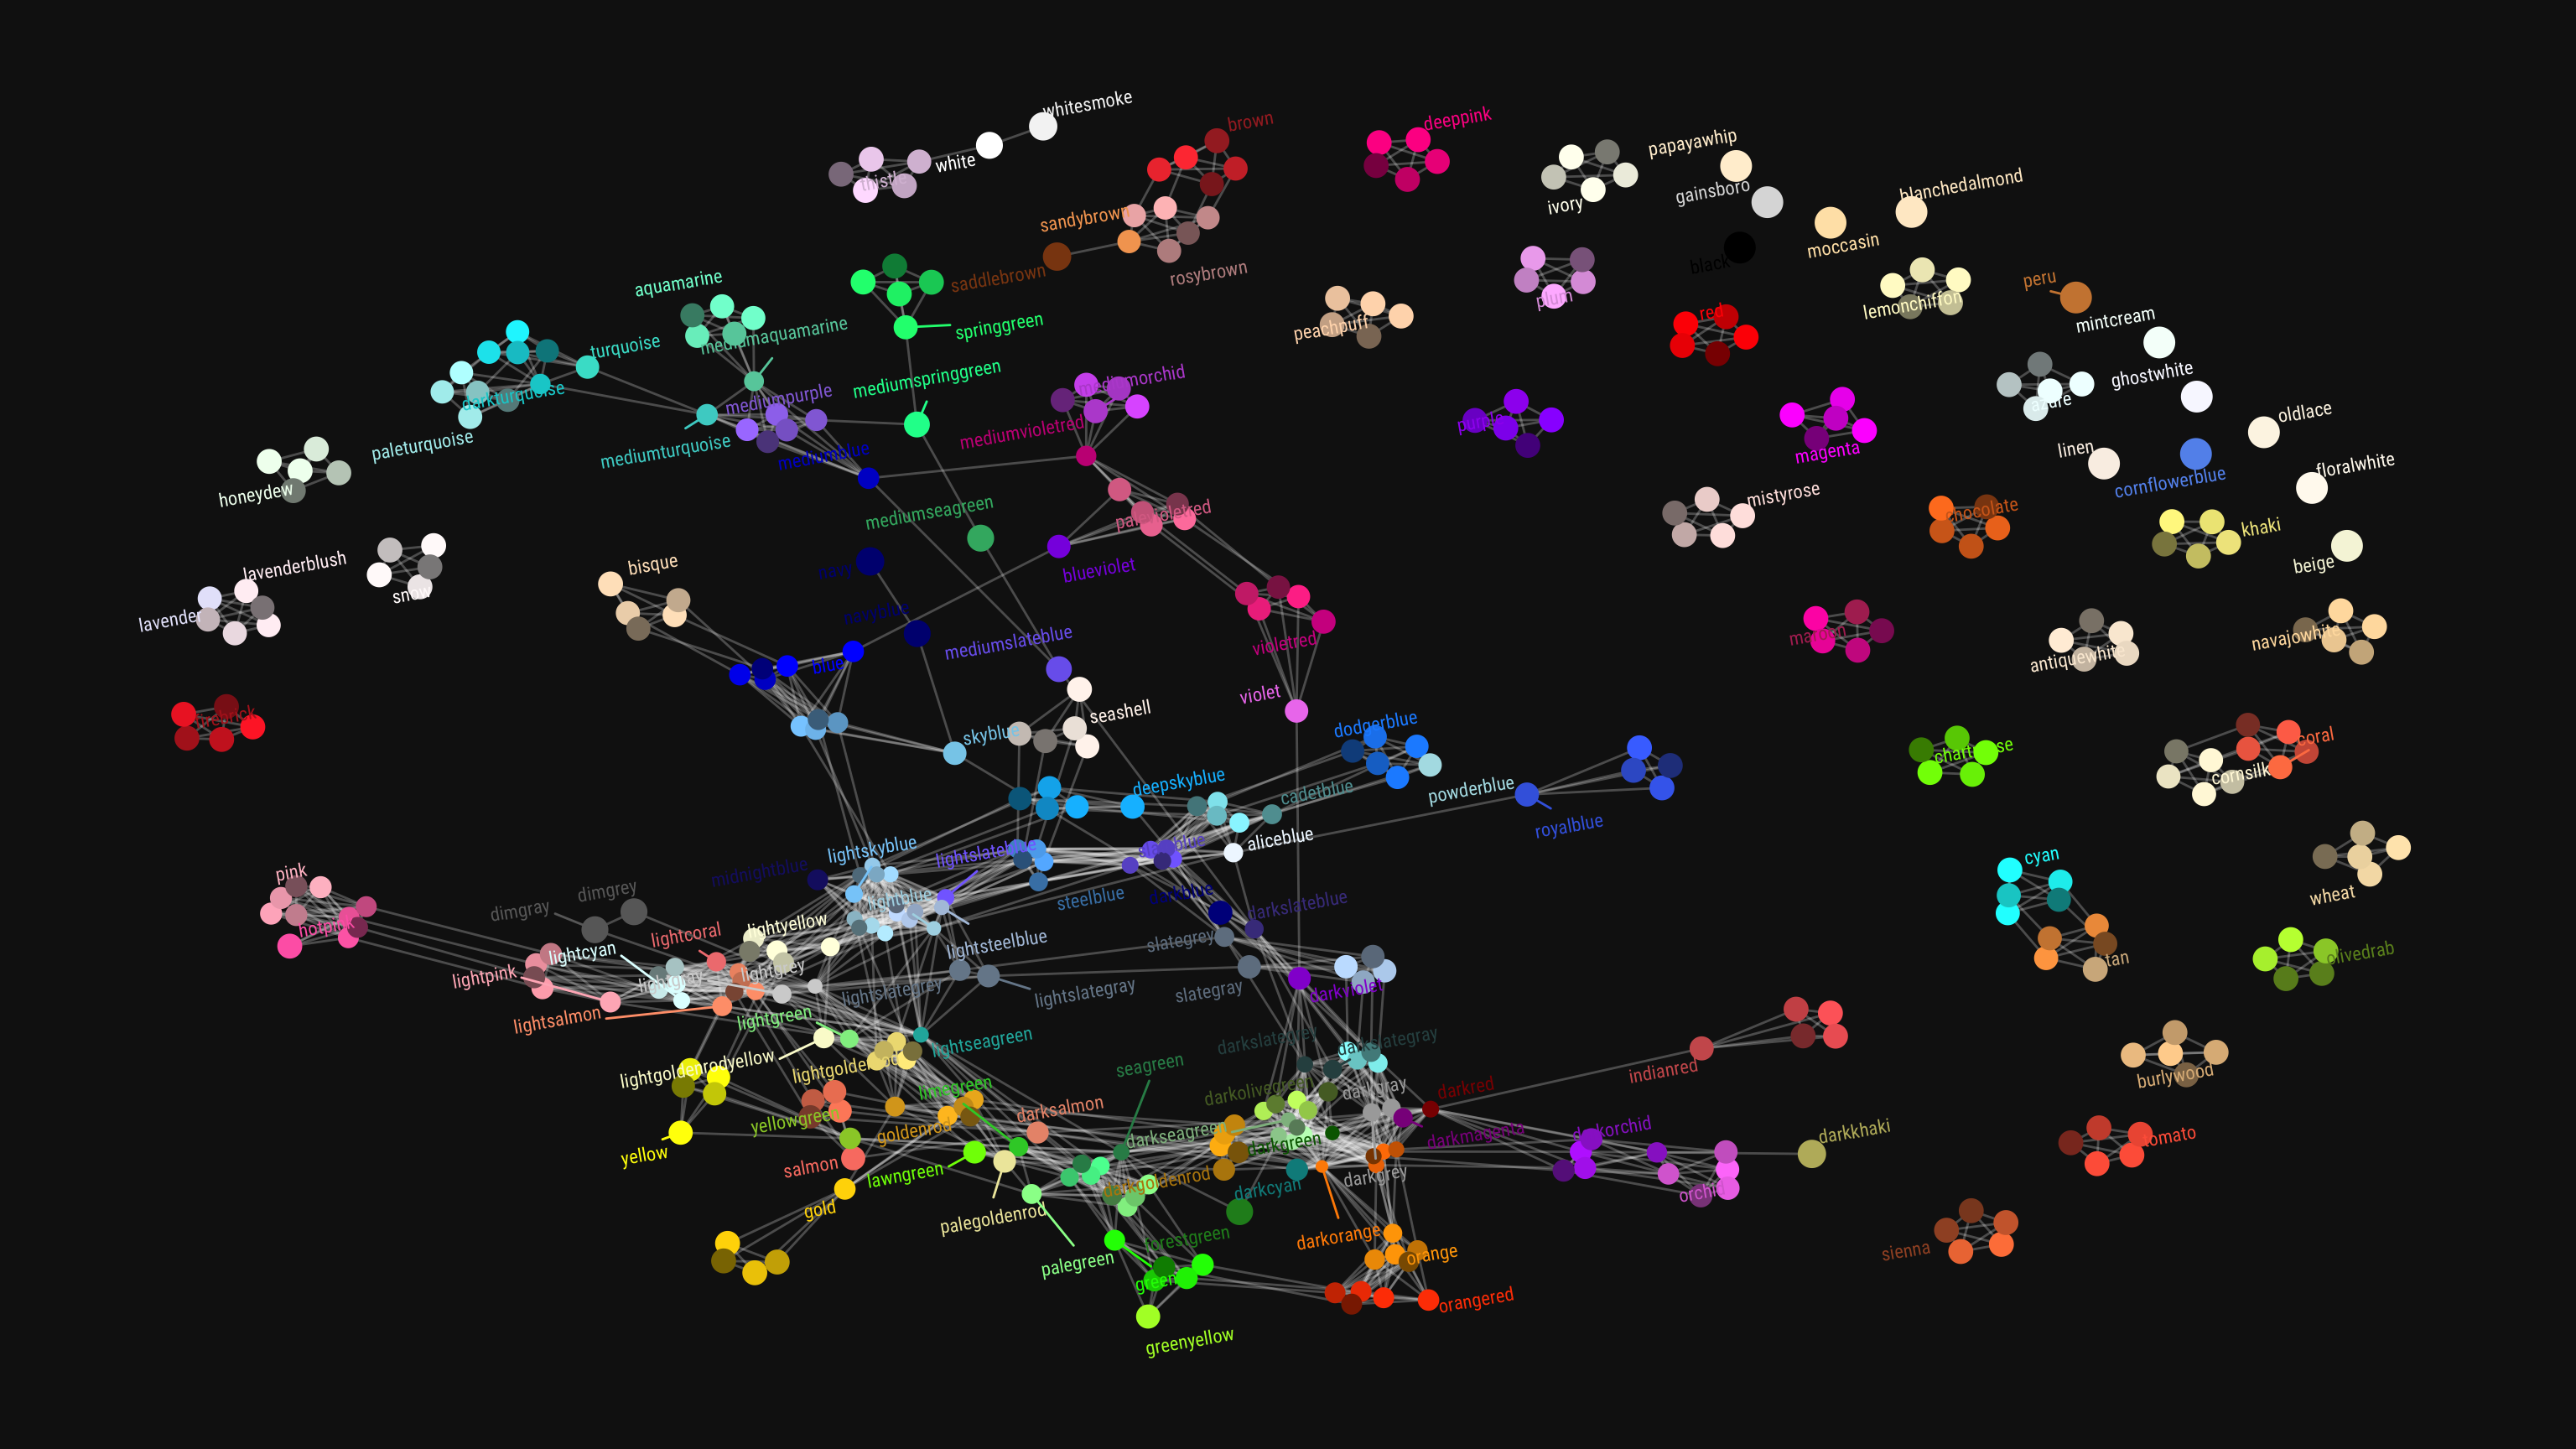
This last trick, I learned in this recent blog post I came across, by Chisato. She explored all colors() base R incorporates, using the new ggforce and ggraph packages (thank you Thomas Lin Petersen!). Her exploration resulted in some nice visual overviews, which you can view in more detail in the original blog here.
Colors() with no color familyColors() that have at least 5 colors in their familyColors() with similar names
I came across this 1999-2003 e-book by Eric Raymond, on the Art of Unix Programming. It contains several relevant overviews of the basic principles behind the Unix philosophy, which are probably useful for anybody working in hardware, software, or other algoritmic design.
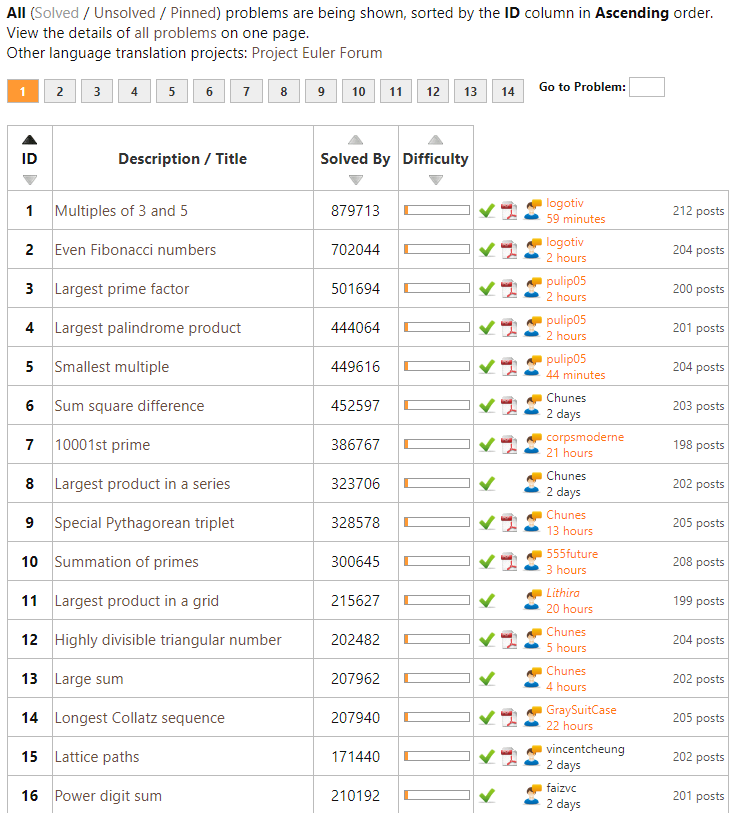
Over the last months I’ve been working my way through Project Euler in my spare time. I wanted to learn Python programming, and what better way than solving mini-problems and -projects?!
Well, Project Euler got a ton of these, listed in increasing order of difficulty. It starts out simple: to solve the first problem you need to write a program to identify multiples of 3 and 5. Next, in problem two, you are asked to sum the first thousand even Fibonacci numbers. Each problem, the task at hand gets slighly more difficult…
For me, Project Euler combines math, programming, and stats in a way that really keeps me motivated to continue and learn new concepts and programming / problem-solving approaches.
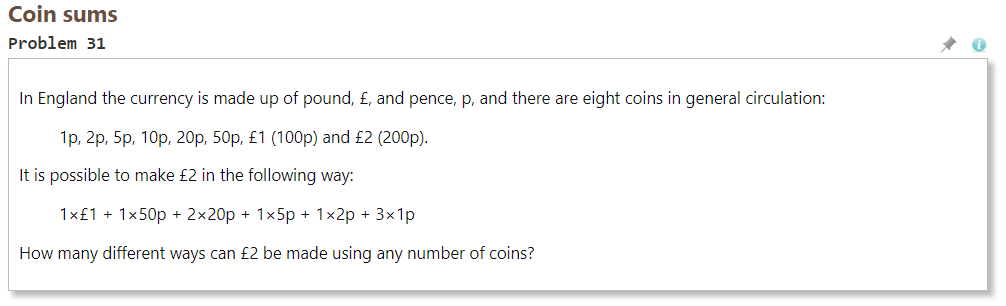
However, at problem 31, I really got stuck. For several hours, I struggled to solve it in a satisfactory fashion, even though most other problems only take 5-90 minutes.
After hours of struggling, I pretty much gave up, and googled some potential solutions. Aparently, the way to solve problem 31, is to take a so-called dynamic programming approach.
Dynamic programming is both a mathematical optimization method and a computer programming method. The method was developed by Richard Bellman in the 1950s and has found applications in numerous fields, from aerospace engineering to economics. In both contexts it refers to simplifying a complicated problem by breaking it down into simpler sub-problems in a recursive manner. While some decision problems cannot be taken apart this way, decisions that span several points in time do often break apart recursively. Likewise, in computer science, if a problem can be solved optimally by breaking it into sub-problems and then recursively finding the optimal solutions to the sub-problems, then it is said to have optimal substructure.
Now, this sounded like something I’d like to learn more about! I was already quite familiar with recursive problems and solutions, but this dynamic programming sounded next-level.
So I googled and googled for tutorials and other resources, and I finally came across this free 2011 MIT course that I intend to view over the coming weeks.
There’s even a course website with additional materials and assignments (in Python).
For those less interested in (dynamic) programming but mostly in machine learning, there’s this other great MIT OpenCourseWare youtube playlist of their Artificial Intelligence course. I absolutely loved that course and I really powered through it in a matter of weeks (which is why I am already psyched about this new one). I learned so much new concepts, and I strongly recommend it. Unfortunately, the professor recently passed away.


