Tag: regularexpression

Curated Regular Expression Resources

Curated Regular Expression Resources

Regular expression (also abbreviated to regex) really is a powertool any programmer should know. It was and is one of the things I most liked learning, as it provides you with immediate, godlike powers that can speed up your (data science) workflow tenfold.

I’ve covered many regex related topics on this blog already, but thought I’d combine them and others in a nice curated overview — for myself, and for you of course, to use.

If you have any materials you liked, but are missing, please let me know!

Contents


Introduction & Learning

Reading

Tutorials (interactive)

Video

Corey Shafer

The Coding Train

Language-specific

Python

Corey Shafer

R

Roger Peng

Testing & Debugging

debuggex.com

regex101.com

regextester.com | regexpal.com

regexr.com

ExtendsClass.com/regex-tester

rubular.com

pythex.com

Fun

Improved Twitter Mining in R

Improved Twitter Mining in R

R users have been using the twitter package by Geoff Jentry to mine tweets for several years now. However, a recent blog suggests a novel package provides a better mining tool: rtweet by Michael Kearney (GitHub).

Both packages use a similar setup and require you to do some prep-work by creating a Twitter “app” (see the package instructions). However, rtweet will save you considerable API-time and post-API munging time. This is demonstrated by the examples below, where Twitter is searched for #rstats-tagged tweets, first using twitteR, then using rtweet.

library(twitteR)

# this relies on you setting up an app in apps.twitter.com
setup_twitter_oauth(
  consumer_key = Sys.getenv("TWITTER_CONSUMER_KEY"), 
  consumer_secret = Sys.getenv("TWITTER_CONSUMER_SECRET")
)

r_folks <- searchTwitter("#rstats", n=300)

str(r_folks, 1)
## List of 300
##  $ :Reference class 'status' [package "twitteR"] with 17 fields
##   ..and 53 methods, of which 39 are  possibly relevant
##  $ :Reference class 'status' [package "twitteR"] with 17 fields
##   ..and 53 methods, of which 39 are  possibly relevant
##  $ :Reference class 'status' [package "twitteR"] with 17 fields
##   ..and 53 methods, of which 39 are  possibly relevant

str(r_folks[1])
## List of 1
##  $ :Reference class 'status' [package "twitteR"] with 17 fields
##   ..$ text         : chr "RT @historying: Wow. This is an enormously helpful tutorial by @vivalosburros for anyone interested in mapping "| __truncated__
##   ..$ favorited    : logi FALSE
##   ..$ favoriteCount: num 0
##   ..$ replyToSN    : chr(0) 
##   ..$ created      : POSIXct[1:1], format: "2017-10-22 17:18:31"
##   ..$ truncated    : logi FALSE
##   ..$ replyToSID   : chr(0) 
##   ..$ id           : chr "922150185916157952"
##   ..$ replyToUID   : chr(0) 
##   ..$ statusSource : chr "Twitter for Android"
##   ..$ screenName   : chr "jasonrhody"
##   ..$ retweetCount : num 3
##   ..$ isRetweet    : logi TRUE
##   ..$ retweeted    : logi FALSE
##   ..$ longitude    : chr(0) 
##   ..$ latitude     : chr(0) 
##   ..$ urls         :'data.frame': 0 obs. of  4 variables:
##   .. ..$ url         : chr(0) 
##   .. ..$ expanded_url: chr(0) 
##   .. ..$ dispaly_url : chr(0) 
##   .. ..$ indices     : num(0) 
##   ..and 53 methods, of which 39 are  possibly relevant:
##   ..  getCreated, getFavoriteCount, getFavorited, getId, getIsRetweet, getLatitude, getLongitude, getReplyToSID,
##   ..  getReplyToSN, getReplyToUID, getRetweetCount, getRetweeted, getRetweeters, getRetweets, getScreenName,
##   ..  getStatusSource, getText, getTruncated, getUrls, initialize, setCreated, setFavoriteCount, setFavorited, setId,
##   ..  setIsRetweet, setLatitude, setLongitude, setReplyToSID, setReplyToSN, setReplyToUID, setRetweetCount,
##   ..  setRetweeted, setScreenName, setStatusSource, setText, setTruncated, setUrls, toDataFrame, toDataFrame#twitterObj

The above operations required only several seconds to completely. The returned data is definitely usable, but not in the most handy format: the package models the Twitter API on to custom R objects. It’s elegant, but also likely overkill for most operations. Here’s the rtweet version:

library(rtweet)

# this relies on you setting up an app in apps.twitter.com
create_token(
  app = Sys.getenv("TWITTER_APP"),
  consumer_key = Sys.getenv("TWITTER_CONSUMER_KEY"), 
  consumer_secret = Sys.getenv("TWITTER_CONSUMER_SECRET")
) -> twitter_token

saveRDS(twitter_token, "~/.rtweet-oauth.rds")

# ideally put this in ~/.Renviron
Sys.setenv(TWITTER_PAT=path.expand("~/.rtweet-oauth.rds"))

rtweet_folks <- search_tweets("#rstats", n=300)

dplyr::glimpse(rtweet_folks)
## Observations: 300
## Variables: 35
## $ screen_name                     "AndySugs", "jsbreker", "__rahulgupta__", "AndySugs", "jasonrhody", "sibanjan...
## $ user_id                         "230403822", "703927710", "752359265394909184", "230403822", "14184263", "863...
## $ created_at                      2017-10-22 17:23:13, 2017-10-22 17:19:48, 2017-10-22 17:19:39, 2017-10-22 17...
## $ status_id                       "922151366767906819", "922150507745079297", "922150470382125057", "9221504090...
## $ text                            "RT:  (Rbloggers)Markets Performance after Election: Day 239  https://t.co/D1...
## $ retweet_count                   0, 0, 9, 0, 3, 1, 1, 57, 57, 103, 10, 10, 0, 0, 0, 34, 0, 0, 642, 34, 1, 1, 1...
## $ favorite_count                  0, 0, 0, 0, 0, 0, 0, 0, 0, 0, 0, 0, 0, 0, 2, 0, 0, 1, 0, 0, 0, 0, 0, 0, 0, 0,...
## $ is_quote_status                 FALSE, FALSE, FALSE, FALSE, FALSE, FALSE, FALSE, FALSE, FALSE, FALSE, FALSE, ...
## $ quote_status_id                 NA, NA, NA, NA, NA, NA, NA, NA, NA, NA, NA, NA, NA, NA, NA, NA, NA, NA, NA, N...
## $ is_retweet                      FALSE, FALSE, TRUE, FALSE, TRUE, TRUE, FALSE, TRUE, TRUE, TRUE, TRUE, TRUE, F...
## $ retweet_status_id               NA, NA, "922085241493360642", NA, "921782329936408576", "922149318550843393",...
## $ in_reply_to_status_status_id    NA, NA, NA, NA, NA, NA, NA, NA, NA, NA, NA, NA, NA, NA, NA, NA, NA, NA, NA, N...
## $ in_reply_to_status_user_id      NA, NA, NA, NA, NA, NA, NA, NA, NA, NA, NA, NA, NA, NA, NA, NA, NA, NA, NA, N...
## $ in_reply_to_status_screen_name  NA, NA, NA, NA, NA, NA, NA, NA, NA, NA, NA, NA, NA, NA, NA, NA, NA, NA, NA, N...
## $ lang                            "en", "en", "en", "en", "en", "en", "en", "en", "en", "en", "en", "en", "ro",...
## $ source                          "IFTTT", "Twitter for iPhone", "GaggleAMP", "IFTTT", "Twitter for Android", "...
## $ media_id                        NA, "922150500237062144", NA, NA, NA, NA, NA, NA, NA, NA, NA, NA, NA, NA, "92...
## $ media_url                       NA, "http://pbs.twimg.com/media/DMwi_oQUMAAdx5A.jpg", NA, NA, NA, NA, NA, NA,...
## $ media_url_expanded              NA, "https://twitter.com/jsbreker/status/922150507745079297/photo/1", NA, NA,...
## $ urls                            NA, NA, NA, NA, NA, NA, NA, NA, NA, NA, NA, NA, NA, NA, NA, NA, NA, NA, NA, N...
## $ urls_display                    "ift.tt/2xe1xrR", NA, NA, "ift.tt/2xe1xrR", NA, "bit.ly/2yAAL0M", "bit.ly/2yA...
## $ urls_expanded                   "http://ift.tt/2xe1xrR", NA, NA, "http://ift.tt/2xe1xrR", NA, "http://bit.ly/...
## $ mentions_screen_name            NA, NA, "DataRobot", NA, "historying vivalosburros", "NoorDinTech ikashnitsky...
## $ mentions_user_id                NA, NA, "622519917", NA, "18521423 304837258", "2511247075 739773414316118017...
## $ symbols                         NA, NA, NA, NA, NA, NA, NA, NA, NA, NA, NA, NA, NA, NA, NA, NA, NA, NA, NA, N...
## $ hashtags                        "rstats DataScience", "Rstats ACSmtg", "rstats", "rstats DataScience", "rstat...
## $ coordinates                     NA, NA, NA, NA, NA, NA, NA, NA, NA, NA, NA, NA, NA, NA, NA, NA, NA, NA, NA, N...
## $ place_id                        NA, NA, NA, NA, NA, NA, NA, NA, NA, NA, NA, NA, NA, NA, NA, NA, NA, NA, NA, N...
## $ place_type                      NA, NA, NA, NA, NA, NA, NA, NA, NA, NA, NA, NA, NA, NA, NA, NA, NA, NA, NA, N...
## $ place_name                      NA, NA, NA, NA, NA, NA, NA, NA, NA, NA, NA, NA, NA, NA, NA, NA, NA, NA, NA, N...
## $ place_full_name                 NA, NA, NA, NA, NA, NA, NA, NA, NA, NA, NA, NA, NA, NA, NA, NA, NA, NA, NA, N...
## $ country_code                    NA, NA, NA, NA, NA, NA, NA, NA, NA, NA, NA, NA, NA, NA, NA, NA, NA, NA, NA, N...
## $ country                         NA, NA, NA, NA, NA, NA, NA, NA, NA, NA, NA, NA, NA, NA, NA, NA, NA, NA, NA, N...
## $ bounding_box_coordinates        NA, NA, NA, NA, NA, NA, NA, NA, NA, NA, NA, NA, NA, NA, NA, NA, NA, NA, NA, N...
## $ bounding_box_type               NA, NA, NA, NA, NA, NA, NA, NA, NA, NA, NA, NA, NA, NA, NA, NA, NA, NA, NA, N...

This operation took equal to less time but provides the data in a tidy, immediately usable structure.

On the rtweet website, you can read about the additional functionalities this new package provides. For instance,ts_plot() provides a quick visual of the frequency of tweets. It’s possible to aggregate by the minute, i.e., by = "mins", or by some value of seconds, e.g.,by = "15 secs".

## Plot time series of all tweets aggregated by second
ts_plot(rt, by = "secs")

stream-ts

ts_filter() creates a time series-like data structure, which consists of “time” (specific interval of time determined via the by argument), “freq” (the number of observations, or tweets, that fall within the corresponding interval of time), and “filter” (a label representing the filtering rule used to subset the data). If no filter is provided, the returned data object includes a “filter” variable, but all of the entries will be blank "", indicating that no filter filter was used. Otherwise, ts_filter() uses the regular expressions supplied to the filter argument as values for the filter variable. To make the filter labels pretty, users may also provide a character vector using the key parameter.

## plot multiple time series by first filtering the data using
## regular expressions on the tweet "text" variable
rt %>%
  dplyr::group_by(screen_name) %>%
  ## The pipe operator allows you to combine this with ts_plot
  ## without things getting too messy.
  ts_plot() + 
  ggplot2::labs(
    title = "Tweets during election day for the 2016 U.S. election",
    subtitle = "Tweets collected, parsed, and plotted using `rtweet`"
  )

The developer cautions that these plots often resemble frowny faces: the first and last points appear significantly lower than the rest. This is caused by the first and last intervals of time to be artificially shrunken by connection and disconnection processes. To remedy this, users may specify trim = TRUE to drop the first and last observation for each time series.

stream-filter

Give rtweet a try and let me know whether you prefer it over twitter.

Regular Expression Crosswords

Regular Expression Crosswords

A regular expression (regex or regexp for short) is a special text string for describing a search pattern. You can think of regular expressions as wildcards on steroids. You are probably familiar with wildcard notations such as *.txt to find all text files in a file manager. The regex equivalent is .*\.txt$.

Last week I posted a first tutorial on Regular Expressions in R and I am working its sequels. You may find additional resources on Regular Expressions in the learning overviews (RPythonData Science).

Today I came across this website of Regular Expression Crosswords, which proves a great resource to playfully master regular expression. All puzzles are validated live using the JavaScript regex engine. The figure below explains how it works

crossword

Via the links below you can jump puzzles that matches your expertise level:

Regular Expressions in R – Part 1: Introduction and base R functions

Regular Expressions in R – Part 1: Introduction and base R functions

The following is the first part of my introduction to regular expression (regex), in general, and the use of regex in R, in specific. It is loosely inspired on the swirl() tutorial by Jon Calder. I created it in R Markdown and uploaded it to RPubs, for an easier read.

Regular expression

A regular expression, regex or regexp (sometimes called a rational expression) is, in theoretical computer science and formal language theory, a sequence of characters that define a search pattern. Usually this pattern is then used by string searching algorithms for “find” or “find and replace” operations on strings (Wikipedia). Regular expressions were originally developed for the Perl language and have since been implemented in many other languages including R.

Regular expressions usually involve two parts: a pattern and a text string. The pattern defines what type and/or sequence of characters to look for whereas the text string represents the content in which to search/match this pattern. Patterns are always strings themselves and thus need to be enclosed in (single or double) quotation marks.

Example

An example: the pattern “stat” will match the occurance of the letters “s”, “t”, “a”, “t” in that specific order. Regardless of where in the content (text string) they occur and what other characters may precede the “s” or follow the last “t”.

Base R’s grepl() function returns a logical value reflecting whether the pattern is matched. The below demonstrates how the pattern “stats” can be found in both “statistics” and “estate” but not in “castrate” (which does include the letters, but with an r in between), in “catalyst” (which does include the letters, but not in the right order), or in “banana” (which does not include all the letters).

words = c("statistics", "estate", "castrate", "catalyst", "banana")
grepl(pattern = "stat", x = words)
## [1]  TRUE  TRUE FALSE FALSE FALSE

Moreover, regular expressions are case sensitive, so “stat” is not found in “Statistics”, unless it is specified that case should be ignored (FALSE by default).

grepl(pattern = "stat", x = "Statistics")
## [1] FALSE
grepl(pattern = "stat", x = "Statistics", ignore.case = TRUE)
## [1] TRUE

Regular Expressions in Base R

Base R includes seven main functions that use regular expressions with different outcomes. These are grep()grepl()regexpr()gregexpr()regexec()sub(), and gsub(). Although they require mostly similar inputs, their returned values are quite different.

grep() & grepl()

grep() examines each element of a character vector and returns the indices where the pattern is matched.

sentences = c("I like statistics", "I like bananas", "Estates and statues are expensive")
grep("stat", sentences)
## [1] 1 3

By setting the value parameter to TRUEgrep() will return the character element instead of its index.

grep("stat", sentences, value = TRUE)
## [1] "I like statistics"                 "Estates and statues are expensive"

It’s logical brother grepl() you’ve seen before. It returns a logical value instead of the index or the element.

grepl("stat", sentences)
## [1]  TRUE FALSE  TRUE

regexpr() & gregexpr()

regexpr() seeks for a pattern in a text and returns an integer vector with two attributes (also vectors). The main integer vector returned represents the position where the pattern was first matched in the text. Its attribute “match.length” is also an integer vector representing the length of the match (in this case “stat” is always length 4).

If the pattern is not matched, both of the main vector and the length attribute will have a value of -1.

The second attribute (“useBytes”) is always a logical vector of length one. It represents whether matching is done byte-by-byte (TRUE) or character-by-character (FALSE), but you may disregard it for now.

sentences
## [1] "I like statistics"                 "I like bananas"                   
## [3] "Estates and statues are expensive"
regexpr("stat", sentences)
## [1]  8 -1  2
## attr(,"match.length")
## [1]  4 -1  4
## attr(,"useBytes")
## [1] TRUE

Note that, for the third sentence, regexpr() only returns the values for the first match (i.e., “Estate”) but not those of the second match (i.e., statues”). For this reason, the function has a brother, gregexpr(), which has the same functionality but performs the matching on a global scale (hence the leading g). This means that the algorithm does not stop after its first match, but continues and reports all matches within the content string.

grepexpr() thus does not return a single vector, but a list of vectors. Each of these vectors reflects an input content string as is the length of the number of matches within that content. For example, the “stat” pattern is matched twice in our third sentence, therefore its vector is length 2, with the starting position of each match as well as their lengths.

sentences
## [1] "I like statistics"                 "I like bananas"                   
## [3] "Estates and statues are expensive"
gregexpr("stat", sentences)
## [[1]]
## [1] 8
## attr(,"match.length")
## [1] 4
## attr(,"useBytes")
## [1] TRUE
## 
## [[2]]
## [1] -1
## attr(,"match.length")
## [1] -1
## attr(,"useBytes")
## [1] TRUE
## 
## [[3]]
## [1]  2 13
## attr(,"match.length")
## [1] 4 4
## attr(,"useBytes")
## [1] TRUE

()

In order to explain how regexec() differs from gregexpr(), we first need to explain how parentheses in work in regex. Most simply speaking, parentheses or round brackets (()) indicate groups. One of the advantages of groups is that logical tests can thus be conducted within regular expressions.

sentences 
## [1] "I like statistics"                 "I like bananas"                   
## [3] "Estates and statues are expensive"
grepl("like", sentences)
## [1]  TRUE  TRUE FALSE
grepl("are", sentences)
## [1] FALSE FALSE  TRUE
grepl("(are|like)", sentences)
## [1] TRUE TRUE TRUE

regexec()

However, these groups can also be useful to extract more detailed information from a regular expression. This is where regexec() comes in.

Like gregexpr()regexec() returns a list of the same length as the content. This list includes vectors that reflect the starting positions of the overall match, as well as the matches corresponding to parenthesized subpatterns. Similarly, attribute “match.length” reflects the lengths of each of the overall and submatches. In case no match is found, a -1 value is again returned.

The beauty of regexec() because clear when we split our pattern into two groups using parentheses: “(st)(at)”. As you can see below, both regexpr() and its global brother gregexpr() disregard this grouping and provide the same output as before – as you would expect for the pattern “stat”. In contast, regexec() notes that we now have a global pattern (“stat”)as well as two subpatterns (“st” and “at”). For each of these, the function returns the starting positions as well as the pattern lengths.

sentences
## [1] "I like statistics"                 "I like bananas"                   
## [3] "Estates and statues are expensive"
regexpr("(st)(at)", sentences)
## [1]  8 -1  2
## attr(,"match.length")
## [1]  4 -1  4
## attr(,"useBytes")
## [1] TRUE
gregexpr("(st)(at)", sentences)
## [[1]]
## [1] 8
## attr(,"match.length")
## [1] 4
## attr(,"useBytes")
## [1] TRUE
## 
## [[2]]
## [1] -1
## attr(,"match.length")
## [1] -1
## attr(,"useBytes")
## [1] TRUE
## 
## [[3]]
## [1]  2 13
## attr(,"match.length")
## [1] 4 4
## attr(,"useBytes")
## [1] TRUE
regexec("(st)(at)", sentences)
## [[1]]
## [1]  8  8 10
## attr(,"match.length")
## [1] 4 2 2
## attr(,"useBytes")
## [1] TRUE
## 
## [[2]]
## [1] -1
## attr(,"match.length")
## [1] -1
## attr(,"useBytes")
## [1] TRUE
## 
## [[3]]
## [1] 2 2 4
## attr(,"match.length")
## [1] 4 2 2
## attr(,"useBytes")
## [1] TRUE

sub() & gsub()

The final two base regex functions are sub() and its global brother gsub(). These, very intiutively, substitute a matched pattern by a specified replacement and then return all inputs. For instance, we could replace “I” with “You” in our example sentences.

sub(pattern = "I", replacement = "You", sentences)
## [1] "You like statistics"               "You like bananas"                 
## [3] "Estates and statues are expensive"

Similarly, we could desire to replace all spaces by underscores. This would require a global search (i.e., gsub()), as sub() would stop after the first match.

sub(pattern = " ", replacement = "_", sentences)
## [1] "I_like statistics"                 "I_like bananas"                   
## [3] "Estates_and statues are expensive"
gsub(pattern = " ", replacement = "_", sentences)
## [1] "I_like_statistics"                 "I_like_bananas"                   
## [3] "Estates_and_statues_are_expensive"

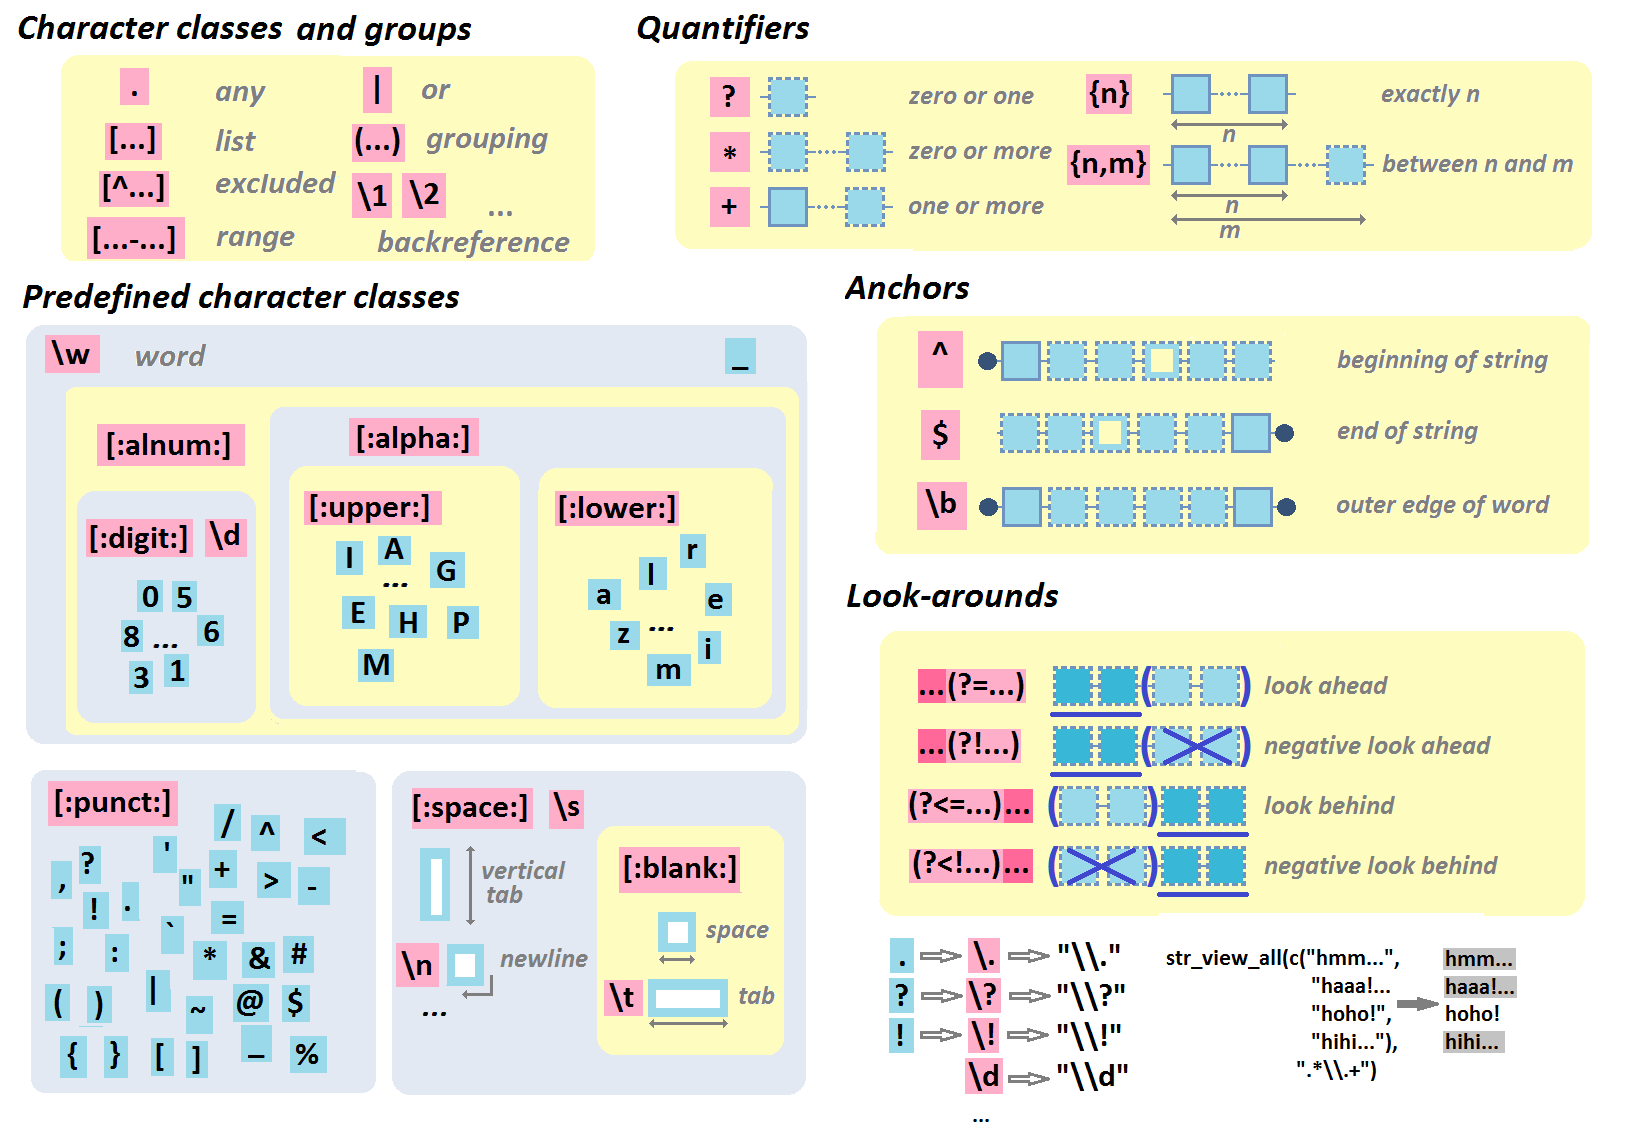
This was the first part of my introduction to Regular Expression in R. For more information detailed information about all input parameters of each function, please consult the base R manual. In subsequent parts, I will introduce you to so-called Anchors, Character Classes, Groups, Ranges, and Quantifiers. These will allow you to perform more advanced searches and matches. Here, we will also elaborate on lazygreedy, and possesive regular expressions, which further expand our search capability as well as flexibility.

In the end, I hope to provide you with an overview of several Regular Expressions that I have found extremely useful in my personal project, and which should be valuable to anyone who conducts applied research (in organizations).

R resources (free courses, books, tutorials, & cheat sheets)

R resources (free courses, books, tutorials, & cheat sheets)

Help yourself to these free books, tutorials, packages, cheat sheets, and many more materials for R programming. There’s a separate overview for handy R programming tricks. If you have additions, please comment below or contact me!


Join 1,415 other subscribers

LAST UPDATED: 2021-09-24


Table of Contents (clickable)

Completely new to R? → Start learning here!


Introductory R

Introductory Books

Online Courses

Style Guides

BACK TO TABLE OF CONTENTS


Advanced R

Package Development

Non-standard Evaluation

Functional Programming

BACK TO TABLE OF CONTENTS

Cheat Sheets

Many of the above cheat sheets are hosted in the official RStudio cheat sheet overview.


Data Manipulation


Data Visualization

Colors

Interactive / HTML / JavaScript widgets

ggplot2

ggplot2 extensions

Miscellaneous

  • coefplot – visualizes model statistics
  • circlize – circular visualizations for categorical data
  • clustree – visualize clustering analysis
  • quantmod – candlestick financial charts
  • dabestr– Data Analysis using Bootstrap-Coupled ESTimation
  • devoutsvg – an SVG graphics device (with pattern fills)
  • devoutpdf – an PDF graphics device
  • cartography – create and integrate maps in your R workflow
  • colorspace – HSL based color palettes
  • viridis – Matplotlib viridis color pallete for R
  • munsell – Munsell color palettes for R
  • Cairo – high-quality display output
  • igraph – Network Analysis and Visualization
  • graphlayouts – new layout algorithms for network visualization
  • lattice – Trellis graphics
  • tmap – thematic maps
  • trelliscopejs – interactive alternative for facet_wrap
  • rgl – interactive 3D plots
  • corrplot – graphical display of a correlation matrix
  • googleVis – Google Charts API
  • plotROC – interactive ROC plots
  • extrafont – fonts in R graphics
  • rvg – produces Vector Graphics that allow further editing in PowerPoint or Excel
  • showtext – text using system fonts
  • animation – animated graphics using ImageMagick.
  • misc3d – 3d plots, isosurfaces, etc.
  • xkcd – xkcd style graphics
  • imager – CImg library to work with images
  • ungeviz – tools for visualize uncertainty
  • waffle – square pie charts a.k.a. waffle charts
  • Creating spectograms in R with hht, warbleR, soundgen, signal, seewave, or phonTools

BACK TO TABLE OF CONTENTS


Shiny, Dashboards, & Apps


Markdown & Other Output Formats

  • tidystats – automating updating of model statistics
  • papaja – preparing APA journal articles
  • blogdown – build websites with Markdown & Hugo
  • huxtable – create Excel, html, & LaTeX tables
  • xaringan – make slideshows via remark.js and markdown
  • summarytools – produces neat, quick data summary tables
  • citr – RStudio Addin to Insert Markdown Citations

Cloud, Server, & Database

BACK TO TABLE OF CONTENTS


Statistical Modeling & Machine Learning

Books

Courses

Cheat sheets

Time series

Survival analysis

Bayesian

Miscellaneous

  • corrr – easier correlation matrix management and exploration

BACK TO TABLE OF CONTENTS


Natural Language Processing & Text Mining

Regular Expressions

BACK TO TABLE OF CONTENTS


Geographic & Spatial mapping


Bioinformatics & Computational Biology

BACK TO TABLE OF CONTENTS


Integrated Development Environments (IDEs) &
Graphical User Inferfaces (GUIs)

Descriptions mostly taken from their own websites:

  • RStudio*** – Open source and enterprise ready professional software
  • Jupyter Notebook*** – open-source web application that allows you to create and share documents that contain live code, equations, visualizations and narrative text across dozens of programming languages.
  • Microsoft R tools for Visual Studio – turn Visual Studio into a powerful R IDE
  • R Plugins for Vim, Emax, and Atom editors
  • Rattle*** – GUI for data mining
  • equisse – RStudio add-in to interactively explore and visualize data
  • R Analytic Flow – data flow diagram-based IDE
  • RKWard – easy to use and easily extensible IDE and GUI
  • Eclipse StatET – Eclipse-based IDE
  • OpenAnalytics Architect – Eclipse-based IDE
  • TinnR – open source GUI and IDE
  • DisplayR – cloud-based GUI
  • BlueSkyStatistics – GUI designed to look like SPSS and SAS 
  • ducer – GUI for everyone
  • R commander (Rcmdr) – easy and intuitive GUI
  • JGR – Java-based GUI for R
  • jamovi & jmv – free and open statistical software to bridge the gap between researcher and statistician
  • Exploratory.io – cloud-based data science focused GUI
  • Stagraph – GUI for ggplot2 that allows you to visualize and connect to databases and/or basic file types
  • ggraptr – GUI for visualization (Rapid And Pretty Things in R)
  • ML Studio – interactive Shiny platform for data visualization, statistical modeling and machine learning

R & other software and languages

R & Excel

R & Python

R & SQL

  • sqldf – running SQL statements on R data frames

BACK TO TABLE OF CONTENTS


Join 1,415 other subscribers

R Help, Connect, & Inspiration


R Blogs


R Conferences, Events, & Meetups

R Jobs

BACK TO TABLE OF CONTENTS