Category: javascript

Step up your Coding Game

Step up your Coding Game

A friend of mine pointed me to this great website where you can interactively practice and learn new programming skills by working through small coding challenges, like making a game.

CodinGame.com is an gamified learning community and website that allows you to learn new concepts by solving fun challenges. Pick from over 25 programming languages, including Python, C, C++, C#, Java, JavaScript, Go, and many more. In a matter of hours, you will work on hot programming topics, discover new languages, algorithms, and tricks in courses crafted by top developers.

A tiny guide to Variable Fonts & Color Fonts

A tiny guide to Variable Fonts & Color Fonts

So, you’ve probably never heard of variable fonts.

Well, I sure had not when I first came across the concept a week or so ago. And I was shocked. This looked so cool. As I adjusted the size of my browser, the text and images adjusted itself along. As I made my Chrome window bigger, the text enlarged to keep filling the space it was allowed. Insane!

Here’s a little write-up on variable fonts called A tiny guide to Variable Color Fonts by Typearture.com.

Variable color fonts: How do they work?

The variability works for letters, but also illustrations. And any part can be colored and sized as pleased:

Variable fonts and illustrations

I find the visual art particularly stunning, which you can find via this link:

Here’s the explanation for the GIF in the header:

Combining variable and color fonts

The original article (which I highly recommend you read) links to many useful links:

Typearture is Arthur Reinders Folmer’s adventure in type, creating type designs with a focus on conceptual, illustrative and ornamental typefaces.

The typefaces in the Typearture library are not just collections of glyphs, but typefaces that use the conventions of type design and written language to tell their stories. These stories are woven throughout the typefaces, connecting A to Z and the Lemniscate to Question mark. Each character has it’s place and meaning, making each keystroke a small tale in itself.

typearture.com
Learn Programming Project-Based: Build-Your-Own-X

Learn Programming Project-Based: Build-Your-Own-X

Last week, this interesting reddit thread was filled with overviews for cool projects that may help you learn a programming language. The top entries are:

There’s a wide range of projects you can get started on building:

If you want to focus on building stuff in a specific programming language, you can follow these links:

If you’re really into C, then follow these links to build your own:

Learn Git Branching: An Interactive Tutorial

Learn Git Branching: An Interactive Tutorial

Peter Cottle built this great interactive Git tutorial that teaches you all vital branching skills right in your browser. It’s interactive, beautiful, and very informative, introducing every concept and Git command in a step-by-step fashion.

Have a look yourself: https://learngitbranching.js.org/

Here’s the associated GitHub repository for those interested in forking.

The tutorial includes many levels that progressively teach you the Git commands you’ll need to apply version control on a daily basis:

There’s also a sandbox mode where you can interactively explore and build your own Git tree.


LearnGitBranching is a git repository visualizer, sandbox, and a series of educational tutorials and challenges. Its primary purpose is to help developers understand git through the power of visualization (something that’s absent when working on the command line). This is achieved through a game with different levels to get acquainted with the different git commands.

You can input a variety of commands into LearnGitBranching (LGB) — as commands are processed, the nearby commit tree will dynamically update to reflect the effects of each command.

This visualization combined with tutorials and “levels” can help both beginners and intermediate developers polish their version control skills. A quick demo is available here: https://pcottle.github.com/learnGitBranching/?demo
Or, you can launch the application normally here: https://pcottle.github.com/learnGitBranching/

https://github.com/pcottle/learnGitBranching
Zeit’s interactive visualization of the 2019 European election results

Zeit’s interactive visualization of the 2019 European election results

Zeit — the German newspaper — analyzed recent election results in over 80,000 regions of Europe. They discovered many patterns – from the radical left to the extremist right. Moreover, they allow you to find patterns yourself, among others in your own region.

They published the summarized election results in this beautiful interactive map of Europe.

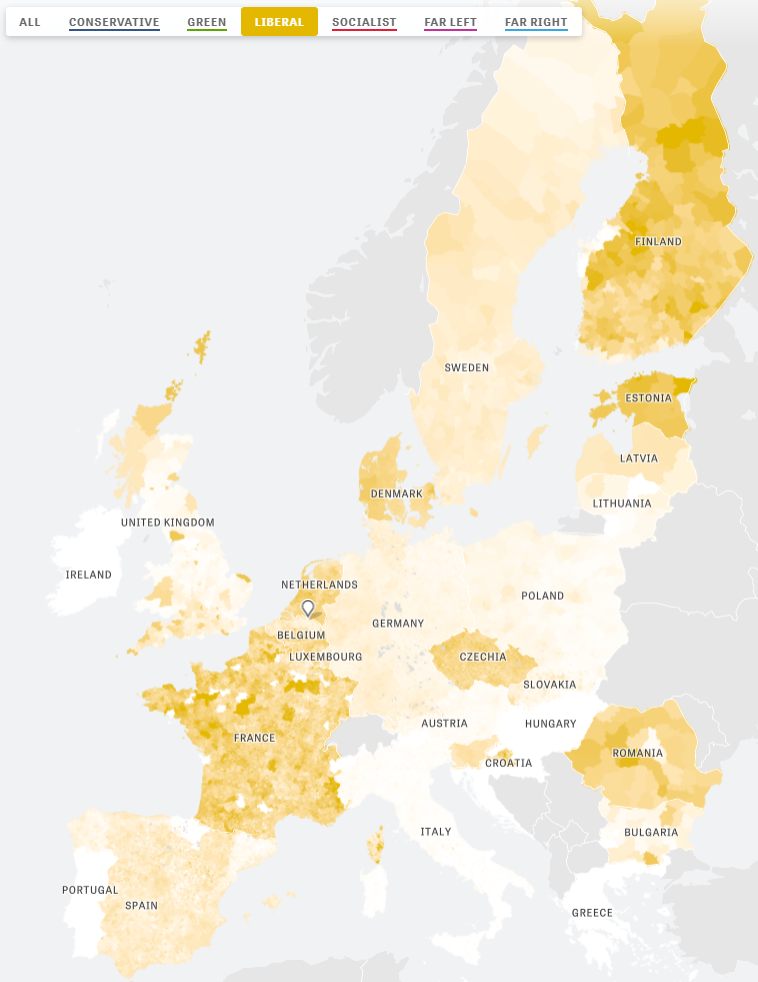
The map is beautifully color-coded for the dominant political view (Conservative, Green, Liberal, Socialist, Far left, or Far right) per region. Moreover, you can select these views and look for regions where they received respectively many votes. Like in the below, where I opted for the Liberal view, which finds strongest support in regions of the Netherlands, France, Czechia, Romania, Denmark, Estonia, and Finland.

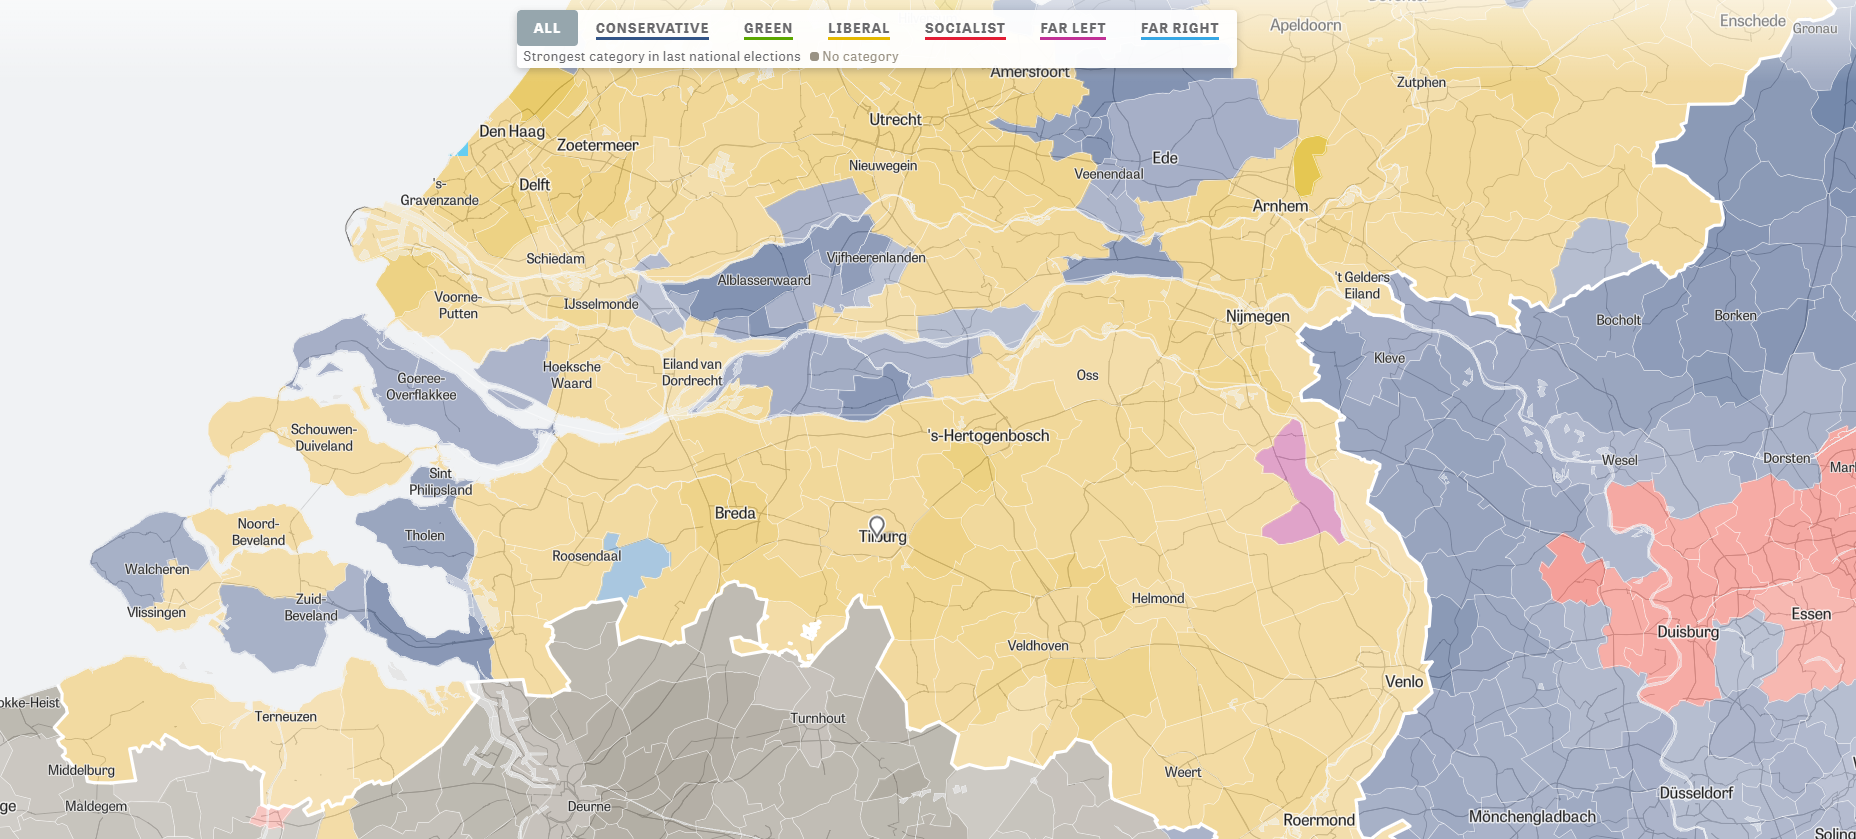
For instance, the region of Tilburg in the Netherlands — where I live — voted mostly Liberal, as depicted by the yellow Netherlands. In contrast, in the German border regions conservative and socialist parties received most votes, whereas in the Belgian border regions uncategorizable parties received most votes.

Zeit discovered some cool patterns themselves as well, as discussed in the original article. These include:

  • Right-Wing Populists in Poland
  • North-South divides in Italy and Spain
  • Considerable support for regional parties in Catalonia, Belgium, Scotland and Italy
  • Dominant Green and Liberal views in the Netherlands, France, and Germany

Have a look yourself, it’s a great example of open access data-driven journalism!

Recommended Books on Data Visualization

Recommended Books on Data Visualization

Disclaimer: This page contains one or more links to Amazon.
Any purchases made through those links provide us with a small commission that helps to host this blog.

Data visualization and the (in)effective communication of information are salient topics on this blog. I just love to read and write about best practices related to data visualization (or bad practices), or to explore novel types of complex graphs. However, I am not always online, and I am equally fond of reading about data visualization offline.

These amazing books about data visualization
are written by some of the leading experts in the dataviz scene:

Happy reading!


If you are also interested in programming and machine learning, have a look at this list of free programming books.