I’ve been blogging for just over three years now. Writing my first blogs in January 2017 in a small café in London out of pastime, I had never imagined that I would actually attract a readership. And while my blog grew in visitors and followers, it always remained just a hobby for me to summarize and post stuff I was reading or working on at the time.
Still, I want to make sure that you — my readership — get the most out of the time I invest in my blogs. Some blogs are more interesting than others, I am aware. However, I notice that it’s not only the content, but also the time and momentum of posting that draws in you readers.
Hence, I propose the following: Rather than erratically posting everything at the time of writing, I’m going to provide you with some regularity. As of today…
I will post a new blog every Tuesday, at 15:00 GMT+1
“Why that specific time?” I hear you asking. Well, it’s the perfect time as all my followers are still awake on the same day!
My Asian followers can read the blog just before or in bed,
My African and European readers can look forward to their commute home, and
My North- and South-American fans can enjoy it with their morning coffee!
Join 385 other subscribers
Over the course of last year, I posted nearly 100 blogs. If you do some quick maths, you will conclude that 1 post every Tuesday is a lot less.
And this is where you come in:
Please let me know at what time you would prefer to have me post a second blog every (other) week. You can do so in the comments, by sending me a direct message, or by reaching out to me on twitter or LinkedIn.
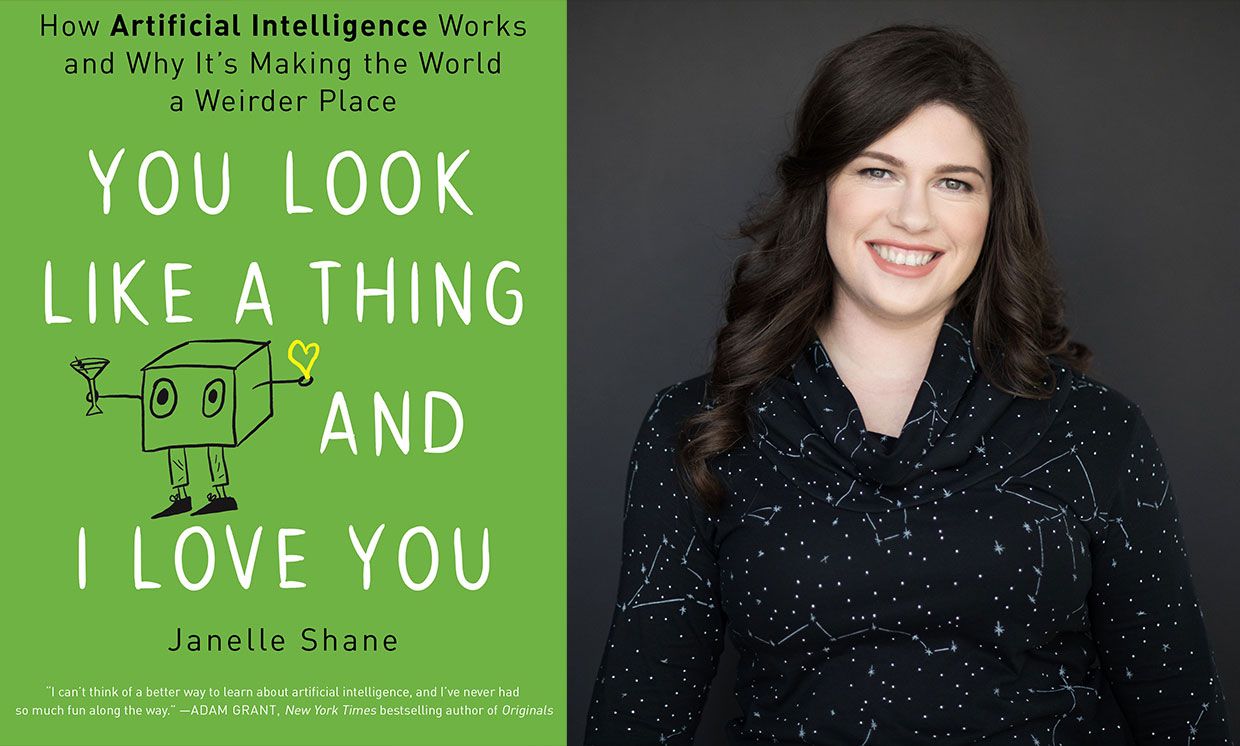
The following are my summary and take-aways from Janelle Shane’s 2019 book named You look like a thing and I love you. Most of the below are excerpts from Janelle’s book, combined, or rewritten by me. For the sake of copyright, just consider everything Janelle’s : )
AI weirdness
You look like a thing and I love you is about AI. More specifically, the book is about what AI can and can not do. And how and why AI often fails in miserably hilareous ways.
Janelle has spend her time foing fun experiments with AI. In this book, she shares those experiments along with many real life examples of AIs in practice. While explaining the technical details behind these AIs in an accesible though technically correct way, she informs the reader where, how, and why AIs fail.
Janelle took AIs out of their comfort zone and it produced some hilareously weird results. She proposes five principles of AI Weirdness:
The danger of AI is not that it’s too smart, but that it’s not smart enough
AI has the approximate brainpower of a worm
AI does not really understand the problem you want it to solve
But: AI will do exactly what you tell it to. Or at least it will try its best.
And AI willt ake the path of the least resistance
Definitions: What is (not) AI?
If it seems like AI is everywhere, it’s partly because Artificial Intelligence means lots of things, depending on whether you’re reading science fiction or selling a new app or doing academic research.
To spot an AI in the wild, it’s important to know the difference between machine learning algorithms (what Janelle calls AI in her book) and traditional, rules-based programs.
To solve a problem with a rules-based program, you have to know every step required to complete the program’s task and how to describe each one of those steps. But a machine learning algorithm figures out the rules for itself via trail and error, gauging its success on goals the programmer has specified. As the AI tries to reach this goal, it can discover rules and correlations that the programmer didn’t even know existed. This is what makes AIs attractive problem solvers and is particularly handy if the rules are really complicated or just plain mysterious.
Sometimes an AI’s brilliant problem-solving rules actually rely on mistaken assumptions. Rules that served it well in training but fail miserably when it encountered the real world. While training errors are common in complex AIs, the consequences of these mistakes can be serious.
It’s often not easy to tell when AIs make mistakes. Since we don’t write the rules, they come up with their own, and they don’t write them down or explain them the way a human would.
The difference between succesful AI problem solving and failure usually has a lot to do with the suitability of the task for an AI solution. And there are plenty of tasks for which AI solutions are more efficient than human solutions. But there are also plenty of cases where things go miserably wrong.
Janelle proposes four signs of “AI Doom”, contexts where machine learning will not produce the desired results:
The problem is too hard, broad, or complex
The problem is not what we thought it was
There are sneaky shortcuts to solving the problem
The AI tried to solve the problem learning from flawed data
Programming an AI is almost more like teaching a child than programming a computer.
Explaining how AI works
In her book, Janelle takes us through many example problems which she or others tried to solve using AIs. These example problems are increasingly hilareous, but I assure you that they are technically and didactically sound:
Playing tic-tac-toe
Managing a cockroach farm
Riding a bicycle
Rating sandwich deliciousness
Tossing a sandwich into a wall
Guiding people through a hallway
Answering questions regarding photo’s
Categorizing doodles
Categorizing fish
Tossing pancakes
Autonomous walking
Autonomous driving
Playing Pacman
The amazing thing is these ridiculous example problems actually serve a purpose. They are used to explain different algorithms and their applications, strengths, and limitations! Janelle covers a wide variety of algorithms in such a way that anyone new to machine learning would understand, while people with some experience will still be amused.
Janelle talks about artificial neural networks, random forests, and markov chains. Moreover, she explains how activation functions, recurrancy and long short-term memory, evolutionary algorithms and gradient descent work. And all in understandable though technically correct language.
Janelle herself seems particularly fond of generative algorithms. She’s elaborates on having deployed recurrent neural nets, generative adversial networks, and markov chains for a wide variety of generative tasks. In the book, Jabekke explains what went well and went wrong when coming up with new and original…
Janelle’s book is lingered with examples of failing AI. As a matter of fact, the whole book seems like an ode to how machine learning can and will inevitably fail. Particularly in the latter chapters, Janelle covers many limitations of and issues with AI in much detail:
I have yet to come across a book that explain AI in this much detail and in a manner as accessible and entertaining as Janelle Shane does in You look like a thing and I love you. Janelle makes machine learning and AI understandable for a wide public without passing on the deeper technical details. Taking a critical stance, she provides a good overview of the strenghts and weaknesses of AI, and a realistic outlook for the future to come. This book is not looking for sensation or hype, although reading it will be a most amusing experience for the more technical as well as the lay reader.
I highly recommend you reward yourself with a copy!
Reddit is a treasure trove of random stuff. However, every now and then, in the better groups, quite valuable topics pop up. Here’s one I came across on r/statistics:
Particularly the advice by grandzooby seemed worth a like, and he linked to several useful resources which I’ve summarized for you below.
An 11-step guide to reading a paper
Jennifer Raff — assistant professor at the University of Kansas — wrote this 3-page guide on how to read papers. It elaborates on 11 main pieces of advice for reading academic papers:
Begin by reading the introduction, skip the abstract.
Identify the general problem: “What problem is this research field trying to solve?”
Try to uncover the reason and need for this specific study.
Identify the specific problem: “What problems is this paper trying to solve?”
Identify what the researchers are going to do to solve that problem
Read & identify the methods: draw the studies in diagrams
Read & identify the results: write down the main findings
Determine whether the results solve the specific problem
Read the conclusions and determine whether you agree
Mary Purugganan and Jan Hewitt of Rice University propose slightly different steps for reading academic papers. Though they seem more general pointers to keep in mind to me:
Skim the article and identify its structure
Distinguish its main points
Generate questions before and during reading
Draw inferences while reading
Take notes while reading
Regarding the note taking Mary and Jan propose the following template which may proof useful:
Citation:
URL:
Keywords:
General subject:
Specific subject:
Hypotheses:
Methodology:
Results:
Key points:
Context (in the broader field/your work):
Significance (to the field/your work):
Important figures/tables (description/page numbers):
References for further reading:
Other comments:
Scholars sharing their experiences
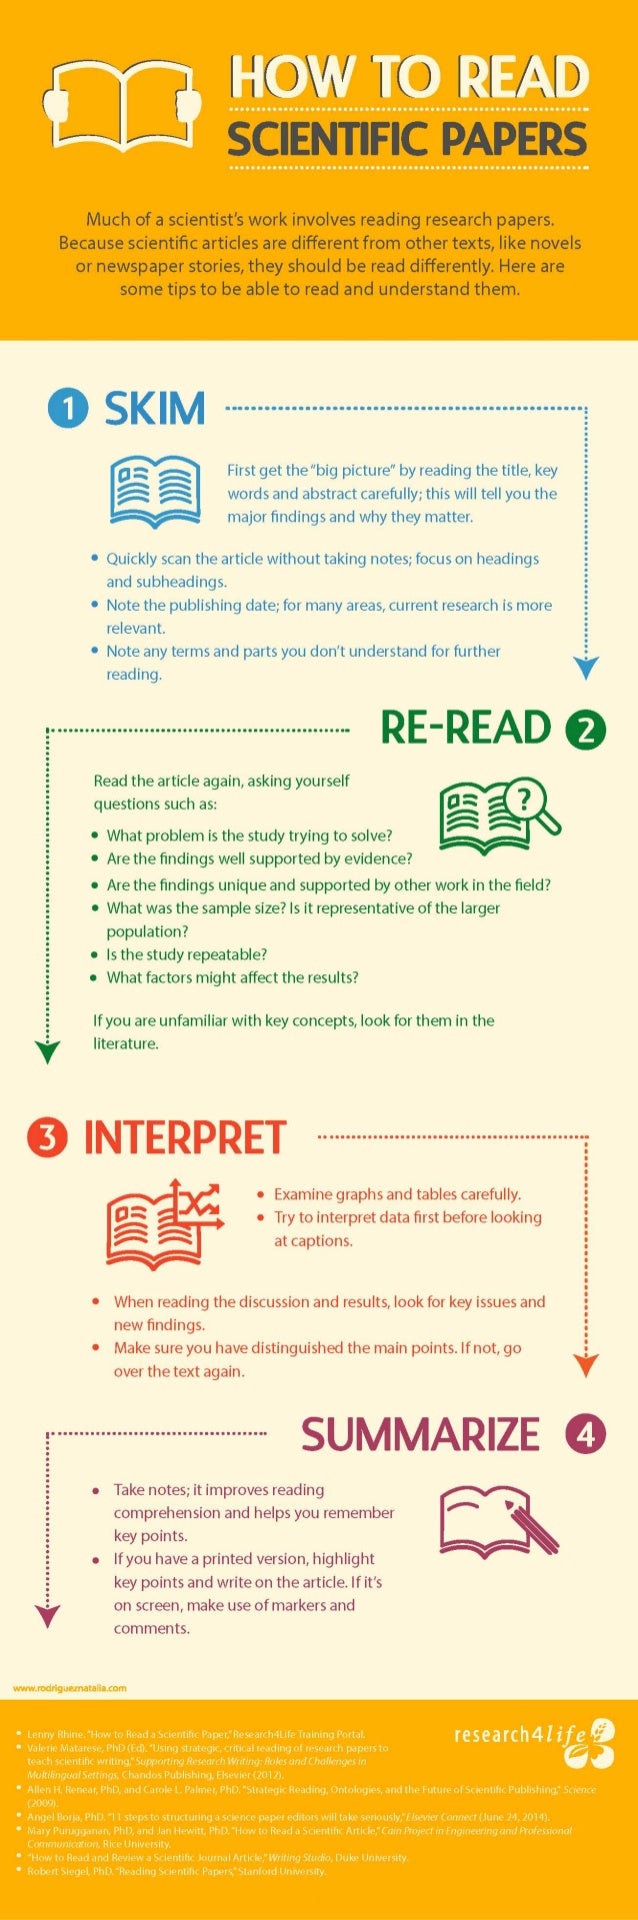
Science Magazine dedicated a long read to how to seriously read scientific papers, in which they asked multiple scholars to share their experiences and tips.
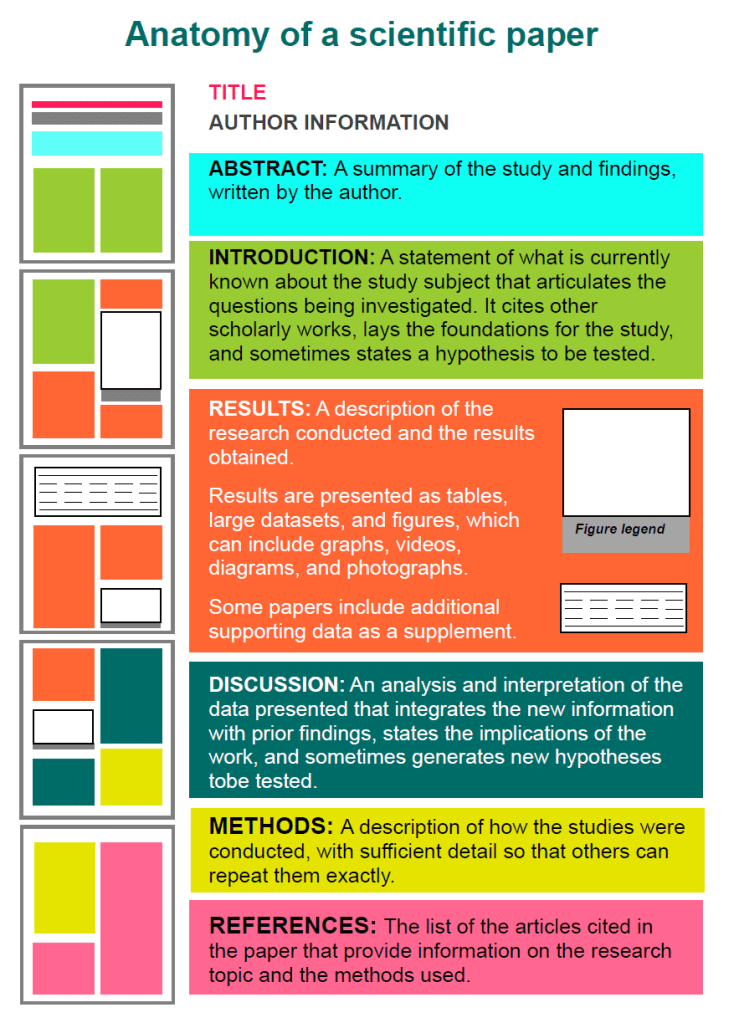
Anatomy of a scientific paper
This 13-page guide by the American Society of Plant Biologists was recommended by some, but I personally don’t find it as useful as the other advices here. Nevertheless, for the laymen, it does include a nice visualization of the anatomy of scientific papers:
This course gives you easy access to the invaluable learning techniques used by experts in art, music, literature, math, science, sports, and many other disciplines. We’ll learn about the how the brain uses two very different learning modes and how it encapsulates (“chunks”) information. We’ll also cover illusions of learning, memory techniques, dealing with procrastination, and best practices shown by research to be most effective in helping you master tough subjects.
Since 1988, the Royal Society has celebrated outstanding popular science writing and authors.
Each year, a panel of expert judges choose the book that they believe makes popular science writing compelling and accessible to the public.
Over the decades, the Prize has celebrated some notable winners including Bill Bryson and Stephen Hawking.
The author of the winning book receives £25,000 and £2,500 is awarded to each of the five shortlisted books. And this year’s shortlist includes some definite must-reads on data and statistics!
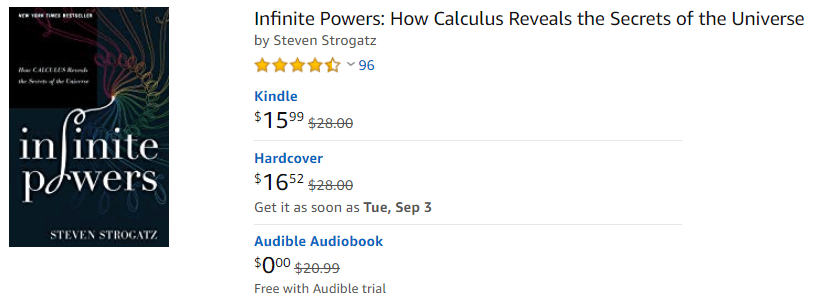
The captivating story of mathematics’ greatest ever idea: calculus. Without it, there would be no computers, no microwave ovens, no GPS, and no space travel. But before it gave modern man almost infinite powers, calculus was behind centuries of controversy, competition, and even death.
Taking us on a thrilling journey through three millennia, Professor Steven Strogatz charts the development of this seminal achievement, from the days of Archimedes to today’s breakthroughs in chaos theory and artificial intelligence. Filled with idiosyncratic characters from Pythagoras to Fourier, Infinite Powers is a compelling human drama that reveals the legacy of calculus in nearly every aspect of modern civilisation, including science, politics, medicine, philosophy, and more.
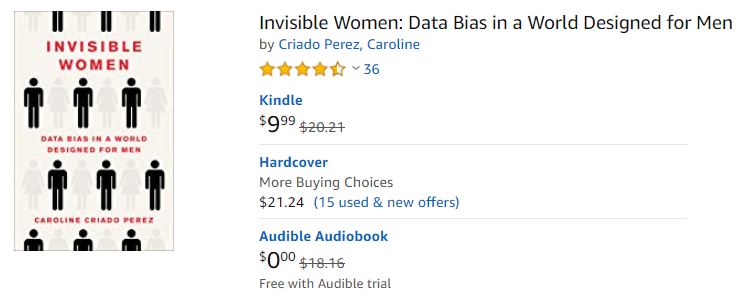
Imagine a world where your phone is too big for your hand, where your doctor prescribes a drug that is wrong for your body, where in a car accident you are 47% more likely to be seriously injured, where every week the countless hours of work you do are not recognised or valued. If any of this sounds familiar, chances are that you’re a woman.
Invisible Women shows us how, in a world largely built for and by men, we are systematically ignoring half the population. It exposes the gender data gap–a gap in our knowledge that is at the root of perpetual, systemic discrimination against women, and that has created a pervasive but invisible bias with a profound effect on women’s lives. From government policy and medical research, to technology, workplaces, urban planning and the media, Invisible Women reveals the biased data that excludes women.
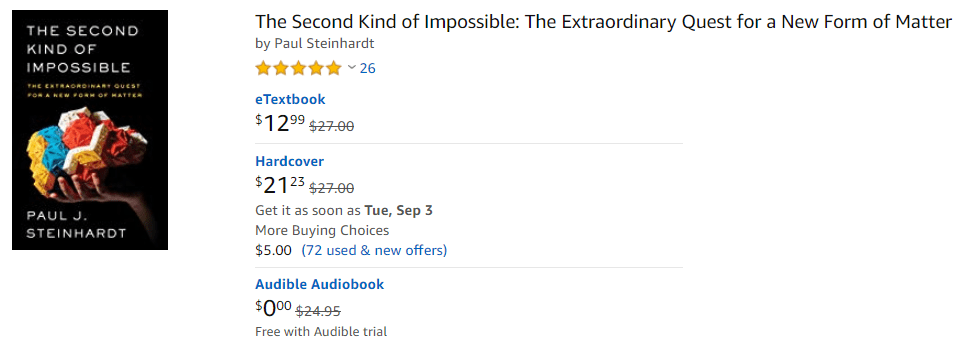
This book does not deal with data or statistics specifically, but might even be more interesting, as it covers the topic of quantum physics:
Quantum physics is strange. It tells us that a particle can be in two places at once. That particle is also a wave, and everything in the quantum world can be described entirely in terms of waves, or entirely in terms of particles, whichever you prefer.
All of this was clear by the end of the 1920s, but to the great distress of many physicists, let alone ordinary mortals, nobody has ever been able to come up with a common sense explanation of what is going on. Physicists have sought ‘quanta of solace’ in a variety of more or less convincing interpretations.
This short guide presents us with the six theories that try to explain the wild wonders of quantum. All of them are crazy, and some are crazier than others, but in this world crazy does not necessarily mean wrong, and being crazier does not necessarily mean more wrong.
The Bayesian method is the natural approach to inference, yet it is hidden from readers behind chapters of slow, mathematical analysis. Nevertheless, mathematical analysis is only one way to “think Bayes”. With cheap computing power, we can now afford to take an alternate route via probabilistic programming.
Cam Davidson-Pilon wrote the book Bayesian Methods for Hackers as a introduction to Bayesian inference from a computational and understanding-first, mathematics-second, point of view.
The book explains Bayesian principles with code and visuals. For instance:
%matplotlib inline
from IPython.core.pylabtools import figsize
import numpy as np
from matplotlib import pyplot as plt
figsize(11, 9)

import scipy.stats as stats

dist = stats.beta
n_trials = [0, 1, 2, 3, 4, 5, 8, 15, 50, 500]
data = stats.bernoulli.rvs(0.5, size=n_trials[-1])
x = np.linspace(0, 1, 100)

for k, N in enumerate(n_trials):
    sx = plt.subplot(len(n_trials)/2, 2, k+1)
    plt.xlabel("$p$, probability of heads") \
        if k in [0, len(n_trials)-1] else None
    plt.setp(sx.get_yticklabels(), visible=False)
    heads = data[:N].sum()
    y = dist.pdf(x, 1 + heads, 1 + N - heads)
    plt.plot(x, y, label="observe %d tosses,\n %d heads" % (N, heads))
    plt.fill_between(x, 0, y, color="#348ABD", alpha=0.4)
    plt.vlines(0.5, 0, 4, color="k", linestyles="--", lw=1)

    leg = plt.legend()
    leg.get_frame().set_alpha(0.4)
    plt.autoscale(tight=True)


plt.suptitle("Bayesian updating of posterior probabilities",
             y=1.02,
             fontsize=14)

plt.tight_layout()
I can only recommend you start with the online version of Bayesian Methods for Hackers, but note that the print version helps sponsor the author ánd includes some additional features:
Additional Chapter on Bayesian A/B testing
Updated examples
Answers to the end of chapter questions
Additional explanation, and rewritten sections to aid the reader.
If you’re interested in learning more about Bayesian analysis, I recommend these other books:
Disclaimer: This page contains one or more links to Amazon. Any purchases made through those links provide us with a small commission that helps to host this blog.
Data visualization and the (in)effective communication of information are salient topics on this blog. I just love to read and write about best practices related to data visualization (or bad practices), or to explore novel types of complex graphs. However, I am not always online, and I am equally fond of reading about data visualization offline.
These amazing books about data visualization are written by some of the leading experts in the dataviz scene: