Category: research

10 Simple Rules for Better Data Visualizations

10 Simple Rules for Better Data Visualizations

Nicolas Rougier, Michael Droettboom, Philip Bourne wrote an open access article for the Public Library of Open Science (PLOS) in 2014, proposing ten simple rules for better figures. Below I posted these 10 rules and quote several main sentences extracted from the original article.

Rule 1: Know Your Audience

It is important to identify, as early as possible in the design process, the audience and the message the visual is to convey. The graphical design of the visual should be informed by this intent. […] The general public may be the most difficult audience of all since you need to design a simple, possibly approximated, figure that reveals only the most salient part of your research.

Rule 2: Identify Your Message

It is important to clearly identify the role of the figure, i.e., what is the underlying message and how can a figure best express this message? […] Only after identifying the message will it be worth the time to develop your figure, just as you would take the time to craft your words and sentences when writing an article only after deciding on the main points of the text.

Rule 3: Adapt the Figure to the Support Medium

Ideally, each type of support medium requires a different figure, and you should abandon the practice of extracting a figure from your article to be put, as is, in your oral presentation. […] For example, during an oral presentation, a figure will be displayed for a limited time. Thus, the viewer must quickly understand what is displayed and what it represents while still listening to your explanation.

Rule 4: Captions Are Not Optional

The caption explains how to read the figure and provides additional precision for what cannot be graphically represented. This can be thought of as the explanation you would give during an oral presentation, or in front of a poster, but with the difference that you must think in advance about the questions people would ask. […] if there is a point of interest in the figure (critical domain, specific point, etc.), make sure it is visually distinct but do not hesitate to point it out again in the caption.

Rule 5: Do Not Trust the Defaults

All plots require at least some manual tuning of the different settings to better express the message, be it for making a precise plot more salient to a broad audience, or to choose the best colormap for the nature of the data.

Rule 6: Use Color Effectively

As explained by Edward Tufte [1], color can be either your greatest ally or your worst enemy if not used properly. If you decide to use color, you should consider which colors to use and where to use them. […] However, if you have no such need, you need to ask yourself, “Is there any reason this plot is blue and not black?”

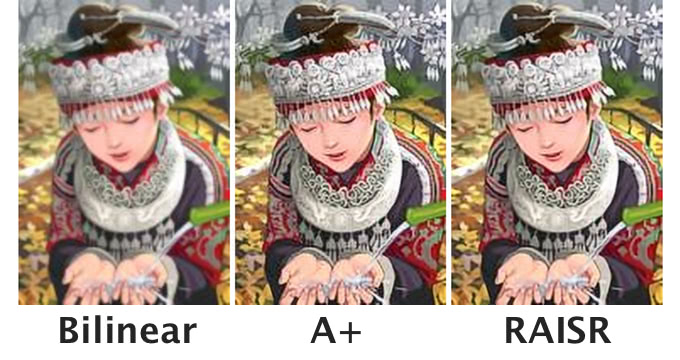
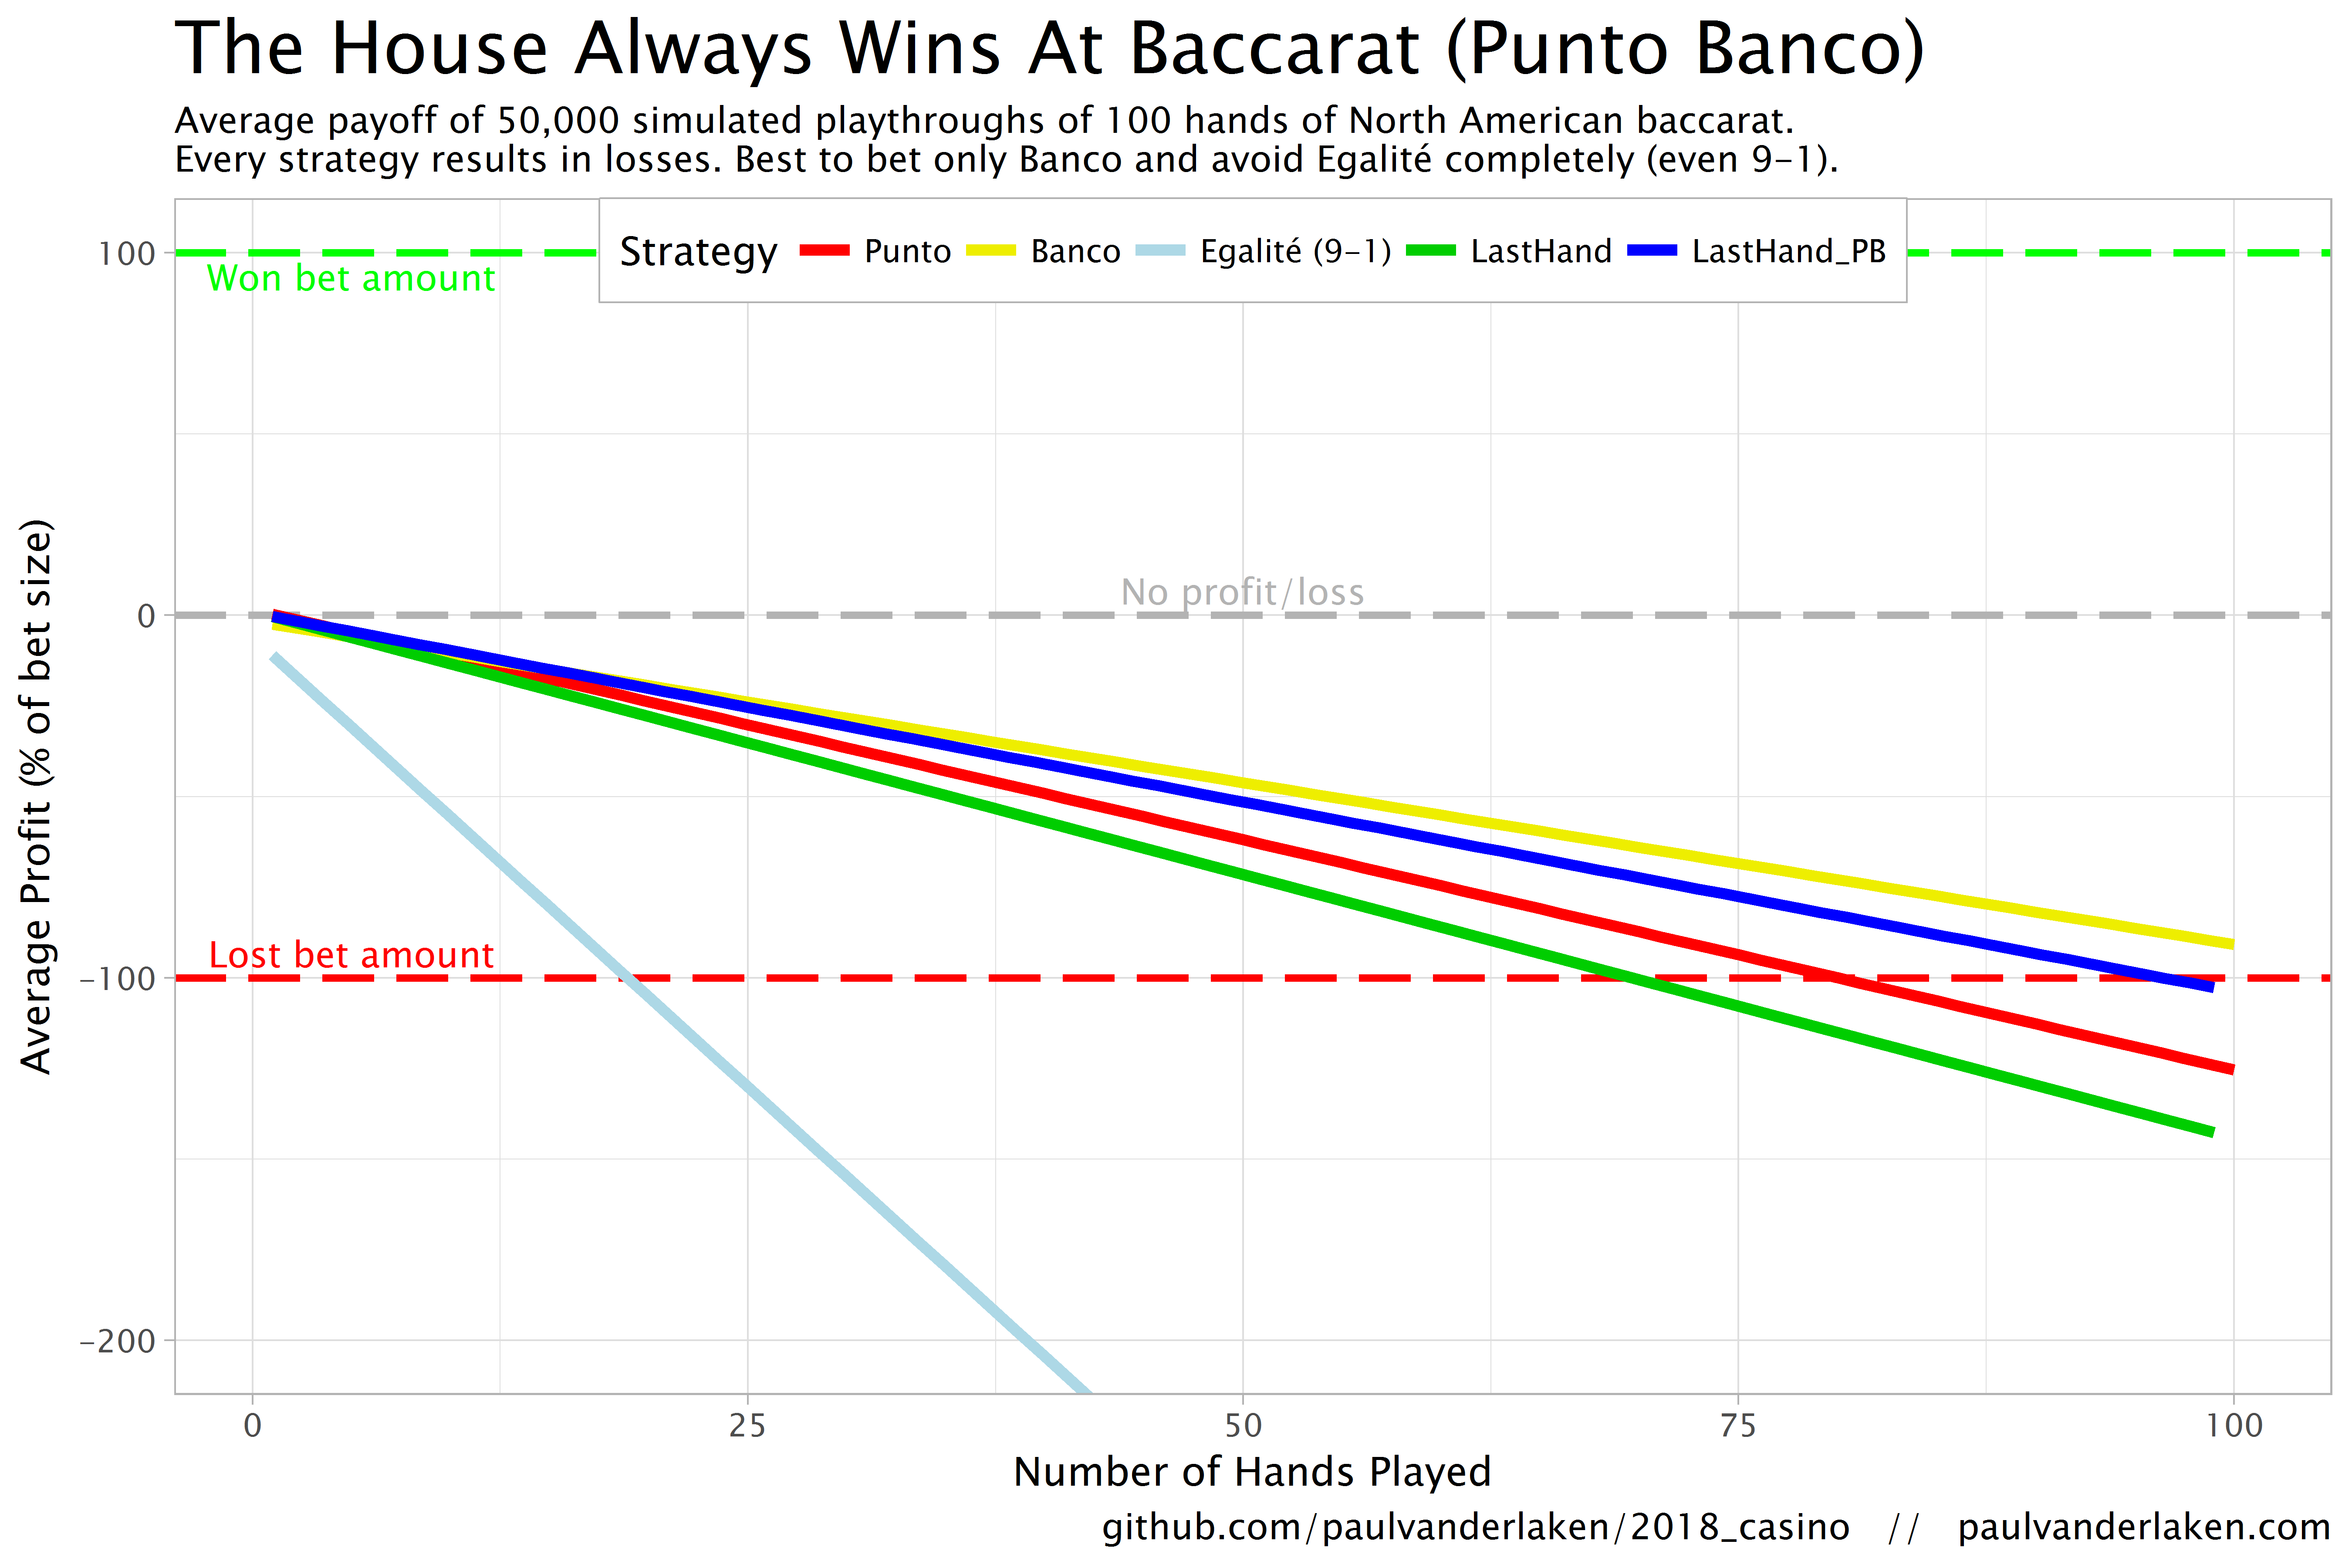
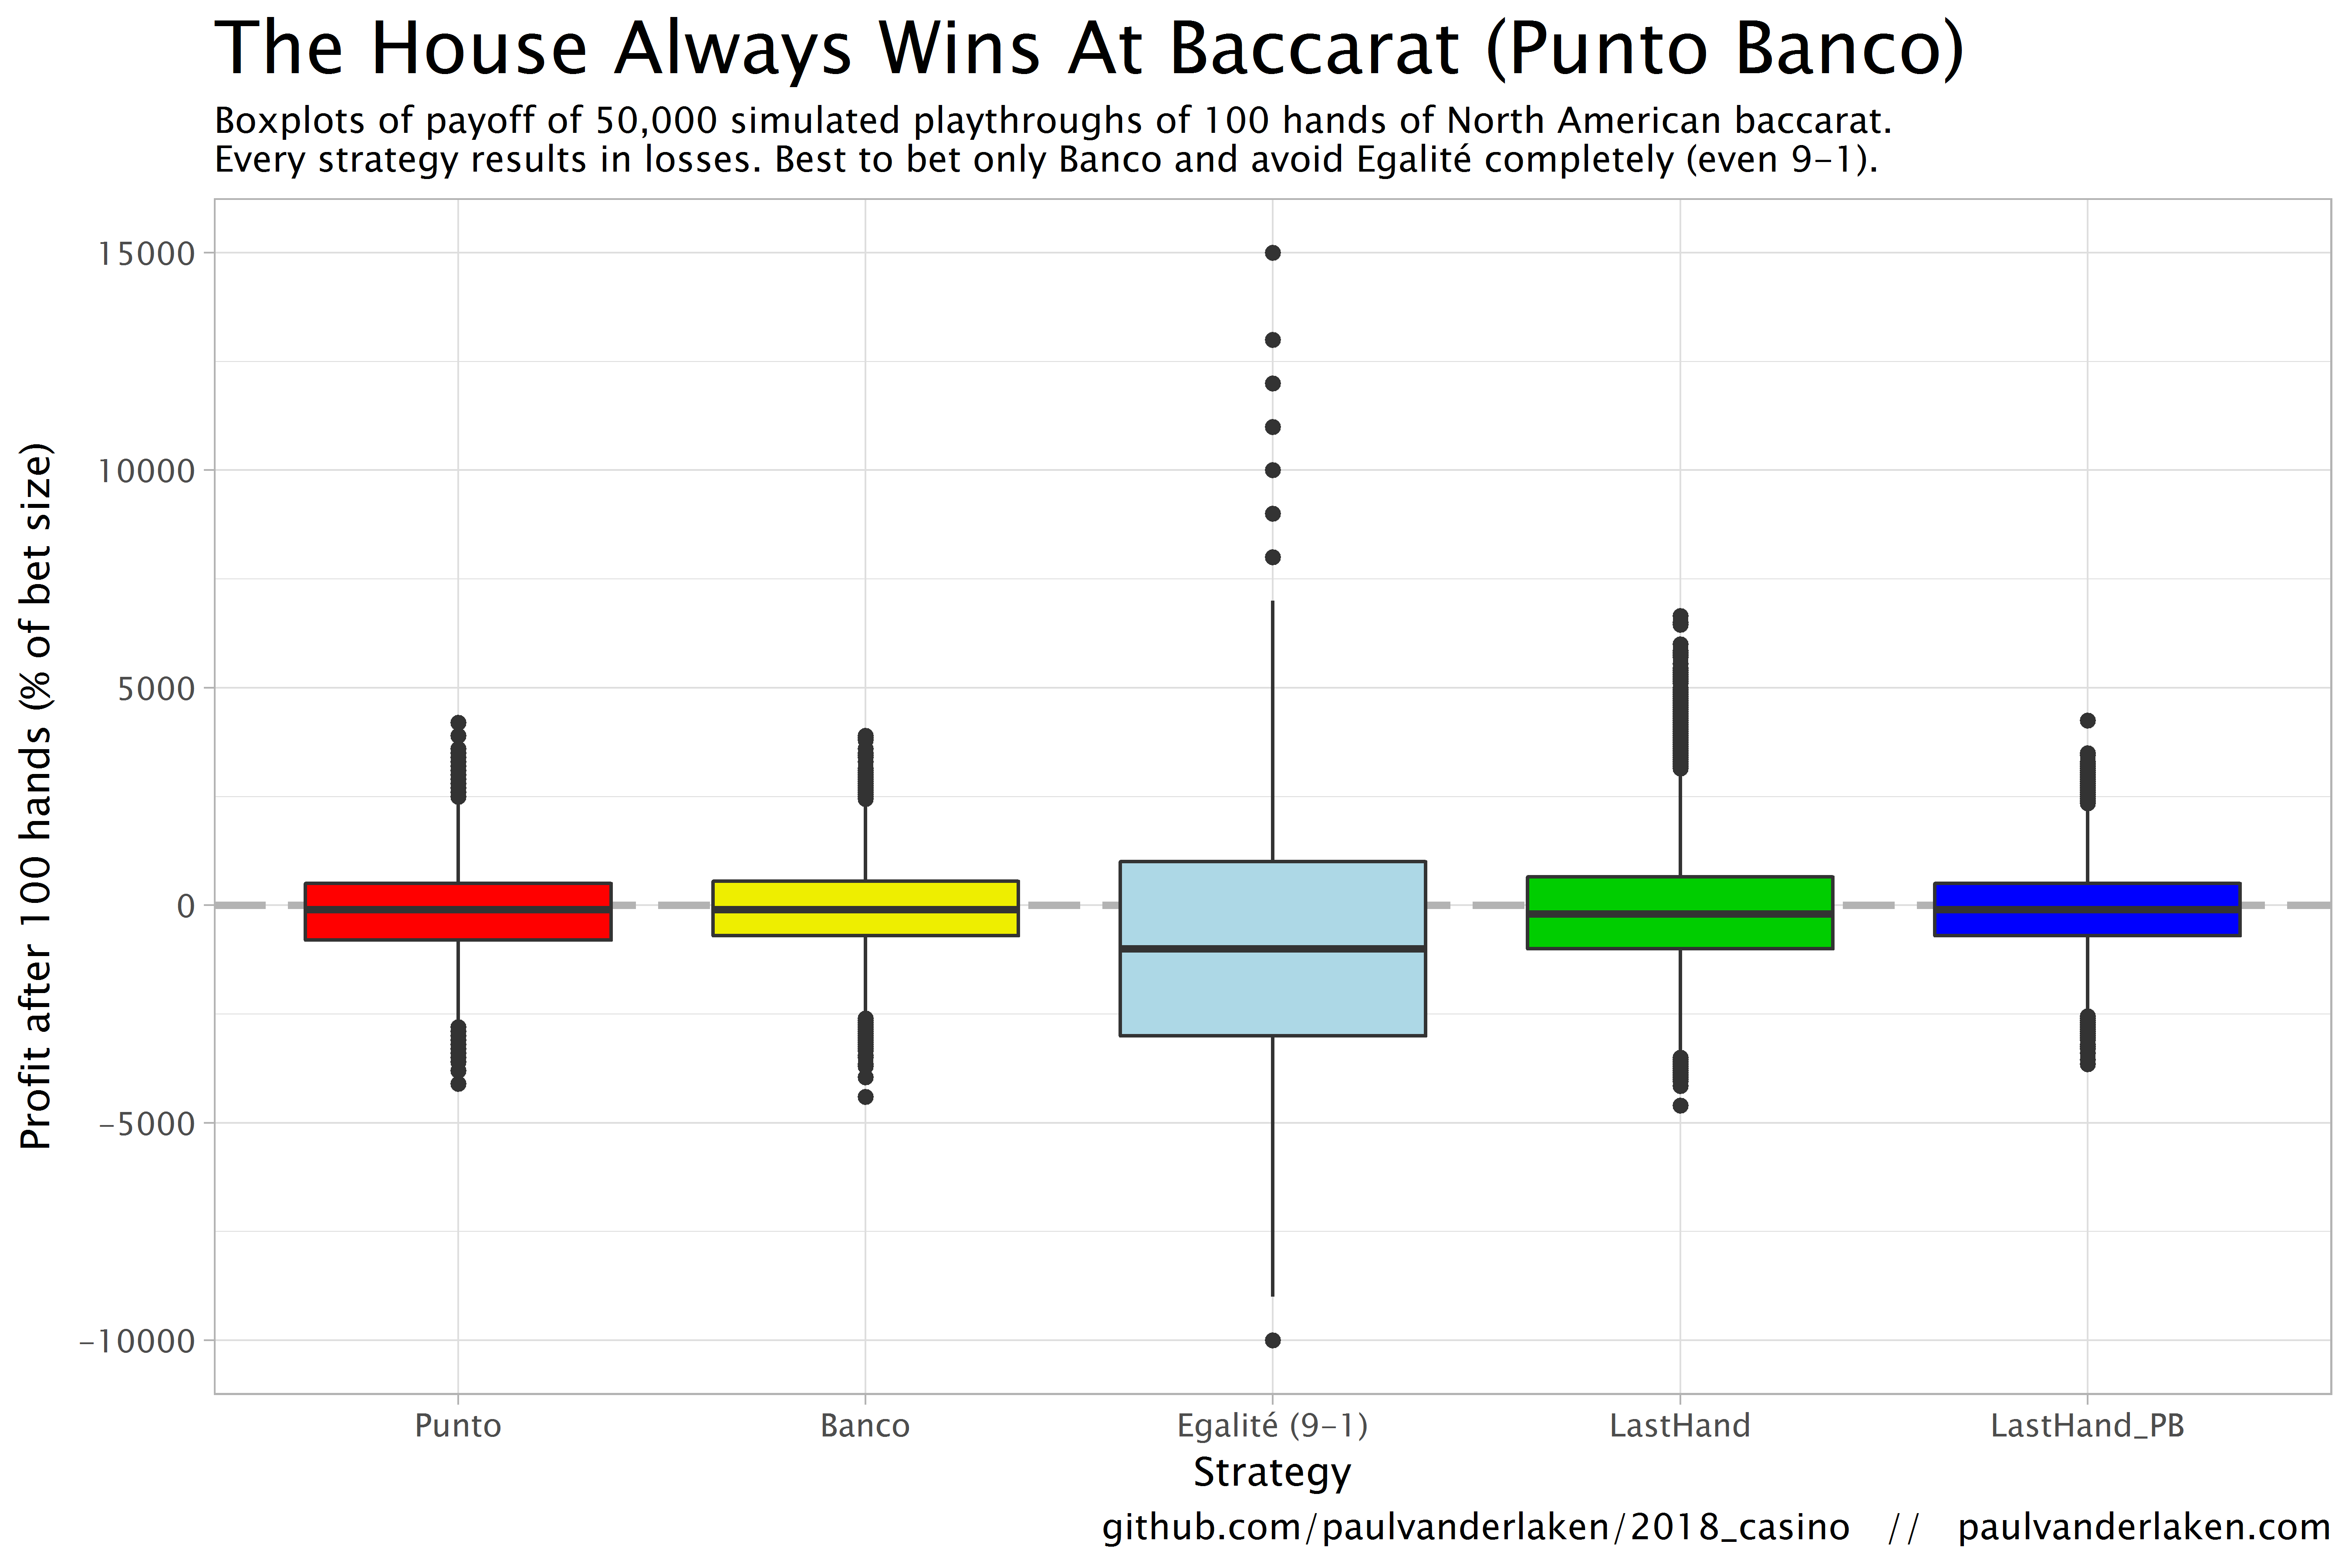
Rule 7: Do Not Mislead the Reader

What distinguishes a scientific figure from other graphical artwork is the presence of data that needs to be shown as objectively as possible. […] As a rule of thumb, make sure to always use the simplest type of plots that can convey your message and make sure to use labels, ticks, title, and the full range of values when relevant.
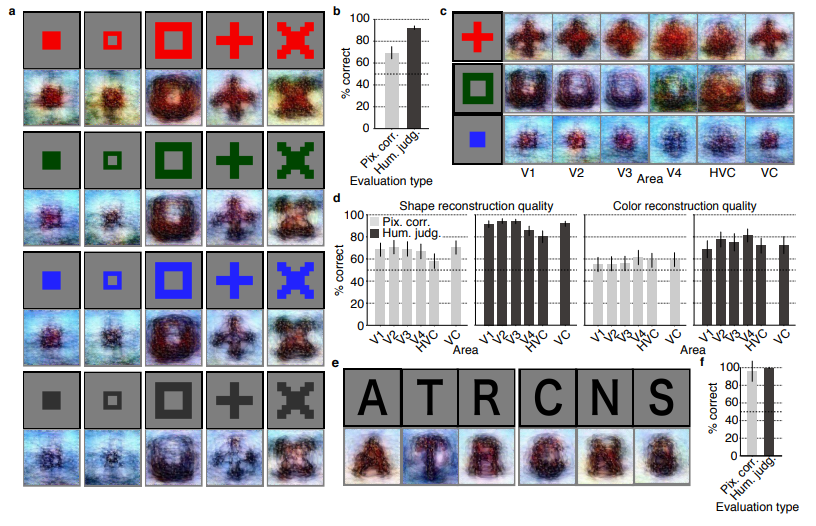
journal.pcbi.1003833.g006[2].png
Example from the paper on how visualization parameters can convey a misleading message.

Rule 8: Avoid “Chartjunk”

Chartjunk refers to all the unnecessary or confusing visual elements found in a figure that do not improve the message (in the best case) or add confusion (in the worst case). For example, chartjunk may include the use of too many colors, too many labels, gratuitously colored backgrounds, useless grid lines, etc. The term was first coined by Edward Tutfe [1]; he argues that any decorations that do not tell the viewer something new must be banned: “Regardless of the cause, it is all non-data-ink or redundant data-ink, and it is often chartjunk.” Thus, in order to avoid chartjunk, try to save ink, or electrons in the computing era.

Rule 9: Message Trumps Beauty

There exists a myriad of online graphics in which aesthetic is the first criterion and content comes in second place. Even if a lot of those graphics might be considered beautiful, most of them do not fit the scientific framework. Remember, in science, message and readability of the figure is the most important aspect while beauty is only an option.

Rule 10: Get the Right Tool

  • Matplotlib is a python plotting library, primarily for 2-D plotting, but with some 3-D support, which produces publication-quality figures in a variety of hardcopy formats and interactive environments across platforms. It comes with a huge gallery of examples that cover virtually all scientific domains (http://matplotlib.org/gallery.html).
  • is a language and environment for statistical computing and graphics. R provides a wide variety of statistical (linear and nonlinear modeling, classical statistical tests, time-series analysis, classification, clustering, etc.) and graphical techniques, and is highly extensible.
  • Inkscape is a professional vector graphics editor. It allows you to design complex figures and can be used, for example, to improve a script-generated figure or to read a PDF file in order to extract figures and transform them any way you like.
  • TikZ and PGF are TeX packages for creating graphics programmatically. TikZ is built on top of PGF and allows you to create sophisticated graphics in a rather intuitive and easy manner, as shown by the Tikz gallery (http://www.texample.net/tikz/examples/all/).
  • GIMP is the GNU Image Manipulation Program. It is an application for such tasks as photo retouching, image composition, and image authoring. If you need to quickly retouch an image or add some legends or labels, GIMP is the perfect tool.
  • ImageMagick is a software suite to create, edit, compose, or convert bitmap images from the command line. It can be used to quickly convert an image into another format, and the huge script gallery (http://www.fmwconcepts.com/imagemagick/index.php) by Fred Weinhaus will provide virtually any effect you might want to achieve.
  • D3.js (or just D3 for Data-Driven Documents) is a JavaScript library that offers an easy way to create and control interactive data-based graphical forms which run in web browsers, as shown in the gallery at http://github.com/mbostock/d3/wiki/Gallery.
  • Cytoscape is a software platform for visualizing complex networks and integrating these with any type of attribute data. If your data or results are very complex, cytoscape may help you alleviate this complexity.
  • Circos was originally designed for visualizing genomic data but can create figures from data in any field. Circos is useful if you have data that describes relationships or multilayered annotations of one or more scales.

You can download the PDF version of the full article here.

[1] Tufte EG (1983) The Visual Display of Quantitative Information. Cheshire, Connecticut: Graphics Press.


Computers decode what humans see: Generating images from brain activity

Computers decode what humans see: Generating images from brain activity

I recently got pointed towards a 2017 paper on bioRxiv that blew my mind: three researchers at the Computational Neuroscience Laboratories at Kyoto, Japan, demonstrate how they trained a deep neural network to decode human functional magnetic resonance imaging (fMRI) patterns and then generate the stimulus images.

In simple words, the scholars used sophisticated machine learning to reconstruct the photo’s their research particpants saw based on their brain activity… INSANE! The below shows the analysis workflow, and an actual reconstructed image. More reconstructions follow further on.

1.PNG
Figure 1 | Deep image reconstruction. Overview of deep image reconstruction is shown. The pixels’ values of the input image are optimized so that the DNN features of the image are similar to those decoded from fMRI activity. A deep generator network (DGN) is optionally combined with the DNN to produce natural-looking images, in which optimization is performed at the input space of the DGN. [original]
Three healthy young adults participated in two types of experiments: an image presentation experiment and an imagery experiment.

In the image presentation experiments, participants were presented with several natural images from the ImageNet database, with 40 images geometrical shapes, and with 10 images of black alphabetic characters. These visual stimuli were rear-projected onto a screen in an fMRI scanner bore. Data from each subject were collected over multiple scanning sessions spanning approximately 10 months. Images were flashed at 2 Hz for several seconds. In the imagery experiment, subjects were asked to visually imagine / remember one of 25 images of the presentation experiments. Subjects were
required to start imagining a target image after seeing some cue words.

In both experimental setups, fMRI data were collected using 3.0-Tesla Siemens MAGNETOM Verio scanner located at the Kokoro Research Center, Kyoto University.

The results, some of which I copied below, are plainly amazing.

2.PNG
Figure 2 | Seen natural image reconstructions. Images with black and gray frames show presented and reconstructed images, respectively (reconstructed from VC activity). a) Reconstructions utilizing the DGN (using DNN1–8). Three reconstructed images
correspond to reconstructions from three subjects. b) Reconstructions with and without the DGN (DNN1–8). The first, second, and third rows show presented images, reconstructions with and without the DGN, respectively. c) Reconstruction quality of seen natural images (error bars, 95% confidence interval (C.I.) across samples; three subjects pooled; chance level, 50%). d)  Reconstructions using different combinations of DNN layers (without the DGN). e) Subjective assessment of reconstructions from different combinations of DNN layers (error bars, 95% C.I. across samples) [original]
3.PNG
Figure 3 | Seen artificial shape reconstructions. Images with black and gray frames show presented and reconstructed images (DNN 1–8, without the DGN). a) Reconstructions for seen colored artificial shapes (VC activity). b, Reconstruction quality of colored artificial shapes. c) Reconstructions of colored artificial shapes obtained from multiple visual areas. d) Reconstruction quality of shape and colors for different visual areas. e) Reconstructions of alphabetical letters. f) Reconstruction quality for alphabetical letters. For b, d, f, error bars  indicate 95% C.I. across samples (three subjects pooled; chance level, 50%)  [original]
4
Supplementary Figure 2 | Other examples of natural image reconstructions obtained with the DGN. Images with black and gray frames show presented and reconstructed images, respectively (reconstructed from VC activity using all DNN layers). Three reconstructed images correspond to reconstructions from three subjects. [original]
5.PNG
Supplementary Figure 3 | Reconstructions through optimization processes. Reconstructed images obtained through the optimization processes are shown (reconstructed from VC activity of Subject 1 using all DNN layers and the DGN). Images with black and gray frames show presented and reconstructed images, respectively. [original]
There were many more examples of reconstructed images, as well as much more detailed information regarding the machine learning approach and experimental setup, so I strongly advise you check out the orginal paper.

I can’t even imagine what such technology would imply for society… Proper minority report stuff here.

Here’s the abstract as an additional teaser:

Abstract

Machine learning-based analysis of human functional magnetic resonance imaging
(fMRI) patterns has enabled the visualization of perceptual content. However, it has been limited to the reconstruction with low-level image bases (Miyawaki et al., 2008; Wen et al., 2016) or to the matching to exemplars (Naselaris et al., 2009; Nishimoto et al., 2011). Recent work showed that visual cortical activity can be decoded (translated) into hierarchical features of a deep neural network (DNN) for the same input image, providing a way to make use of the information from hierarchical visual features (Horikawa & Kamitani, 2017). Here, we present a novel image reconstruction method, in which the pixel values of an image are optimized to make its DNN features similar to those decoded from human brain activity at multiple layers. We found that the generated images resembled the stimulus images (both natural images and artificial shapes) and the subjective visual content during imagery. While our model was solely trained with natural images, our method successfully generalized the reconstruction to artificial shapes, indicating that our model indeed ‘reconstructs’ or ‘generates’ images from brain activity, not simply matches to exemplars. A natural image prior introduced by another deep neural network effectively rendered semantically meaningful details to reconstructions by constraining reconstructed images to be similar to natural images. Furthermore, human judgment of reconstructions suggests the effectiveness of combining multiple DNN layers to enhance visual quality of generated images. The results suggest that hierarchical visual information in the brain can be effectively combined to reconstruct perceptual and subjective images.

Super Resolution: A Photo Enhancer AI

In the video below, one of my favorite YouTube channels (Two Minute Papers) discusses a new super resolution project where academic scholars taught a neural network to improve low quality photo’s. The researchers took the same picture with multiple camera’s of varying quality and allowed a neural network to learn how the lowest quality pictures can be adjusted to more closely resemble their high quality counterparts. A very interesting approach and the results are just mind-boggling:

photo_super_resolution.png

The scholars were nice enough to not only publish the paper open access, but also to open source the data. You can download a 125 Mb sample here or the original full 64 GB dataset here.

The House Always Wins: Simulating 5,000,000 Games of Baccarat a.k.a. Punto Banco

The House Always Wins: Simulating 5,000,000 Games of Baccarat a.k.a. Punto Banco

The associated GitHub repository with R code.

Past weekend, I visited the casino with some friends. Of all games, we enjoy North-American-style Baccarat the most. This type of Baccarat is often called Punto Banco. In short, Punto Banco is a card game in which two hands compete: the “player” and the “banker“. During each coup (a round of play), both hands get dealt either 2 or 3 cards, depending on a complex drawing schema, and all cards have a certain value. Put simply, the hand with the highest total value of cards wins the coup, after which a new one starts. Before each coup, gamblers may bet which of the hands will win. Neither hand is in any way associated with the actual house or player/gambler, so bets may be placed on both. All in all, three different bets can be placed in a game of Punto Banco:

  1. The player hand has the highest total value, in which case the player wins (Punto);
  2. The banker hand has the highest total value, in which case the banker wins (Banco);
  3. The player and banker hands have equal total value, in which case there is a tie (Egalité).

If a gambler correctly bets either Punto or Banco, their bets get a 100% payoff. However, a house tax will often be applied to Banco wins. For instance, Banco wins may only pay off 95% or specific Banco wins (e.g., total card value of 5) may pay off less (e.g., 50%). Depending on house rules, a correct bet on a tie (Egalité) will pay off either 800% or 900%. A wrong bet on Punto or Banco stands in case Egalité is dealt. In all other cases of wrong bets, the house takes the money.

Image result for punto banco casino

My friends and I like Punto Banco because it is completely random but seems “gameable”. Punto Banco is played with six or eight decks so there is no way to know which cards will be next. Moreover, the card-drawing rules are quite complex, so you never really know what’s going to happen. Sometimes both Punto and Banco get only two cards, at other times, the hand you bet on will get its third card, which might just turn things around. Punto Banco’s perceived gameability comes through our human fallacies to see patterns in randomness. Often, casino’s will place a monitor with the last fifty-so results (see below) to tempt gamblers to (erroneously) spot and bet on patterns. Alternatively, you might think it’s smart to bet against the table (play Punto when everybody else goes for Banco) or play on whatever bet won last hand. As the hands are dealt quite quickly in succession, and the minimal bet is often 10+ euro/dollar, Punto Banco is a quick way to find out how lucky you are.

Image result for punto banco scoreboard
Examples of Baccarat monitors, often placed next to a table.

So back to last weekend’s trip to the casino. Unfortunately, my friends and I lost quite some money at the Punto Banco table. We know the house has an edge (though smaller than in other games) but normally we are quite lucky. We often discuss what would be good strategies to minimize this houses’ edge. Obviously, you want to play as few games as possible, but that’s as far as we got in terms of strategy. Normally, we just test our luck and randomly bet Punto or Banco, and sparsely on Egalité.

As a statistical programmer, I thought it might be interesting to simulate the game and its odds from the bottom up. On the one hand, I wanted to get a sense of how favorable the odds are to the house. On the other hand, I was curious as to what extent strategies may be more or less successful in retaining at least some of your hard-earned cash.

In my simulations, I follow the Holland Casino Punto Banco rules, meaning a six-deck shoe and a Banco win with 5 pays out 50%. I did adopt the more lenient 9-1 payoff for Egalité though. Several hours of programming and some million simulated Baccarat hands later, here are the results:

  1. Do not play Baccarat / Punto Banco if you do not want to lose your money. Obviously, it’s best to not set foot in the casino if you can’t afford to lose some money. However, I eagerly pay for the entertainment value I get from it.
  2. You lose least if you stick to BancoDespite having only a 50% payoff when Banco wins with 5, the odds are best for Banco due to the drawing rules. Indeed, according to the Wizard of Odds, the house edge for Banco (1.06%) is slightly lower than that of Punto (1.24%).
  3. Whatever you do, do not bet on Egalité. Because most casino’s pay out 8 to 1 in case of a correctly predicted tie, betting on one seems about the worst gambling strategy out there. With a house edge of over 14%, you are better off playing most other games (Wizard of Odds). Although casino’s paying out a tie 9 to 1 decrease the house edge to just below 5%, this is still way worse than playing either Punto or Banco.

The figure below shows the results of the five strategies I tested using 50,000 simulations of 100 consecutive hands. Based on the results, I was reluctant to develop and test other strategies as results look quite straightforward: play Banco. Additionally, Wikipedia cites Thorp (1984, original reference unknown) who suggested that there are no strategies that will really result in any significant player advantage, except maybe for the endgame of a deck, which presumably requires a lot of card counting. If you nevertheless want to test other strategies, please be my guest, here are my five:

  1. Punto: Always bet on Punto.
  2. Banco: Always bet on Banco.
  3. Egalité: Always bet on Egalité.
  4. LastHand: Bet on the outcome of the last hand/coup.
  5. LastHand_PB: Bet on the outcome of the last hand/coup, only if this was Punto or Banco.
average_payoff_PB_50000s100h

The above figure depicts the expected value of each strategy over a series of consecutive hands played. Clearly, the payoff is quite linear, independent of your strategy. The more hands you play, the more you lose. However, also clear is that some strategies outperform others. After 100 hands of Baccarat, playing only Banco will on average result in a total loss below the amount you wager. For example, if you bet 10 euro every hand, you will have a loss of about 9 euro’s after 100 rounds, on average. This is in line with the ~1% house edge reported by the Wizard of Odds. Similarly, betting only Punto will result in a loss of about 130% of the bet amount, which is also conform the ~1.4% house edge reported by the Wizard of Odds. Betting on Punto or Banco based on whichever won last (LastHand_PB) performs somewhere in between these two strategies, losing just over 100% of the bet amount in 100 hands. Your expected losses increase when you just bet on whichever outcome came last, including Egalité, resulting in around ~-150% after 100 hands. This is mainly because betting on Egalité, which seems about the worst strategy ever, will result in a remarkable 493.9% loss after 100 hands.

Apart from these average or expected values, I was also interested in the spread of outcomes of our thousands of simulations. Particularly because gamblers on a lucky streak may win much more when betting on Egalité, as the payoff is larger (8-1 or 9-1). The figure below shows that any strategy including Egalité will indeed result in a wider spread of outcomes. Betting on Egalité may thus be a good strategy if you are by some miracle divinely lucky, have information on which cards are coming next, or have an agreement with the dealer (disclaimer: this is a joke, please do not ever bet on Egalité with the intention of making money or try to cheat at the casino).

boxplot_profit_PB_50000s100h.png

If you want to know how I programmed these simulations, please visit the associated github repository or reach out. I intend on simulating the payoff for various other casino games in the near future (first up: BlackJack), so if you are interested keep an eye on my website or twitter.

Join 385 other subscribers
Robust Effect Sizes for Independent Group Comparisons

Robust Effect Sizes for Independent Group Comparisons

Guillaume Rousselet explains how and when group comparisons with Cohen’s d fail, and what robust statistics one could use instead:

garstats's avatarbasic statistics

When I was an undergrad, I was told that beyond a certain sample size (n=30 if I recall correctly), t-tests and ANOVAs are fine. This was a lie. I wished I had been taught robust methods and that t-tests and ANOVAs on means are only a few options among many alternatives. Indeed, t-tests and ANOVAs on means are not robust to outliers, skewness, heavy-tails, and for independent groups, differences in skewness, variance (heteroscedasticity) and combinations of these factors (Wilcox & Keselman, 2003; Wilcox, 2012). The main consequence is a lack of statistical power. For this reason, it is often advised to report a measure of effect size to determine, for instance, if a non-significant effect (based on some arbitrary p value threshold) could be due to lack of power, or reflect a genuine lack of effect. The rationale is that an effect could be associated with a sufficiently large effect…

View original post 3,911 more words

Super Resolution: Increasing image quality CSI-like

Super Resolution: Increasing image quality CSI-like

Super-resolution imaging is a class of techniques that enhance the resolution of an imaging system (Wikipedia). The entertainment series CSI has been ridiculed for relying on exaggerated and unrealistic applications of it:

giphy

Until recently, such upscaling of images were though near impossible. However, we have evidenced some pretty amazing breakthroughs in the deep learning space recently. Artificial Intelligence can think ahead, learn physics, and beat experts at their own games (DOTA; Poker), mostly through inventive applications of neural networks.

As a result, there are now several applications where machines have learned to literally fill in the blanks in imagery. Most notable seems the method developed by Google: Rapid and Accurate Image Super Resolution, or RAISR is short. In contrast to other approaches, RAISR does not rely on (adversarial) neural network(s) and is thus not as resource-demanding to train. Moreover, it’s performance is quite remarkable:

Google RAISR SurferYou can read more details in the paper by Romano, Isodoro, and Milanfar (2016) or watch the research summary below by, unsurprisingly, Two Minute Papers:

I guess you’re eager to test this super resolution out yourself?! letsenhance.io let’s you enhance the resolution of five images for free, after which it charges you $5 per twenty pictures processed. The website feeds the input image to a neural net and puts out an image of which the resolution has been increased four fold! I tested it with this random blurry picture I retrieved from Google/Pinterest.

blurry_picture
Original 500×500

blurry_picture-magic
Enhanced 2000×2000

Do you see how much more detailed (though still blurry) the second image is? Nevertheless, upscaling four times seems about the limit as that is the default factor for both RAISR and Let’s Enhance. I am very curious to see how this super resolution is going to develop in the future, how it will be used to decrease memory or network demands, whether it will be integrated with video platforms like YouTube or Netflix, and which algorithm will ultimately take the crown!

Image result for RAISR
Several algorithms and their upscaled results.