How do scurvy, astronomy, alchemy and data science relate to each other?
In this goto conference presentation, Lucas Vermeer — Director of Experimentation at Booking.com — uses some amazing storytelling to demonstrate how the value of data (science) is largely by organizations capability to gather the right data — the data they actually need.
It’s a definite recommendation to watch for data scientists and data science leaders out there.
Here are the slides, and they contain some great oneliners:
Kevin Markham shares his tips and tricks for the most common data handling tasks on twitter. He compiled the top 100 in this one amazing overview page. Find the hyperlinks to specific sections below!
🐼🤹♂️ pandas trick:
Want to plot a DataFrame? It's as easy as: df.plot(kind='…')
You can use: line 📈 bar 📊 barh hist box 📦 kde area scatter hexbin pie 🥧
By adjusting the three elements in this simple framework, you can build any type of machine learning program.
In the tutorial, Eric shows you how to implement this same framework in Python (using jax) and implement linear regression, logistic regression, and artificial neural networks all in the same way (using gradient descent).
I can’t even begin to explain it as well as Eric does himself, so I highly recommend you watch and code along with the Youtube tutorial (~1 hour):
Have you ever wondered what goes on behind the scenes of a deep learning framework? Or what is going on behind that pre-trained model that you took from Kaggle? Then this tutorial is for you! In this tutorial, we will demystify the internals of deep learning frameworks – in the process equipping us with foundational knowledge that lets us understand what is going on when we train and fit a deep learning model. By learning the foundations without a deep learning framework as a pedagogical crutch, you will walk away with foundational knowledge that will give you the confidence to implement any model you want in any framework you choose.
I love how people are using data and data science to fight fake news these days (see also Identifying Dirty Twitter Bots), and I recently came across another great example.
Conspirador Norteño (real name unkown) is a member of what they call #TheResistance. It’s a group of data scientists discovering and analyzing so-called botnets – networks of artificial accounts on social media websites, like Twitter.
TheResistance uses quantitative analysis to unveil large groups of fake accounts, spreading potential fake news, or fake-endorsing the (fake) news spread by others.
In a recent Twitter thread, Norteno shows how they discovered that many of Dr. Shiva Ayyadurai (self-proclaimed Inventor of Email) his early followers are likely bots.
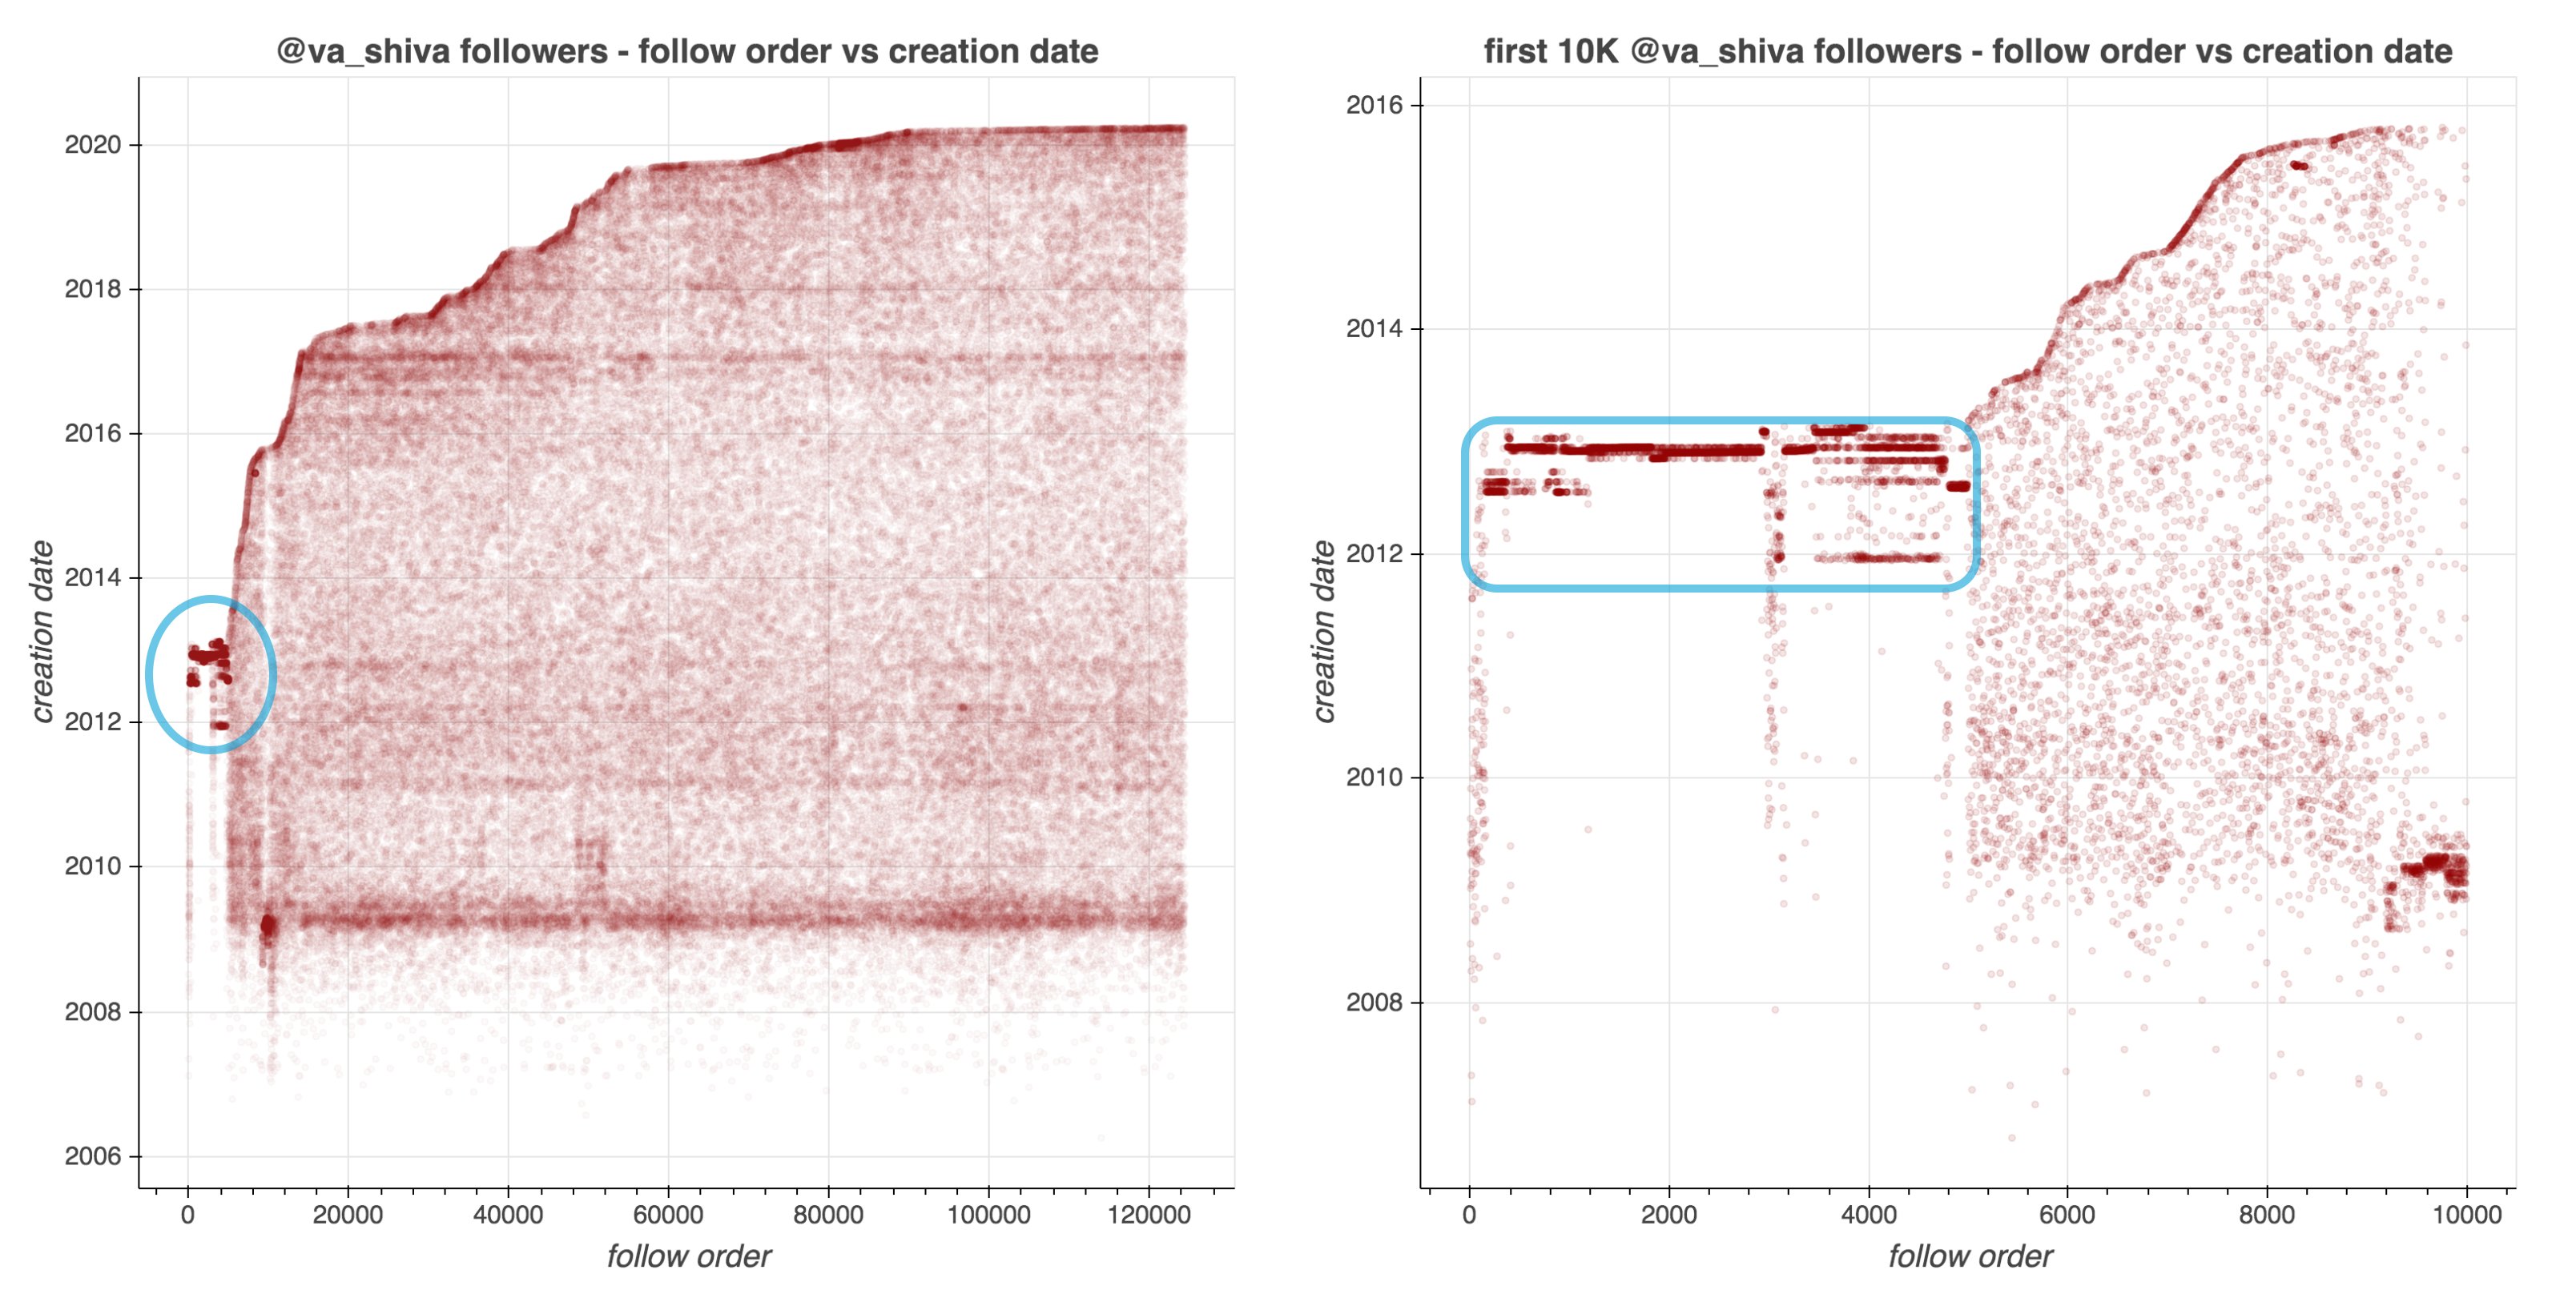
They looked at the date of these accounts started following Shiva, offset by the date of their accounts’ creation. A remarkeable pattern appeared:
Although @va_shiva‘s recent followers look unremarkable, a significant majority of his first 5000 followers appear to have been created in batches and to have subsequently followed @va_shiva in rapid succession.
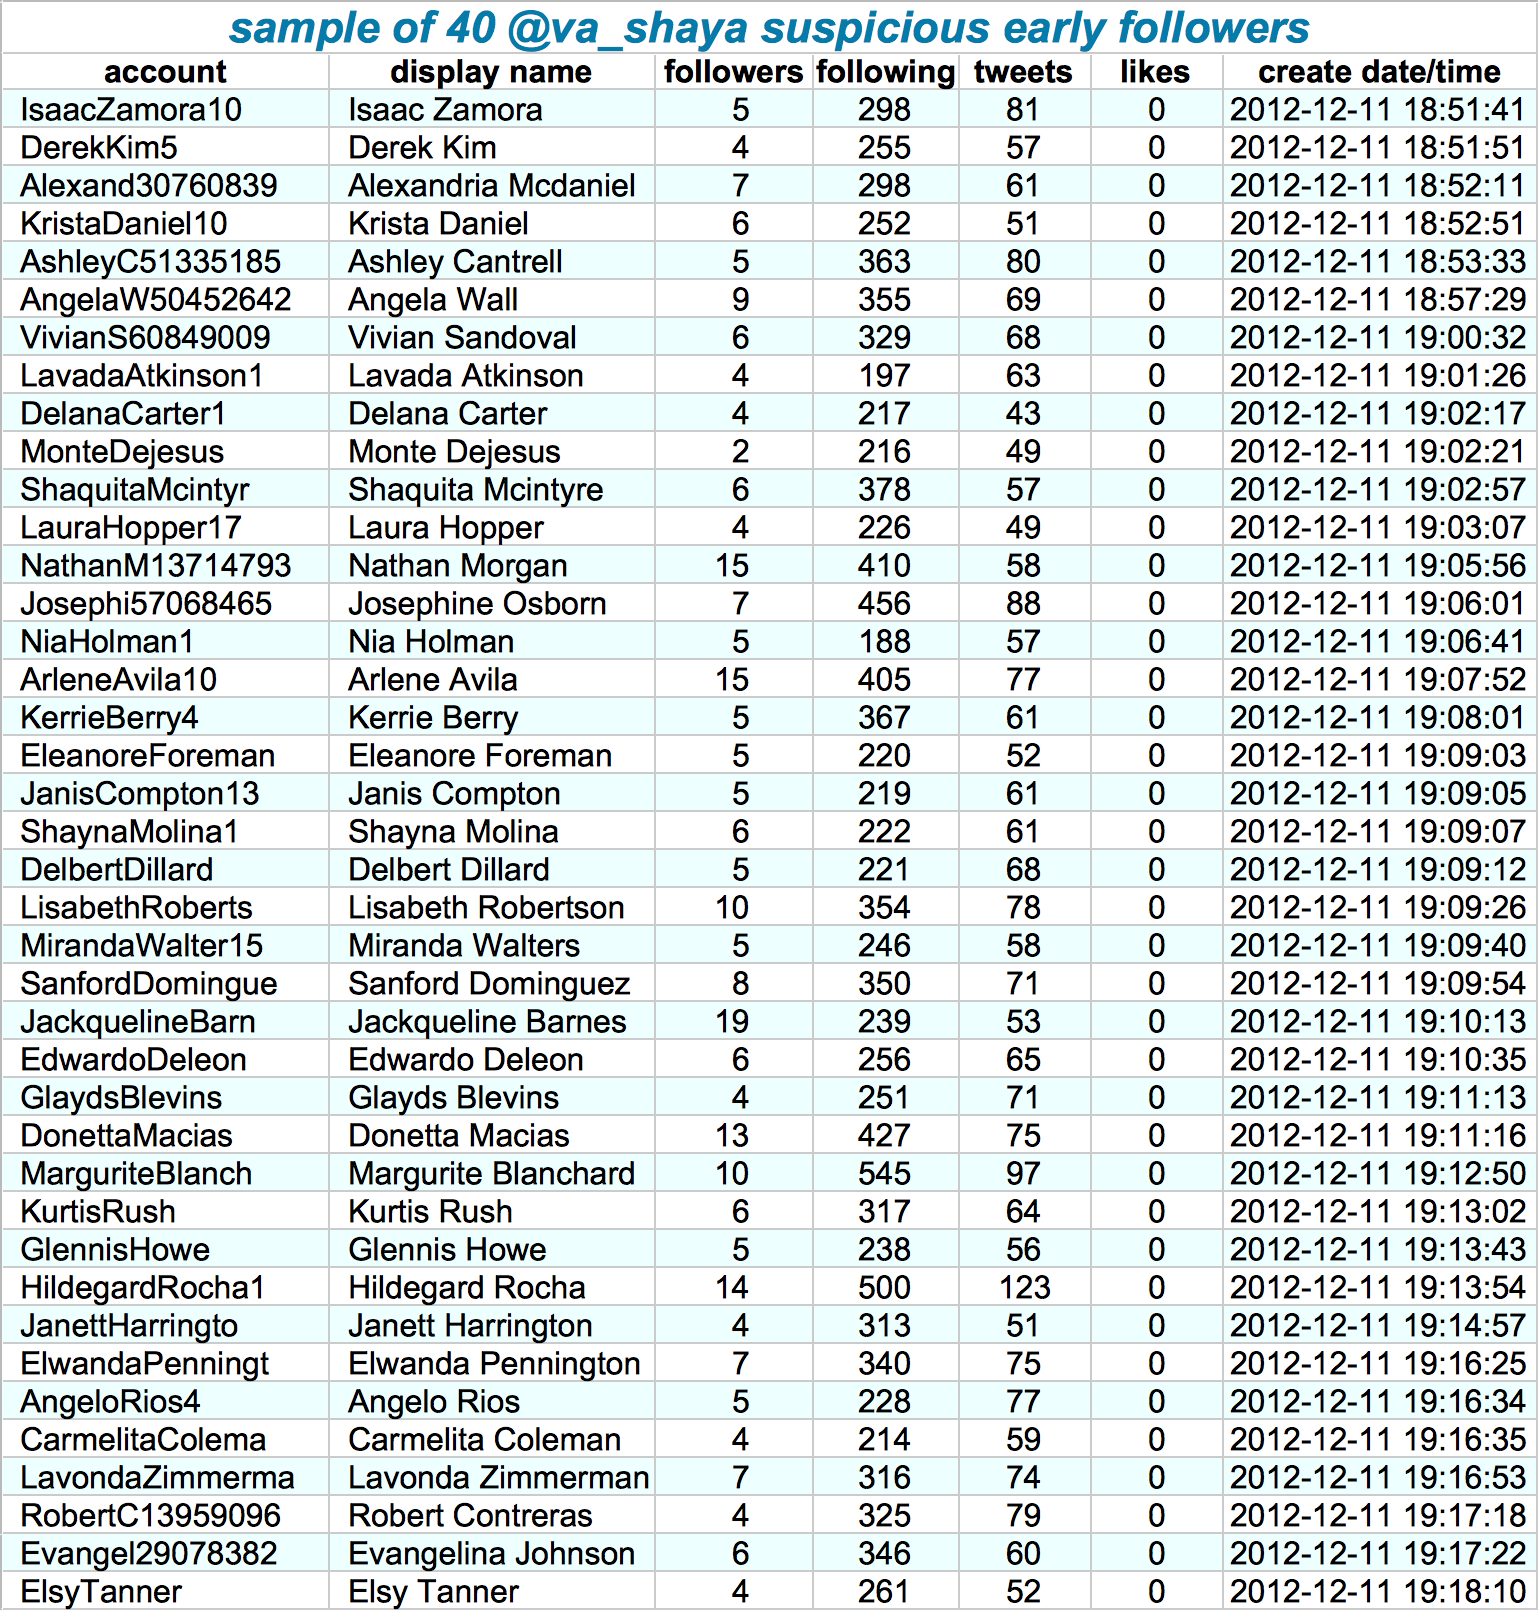
Looking at those followers in more detail, other suspicious patterns emerge. Their names follow a same pattern, they have an about equal amount of followers, followings, tweets, and (no) likes. Moreover, they were created only seconds apart. Many of them seem to follow each other as well.
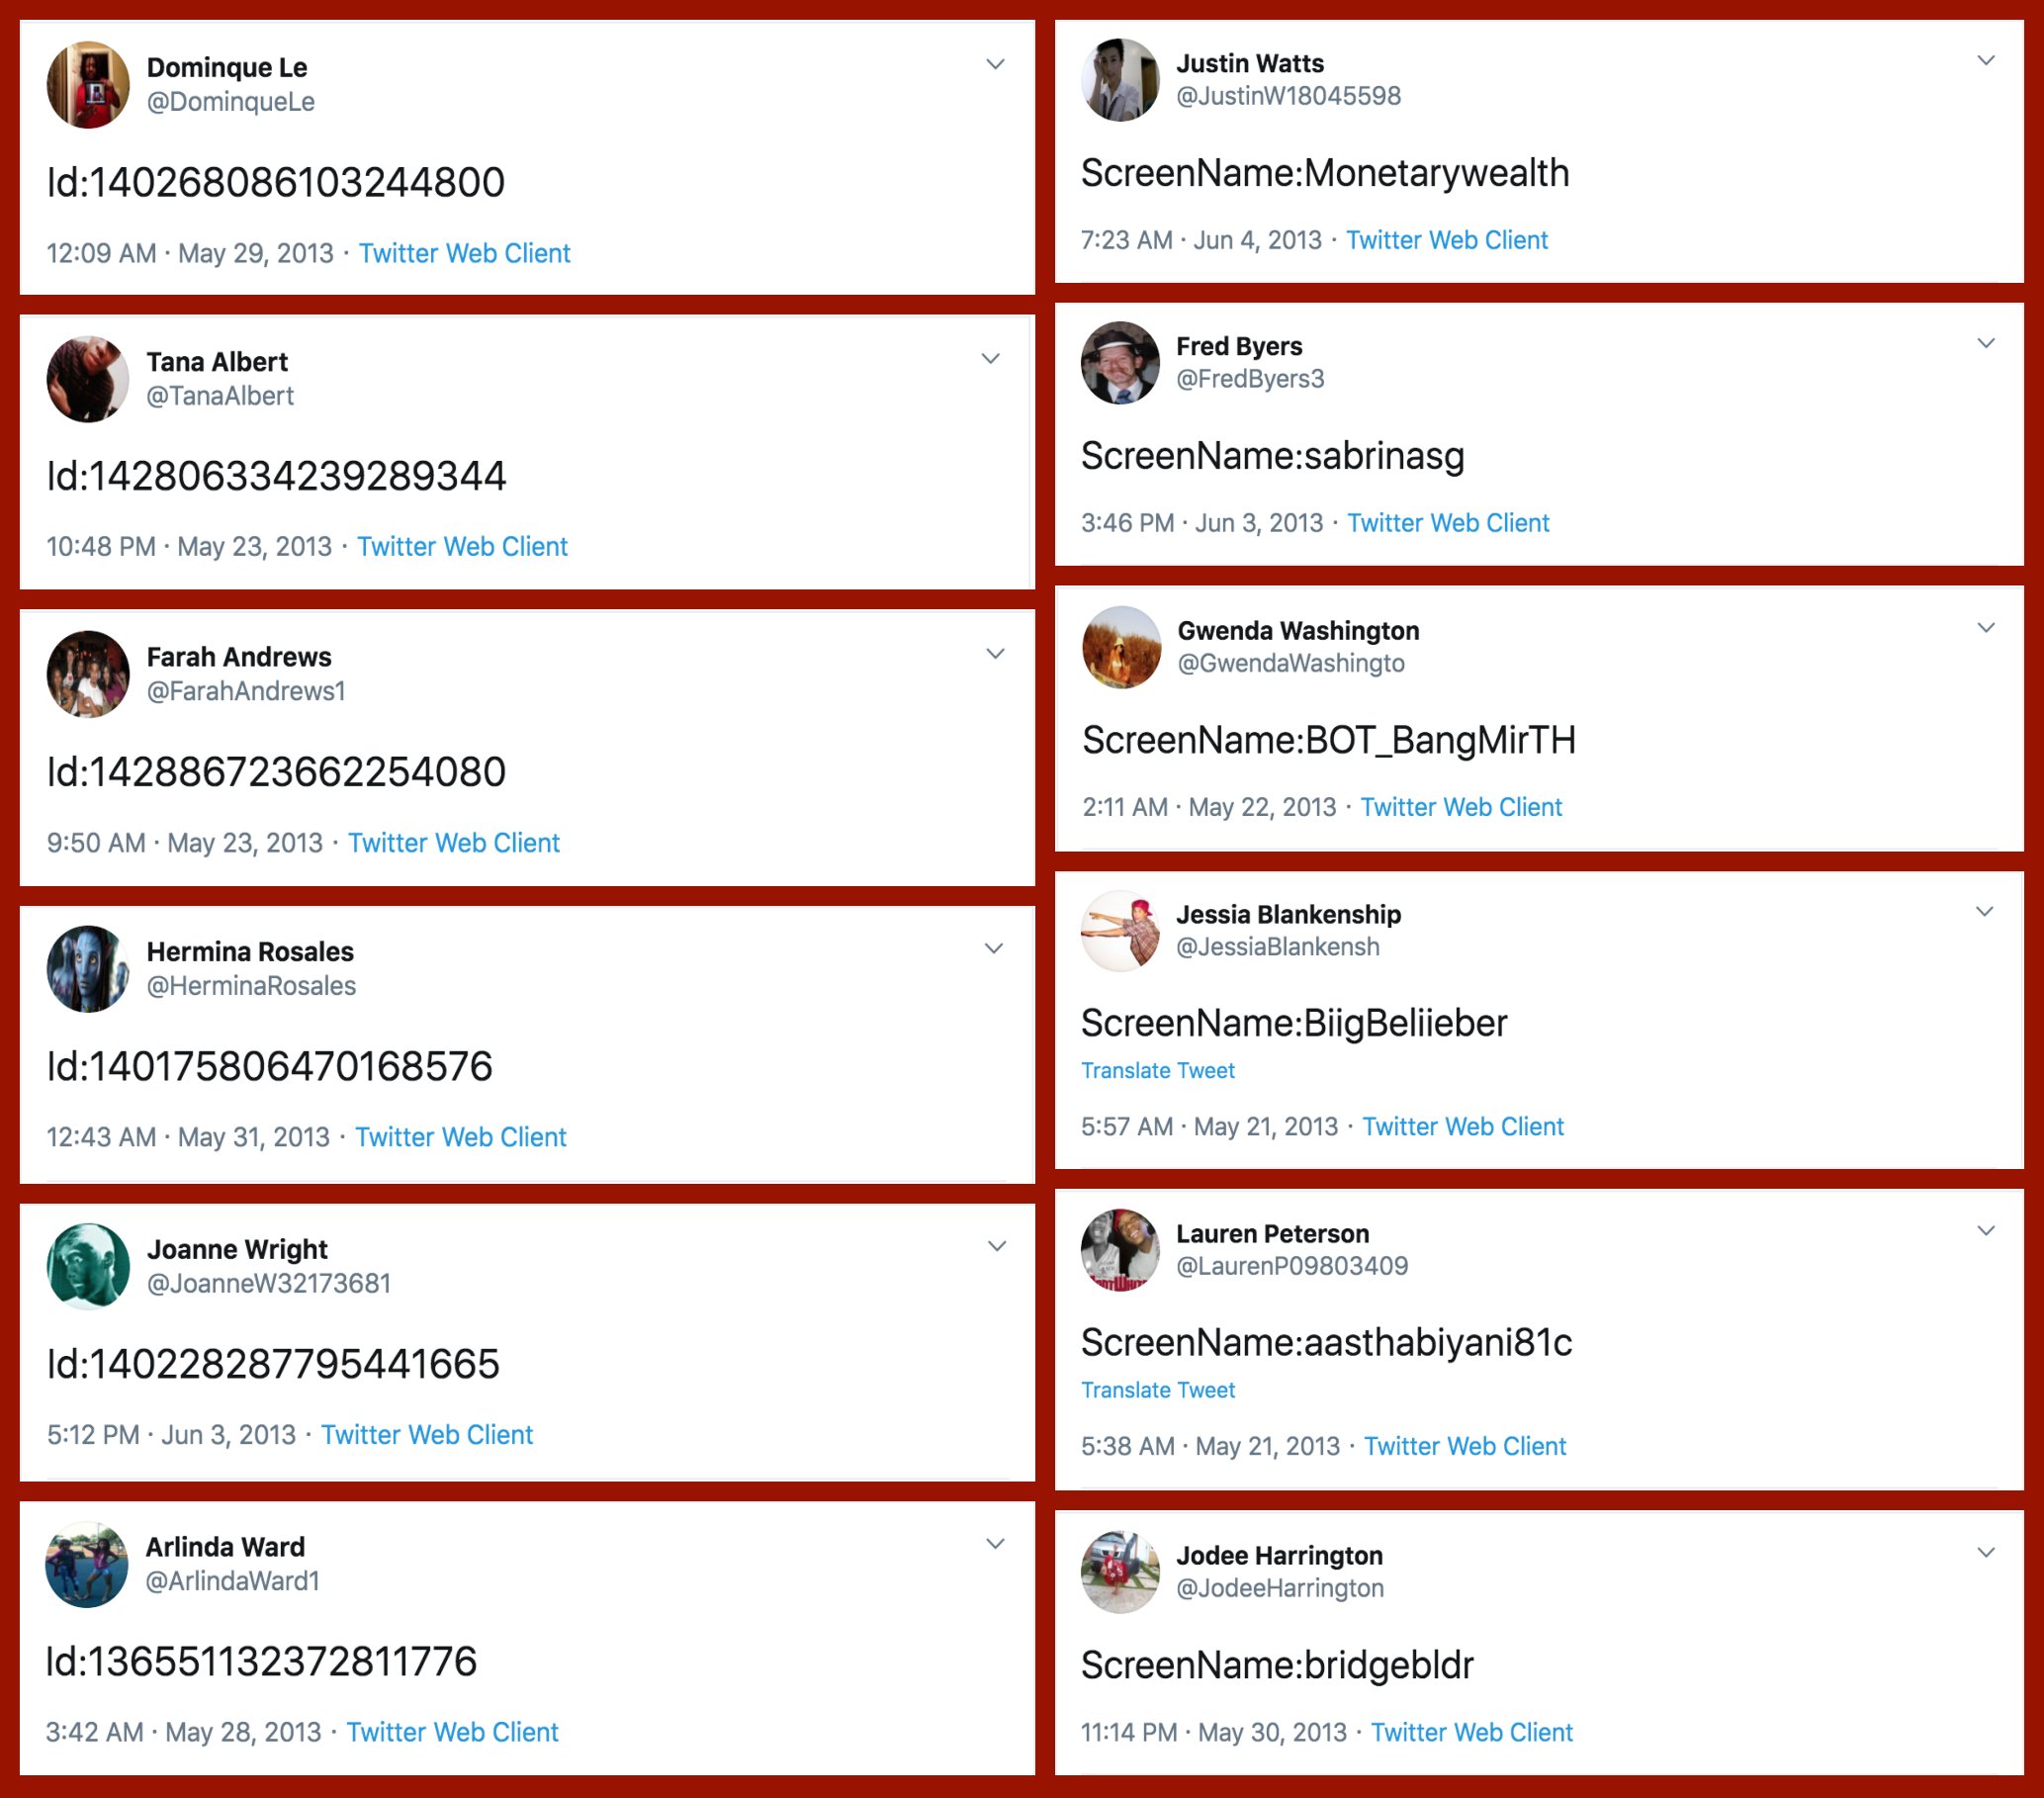
If that wasn’t enough proof of something’s off, here’s a variety of their tweets… Not really what everyday folks would tweet right? Plus similar patterns again across acounts.
At first, I thought, so what? This Shiva guy probably just set up some automated (Python?) scripts to make Twitter account and follow him. Good for him. It worked out, as his most recent 10k followers followed him organically.
However, it becomes more scary if you notice this Shiva guy is (succesfully) promoting the firing of people working for the government:
— Dr.SHIVA Ayyadurai, MIT PhD. Inventor of Email (@va_shiva) April 13, 2020
Anyways, wanted to share this simple though cool approach to finding bots & fake news networks on social media. I hope you liked it, and would love to hear your thoughts in the comments!
Most data scientists favor Python as a programming language these days. However, there’s also still a large group of data scientists coming from a statistics, econometrics, or social science and therefore favoring R, the programming language they learned in university. Now there’s a new kid on the block: Julia.
According to some, you can think of Julia as a mixture of R and Python, but faster. As a programming language for data science, Julia has some major advantages:
Julia is light-weight and efficient and will run on the tiniest of computers
Julia is just-in-time (JIT) compiled, and can approach or match the speed of C
Julia is a functional language at its core
Julia support metaprogramming: Julia programs can generate other Julia programs
Julia has a math-friendly syntax
Julia has refined parallelization compared to other data science languages
Julia can call C, Fortran, Python or R packages
However, others also argue that Julia comes with some disadvantages for data science, like data frame printing, 1-indexing, and its external package management.
Comparing Julia to Python and R
Open Risk Manual published this side-by-side review of the main open source Data Science languages: Julia, Python, R.
You can click the links below to jump directly to the section you’re interested in. Once there, you can compare the packages and functions that allow you to perform Data Science tasks in the three languages.
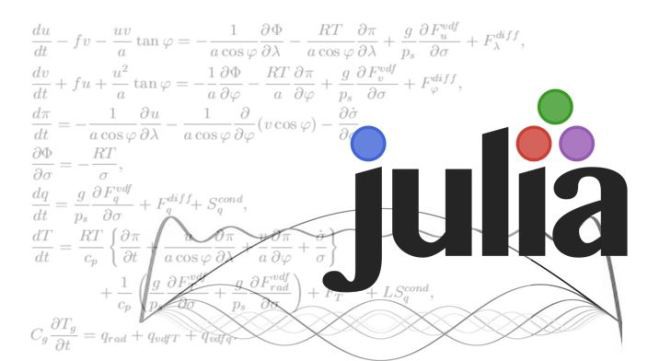
Here’s a very well written Medium article that guides you through installing Julia and starting with some simple Data Science tasks. At least, Julia’s plots look like:
Kirsten Kehrer from datamovesme.com does all kinds of super valuable stuff in SQL and end of 2019 she decided to share it with the world via a free SQL course.
Kirsten advises to take the course with dual monitors, as she also provides an online SQL query builder environment, where you can write your queries during the videos.
A nice touch is that Kirsten simulated some data for a fictitious e-commerce company, that really allows you to get a feel for the type of data you’d be working with in practice:


