I came across this opinionated though informed commentary by Vinay Prasad on the recent Nature article where Google’s machine learning experts trained models to predict whether scans of patients’ breasts (mammogram’s) show cancerous cells or not.
Vinay Prasad [official bio] is a practicing hematologist-oncologist and Associate Professor of Medicine at Oregon Health and Science University. So he knows what he’s talking about.
He argues that “cancer screening is the LAST thing you should pick FIRST to work on with AI”. Which is an interesting statement in and of itself.
Regardless of my personal opinion on the topic, I found the paper, Vinay’s commentary, and the broader discussion on twitter very interesting and educational to read. I feel it shows how important it is to know the context in which you are applying machine learning. What tremendous value it provides to have domain experts in the same team as the data and machine learning experts.
Kirsten Kehrer from datamovesme.com does all kinds of super valuable stuff in SQL and end of 2019 she decided to share it with the world via a free SQL course.
Kirsten advises to take the course with dual monitors, as she also provides an online SQL query builder environment, where you can write your queries during the videos.
A nice touch is that Kirsten simulated some data for a fictitious e-commerce company, that really allows you to get a feel for the type of data you’d be working with in practice:
We can’t just throw data into machines and expect to see any meaning […], we need to think [about this]. I see a strong trend in the practitioners community to just automate everything, to just throw data into a black box and expect to get money out of it, and I really don’t believe in that.
All pictures below are slides from the above video.
My summary / interpretation
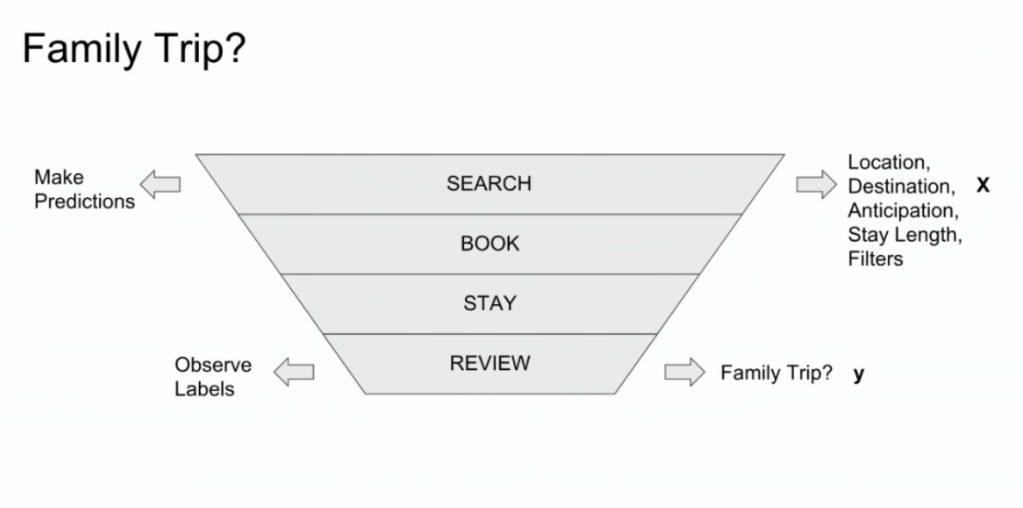
Lucas highlights an example he has been working on at Booking.com, where they seek to predict which searching activities on their website are for family trips.
What happens is that people forget to specify that they intend to travel as a family, forget to input one/two/three child travellers will come along on the trip, and end up not being able to book the accomodations that come up during their search. If Booking.com would know, in advance, that people (may) be searching for family accomodations, they can better guide these bookers to family arrangements.
The problem here is that many business processes in real life look and act like a funnel. Samples drop out of the process during the course of it. So too the user search activity on Booking.com’s website acts like a funnel.
People come to search for arrangements
Less people end up actually booking arrangements
Even less people actually go on their trip
And even less people then write up a review
However, only for those people that end up writing a review, Booking.com knows 100% certain that they it concerned a family trip, as that is the moment the user can specify so. Of all other people, who did not reach stage 4 of the funnel, Booking.com has no (or not as accurate an) idea whether they were looking for family trips.
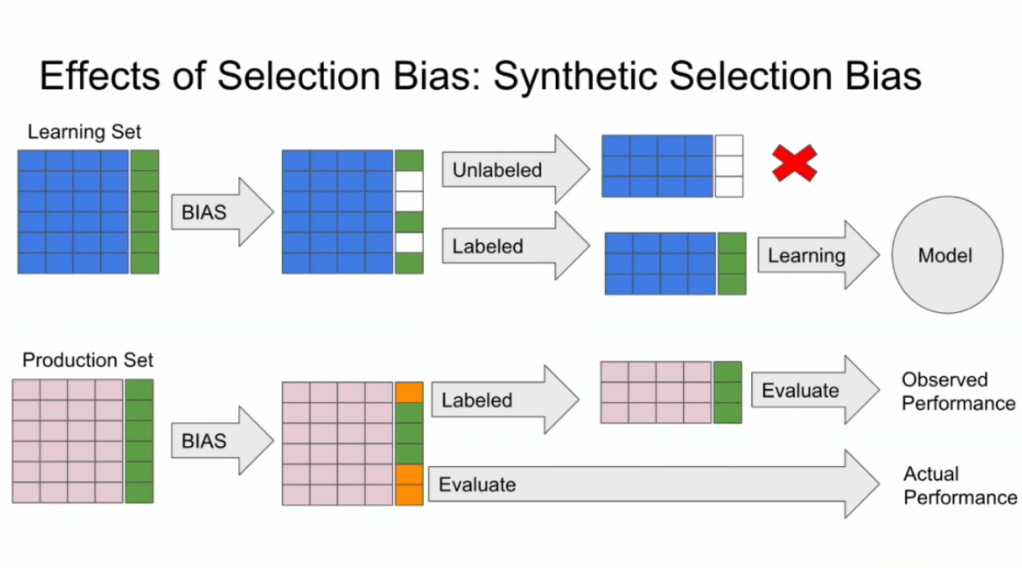
Such a funnel thus inherently produces business data with selection bias in it. Only for people making it to the review stage we know whether they were family trips or not. And only those labeled data can be used to train our machine learning model.
And now for the issue: if you train and evaluate a machine learning model on data generated with such a selection bias, your observed performance metrics will not reflect the actual performance of your machine learning model!
Actually, they are pretty much overestimates.
This is very much an issue, even though many ML practitioners don’t see aware. Selection bias makes us blind as to the real performance of our machine learning models. It produces high variance in the region of our feature space where labels are missing. This leads us to being overconfident in our ability to predict whether some user is looking for a family trip. And if the mechanism causing the selection bias is still there, we could never find out that we are overconfident. Consistently estimating, say, 30% of people are looking for family trips, whereas only 25% are.
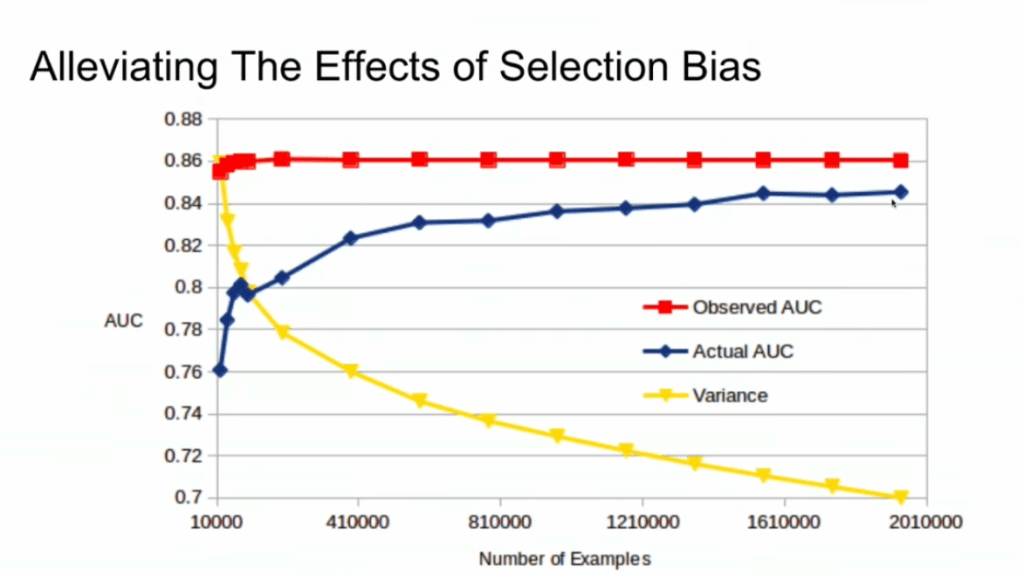
Fortunately, Lucas proposes a very simple solution! Just adding more observations can (partially) alleviate this detrimental effect of selection bias. Although our bias still remains, the variance goes down and the difference between our observed and actual performance decreases.
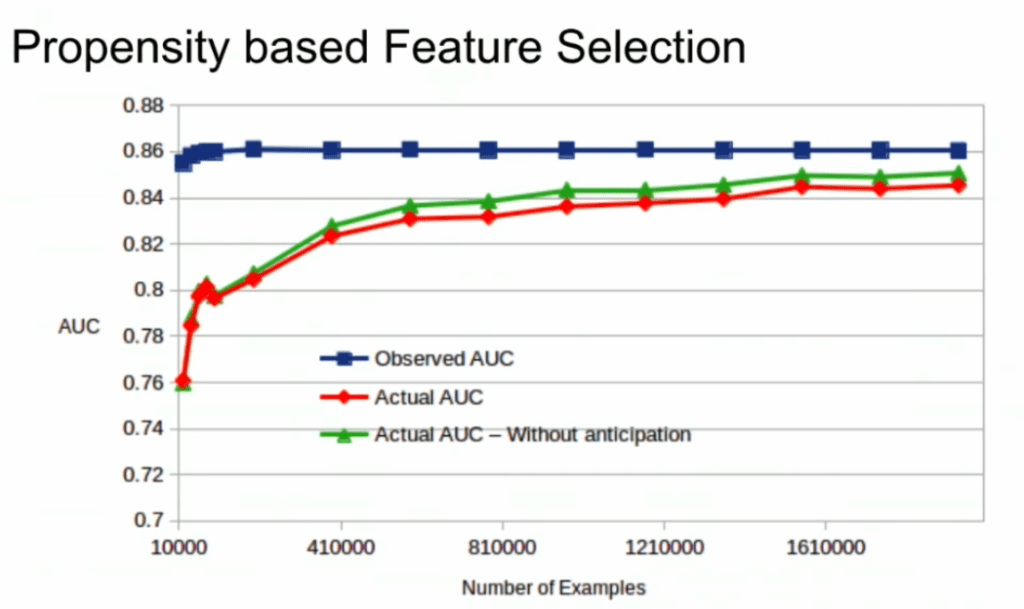
A second issue and solution to selection bias relates to propensity (see also): the extent to which your features X influence not only the outcome Y, but also the selection criteria s.
If our features X influence both the outcome Y but also the selection criteria s, selection bias will occur in your data and can thus screw up your conclusion. In order to inspect to what extent this occurs in your setting, you will want to estimate a propensity model. If that model is good, and X appears valuable in predicting s, you have a selection bias problem.
Via a propensity model s ~ X, we quantify to what extent selection bias influences our data and model. The nice thing is that we, as data scientists, control the features X we use to train a model. Hence, we could just use only features X that do not predict s to predict Y. Conclusion: we can conduct propensity-based feature selection in our Y ~ X by simply avoiding features X that predicted s!
Still, Lucas does point that this becomes difficult when you have valuable features that predict both s and Y. Hence, propensity-based feature selection may end up cost(ing) you performance, as you will need to remove features relevant to Y.
I found this interesting blog by Guilherme Duarte Marmerola where he shows how the predictions of algorithmic models (such as gradient boosted machines, or random forests) can be calibrated by stacking a logistic regression model on top of it: by using the predicted leaves of the algorithmic model as features / inputs in a subsequent logistic model.
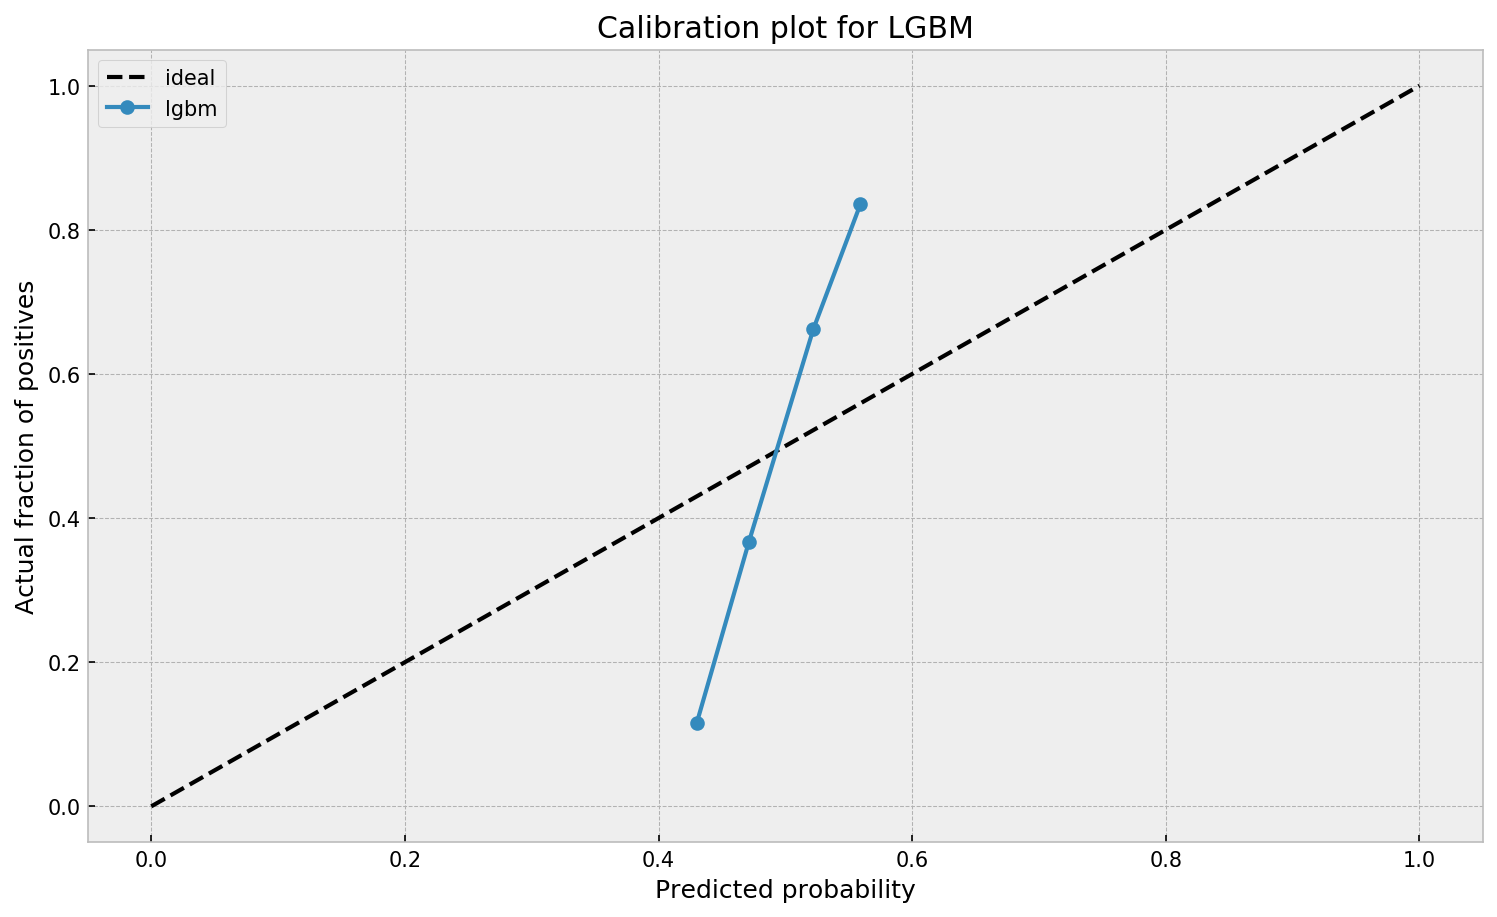
When working with ML models such as GBMs, RFs, SVMs or kNNs (any one that is not a logistic regression) we can observe a pattern that is intriguing: the probabilities that the model outputs do not correspond to the real fraction of positives we see in real life.
This is visible in the predictions of the light gradient boosted machine (LGBM) Guilherme trained: its predictions range only between ~ 0.45 and ~ 0.55. In contrast, the actual fraction of positive observations in those groups is much lower or higher (ranging from ~ 0.10 to ~0.85).
I highly recommend you look at Guilherme’s code to see for yourself what’s happening behind the scenes, but basically it’s this:
Train an algorithmic model (e.g., GBM) using your regular features (data)
Retrieve the probabilities GBM predicts
Retrieve the leaves (end-nodes) in which the GBM sorts the observations
Turn the array of leaves into a matrix of (one-hot-encoded) features, showing for each observation which leave it ended up in (1) and which not (many 0’s)
Basically, until now, you have used the GBM to reduce the original features to a new, one-hot-encoded matrix of binary features
Now you can use that matrix of new features as input for a logistic regression model predicting your target (Y) variable
Apparently, those logistic regression predictions will show a greater spread of probabilities with the same or better accuracy
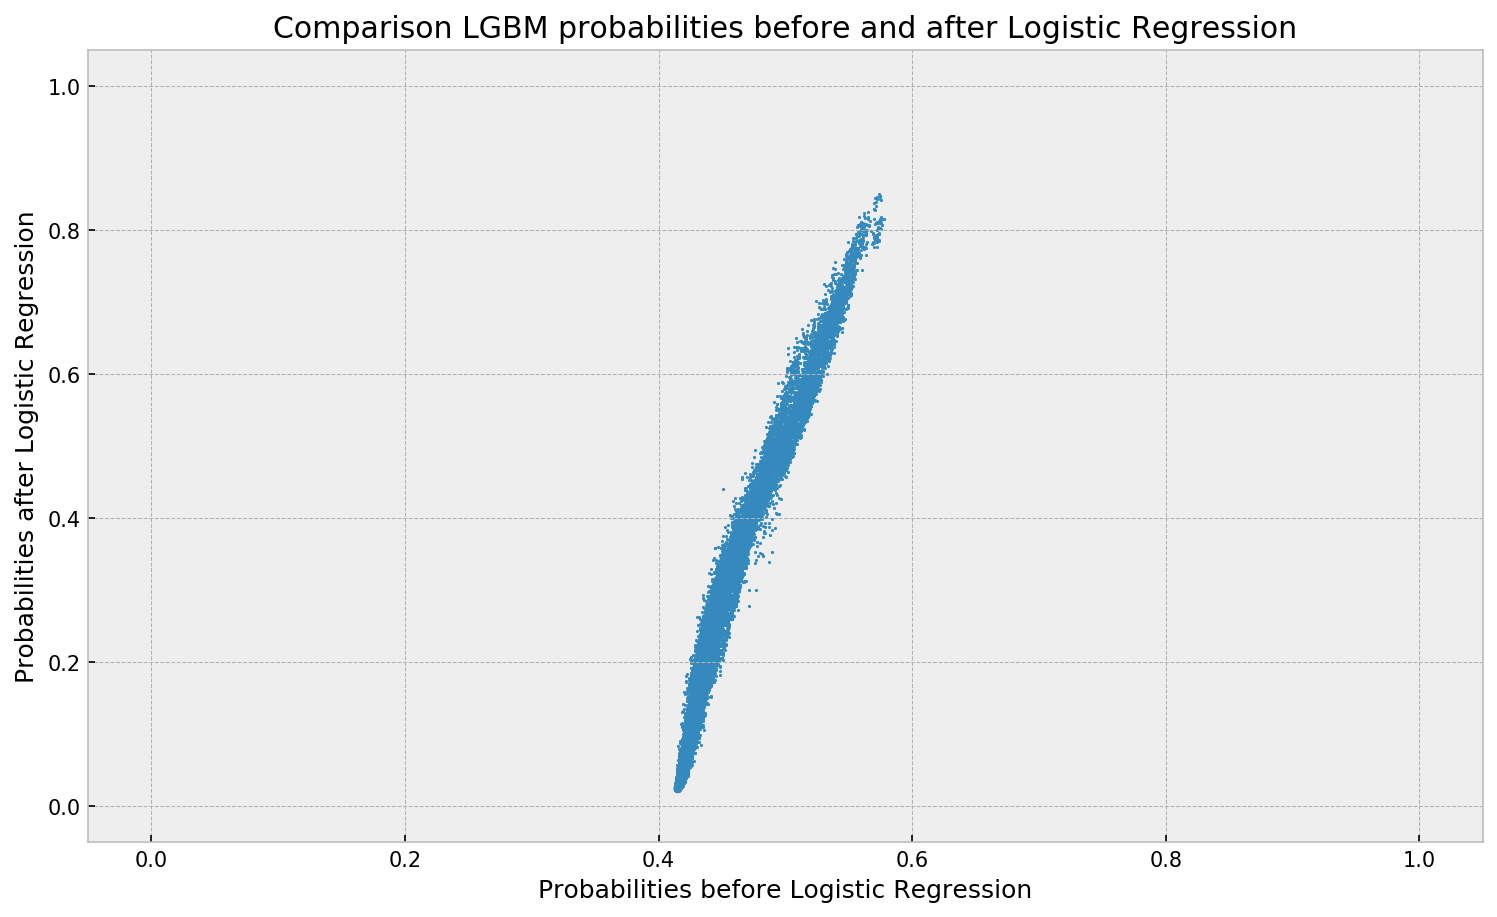
Here’s a visual depiction from Guilherme’s blog, with the original GBM predictions on the X-axis, and the new logistic predictions on the Y-axis.
As you can see, you retain roughly the same ordering, but the logistic regression probabilities spread is much larger.
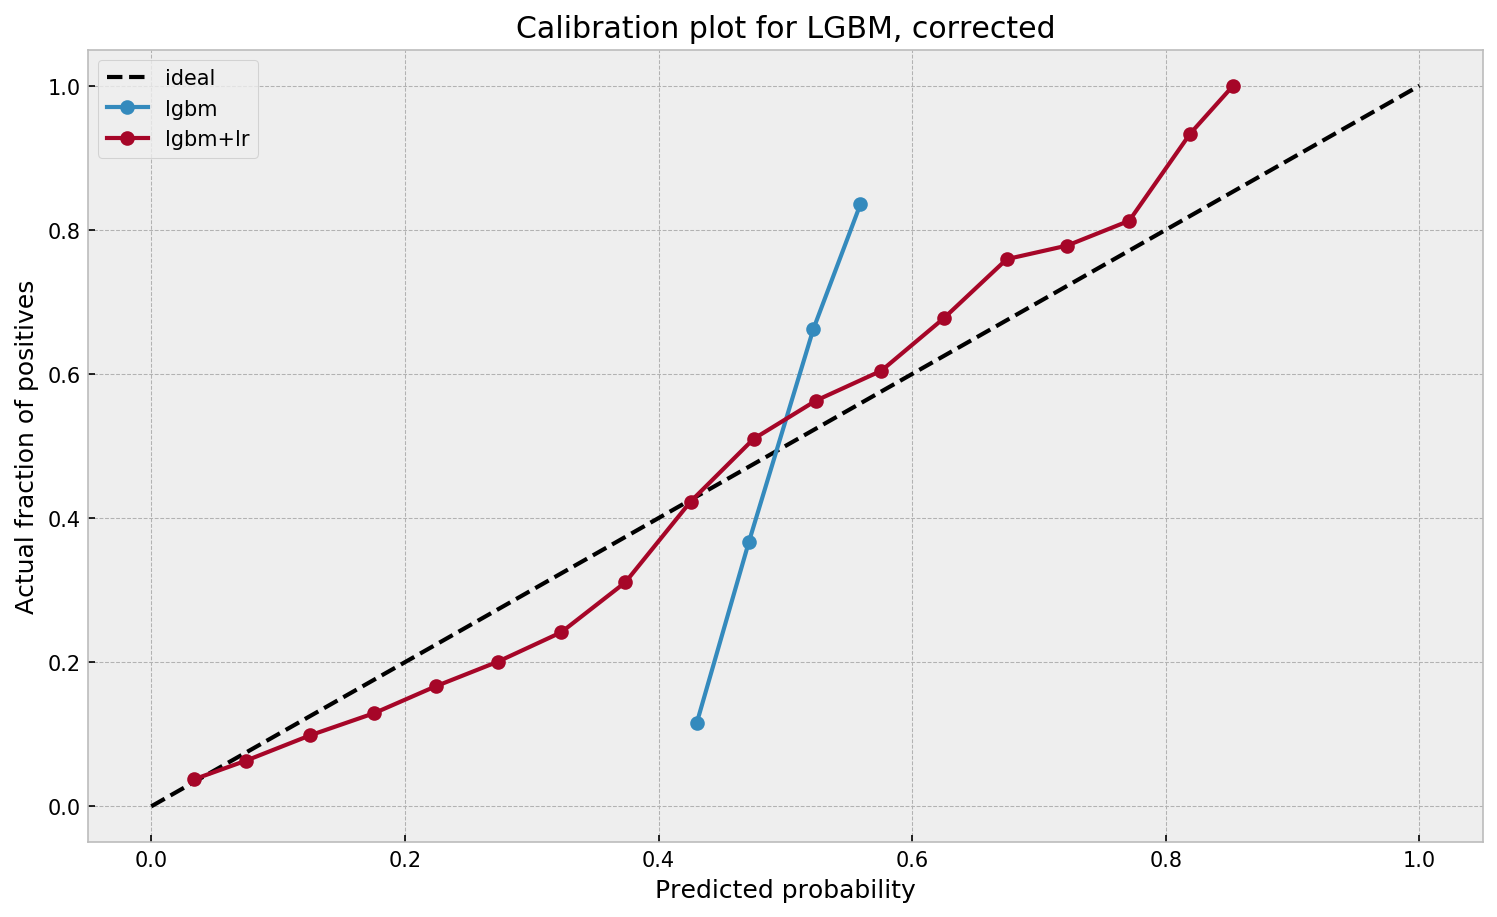
Now according to Guilherme and the Facebook paper he refers to, the accuracy of the logistic predictions should not be less than those of the original algorithmic method.
Much better. The calibration plot of lgbm+lr is much closer to the ideal. Now, when the model tells us that the probability of success is 60%, we can actually be much more confident that this is the true fraction of success! Let us now try this with the ET model.
In his blog, Guilherme shows the same process visually for an Extremely Randomized Trees model, so I highly recommend you read the original article. Also, you can find the complete code on his GitHub.
PyData is famous for it’s great talks on machine learning topics. This 2019 London edition, Vincent Warmerdamagain managed to give a super inspiring presentation. This year he covers what he dubs Artificial Stupidity™. You should definitely watch the talk, which includes some great visual aids, but here are my main takeaways:
Vincent speaks of Artificial Stupidity, of machine learning gone HorriblyWrong™ — an example of which below — for which Vincent elaborates on three potential fixes:
Example of a model that goes HorriblyWrong™, according to Vincent’s talk.
1. Predict Less, but Carefully
Vincent argues you shouldn’t extrapolate your predictions outside of your observed sampling space. Even better: “Not predicting given uncertainty is a great idea.” As an alternative, we could for instance design a fallback mechanism, by including an outlier detection model as the first step of your machine learning model pipeline and only predict for non-outliers.
I definately recommend you watch this specific section of Vincent’s talk because he gives some very visual and intuitive explanations of how extrapolation may go HorriblyWrong™.
Be careful! One thing we should maybe start talking about to our bosses: Algorithms merely automate, approximate, and interpolate. It’s the extrapolation that is actually kind of dangerous.
Vincent Warmerdam @ Pydata 2019 London
Basically, we can choose to not make automated decisions sometimes.
2. Constrain thy Features
What we feed to our models really matters. […] You should probably do something to the data going into your model if you want your model to have any sort of fairness garantuees.
Vincent Warmerdam @ Pydata 2019 London
Often, simply removing biased features from your data does not reduce bias to the extent we may have hoped. Fortunately, Vincent demonstrates how to remove biased information from your variables by applying some cool math tricks.
Unfortunately, doing so will often result in a lesser predictive accuracy. Unsurprisingly though, as you are not closely fitting the biased data any more. What makes matters more problematic, Vincent rightfully mentions, is that corporate incentives often not really align here. It might feel that you need to pick: it’s either more accuracy or it’s more fairness.
However, there’s a nice solution that builds on point 1. We can now take the highly accurate model and the highly fair model, make predictions with both, and when these predictions differ, that’s a very good proxy where you potentially don’t want to make a prediction. Hence, there may be observations/samples where we are comfortable in making a fair prediction, whereas in most other situations we may say “right, this prediction seems unfair, we need a fallback mechanism, a human being should look at this and we should not automate this decision”.
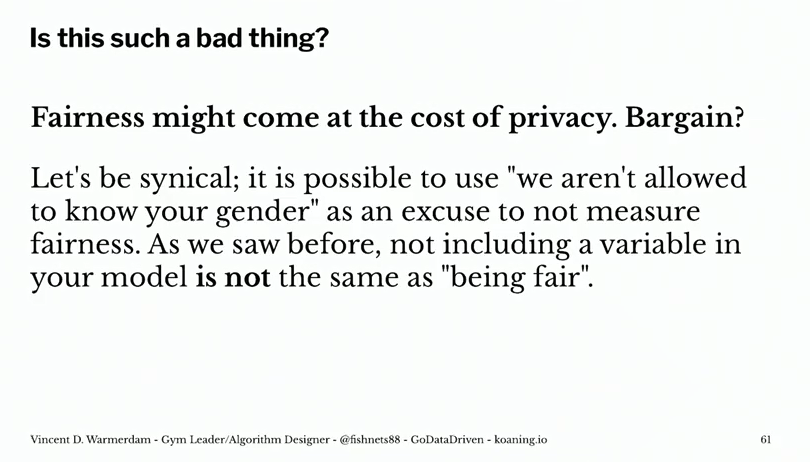
Vincent does not that this is only one trick to constrain your model for fairness, and that fairness may often only be fair in the eyes of the beholder. Moreover, in order to correct for these biases and unfairness, you need to know about these unfair biases. Although outside of the scope of this specific topic, Vincent proposes this introduces new ethical issues:
Basically, we can choose to put our models on a controlled diet.
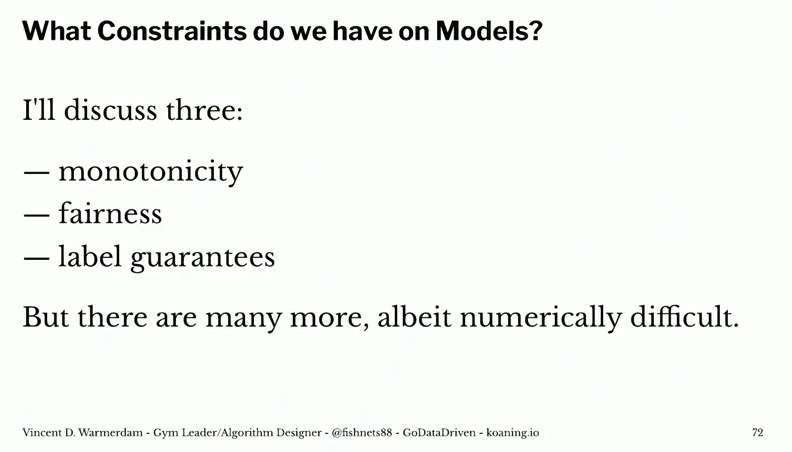
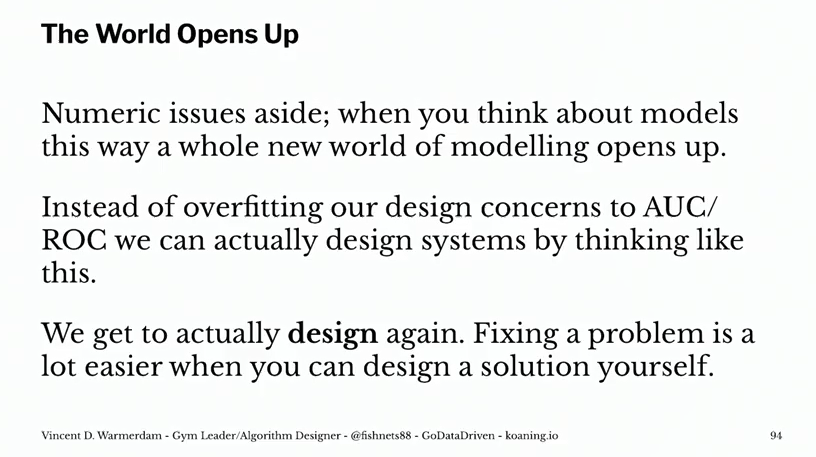
3. Constrain thy Model
Vincent argues that we should include constraints (based on domain knowledge, or common sense) into our models. In his presentation, he names a few. For instance, monotonicity, which implies that the relationship between X and Y should always be either entirely non-increasing, or entirely non-decreasing. Incorporating the previously discussed fairness principles would be a second example, and there are many more.
If we every come up with a model where more smoking leads to better health, that’s bad. I have enough domain knowledge to say that that should never happen. So maybe I should just make a system where I can say “look this one column with relationship to Y should always be strictly negative”.
Vincent Warmerdam @ Pydata 2019 London
Basically, we can integrate domain knowledge or preferences into our models.
Just sitting there. Waiting to be opened, read. For months already.
The sender, you ask? Me. Paul van der Laken.
A nuisance that guy, I tell you. He keeps sending me reminders, of stuff to do, books to read. Books he’s sure a more productive me would enjoy.
Now, I could wipe my inbox. Be done with it. But I don’t wan’t to lose this digital to-do list… Perhaps I should put them here instead. So you can help me read them!
Each of the below links represents a formidable book on programming! (I hear) And there are free versions! Have a quick peek. A peek won’t hurt you:
Disclaimer: This page contains one or more links to Amazon. Any purchases made through those links provide us with a small commission that helps to host this blog.
Applied Predictive Modelling – by Max Kuhn & Kjell Johnson
The books listed above have a publicly accessible version linked. Some are legitimate. Other links are somewhat shady. If you feel like you learned something from reading one of the books (which you surely will), please buy a hardcopy version. Or an e-book. At the very least, reach out to the author and share what you appreciated in his/her work. It takes valuable time to write a book, and we should encourage and cherish those who take that time.