Talent.Works is back, elaborating on the applicant characteristics that relate to landing an interview. While the majority of applicants has a meager ~2% chance of getting invited to an interview, some applicants do way better! What accounts for their success?
Tilburg University has set up a masterclass Predictive HR Analytics. In 3 days, the Professional Learning program will teach you all you need to know to implement predictive analytics and take HR to the next level. More information can be found here.
What makes this program unique?
The masterclass Predictive HR Analytics goes beyond HR analytics and focuses on transformational people predictions. You learn how to embed predictive HR analytics into your HR Strategy and how to use your findings to convince others.
The masterclass is developed at the prestigious Human Resources department at Tilburg University, which has obtained international recognition with its high-quality academic research in the HRM field.
The mix of professors in conjunction with leading HR professionals leads to a strong academic program with a practical approach.
Your peer participants will make sure that the class opens up a high-quality network of HR specialists. The diversity of leading companies from different sectors in the classroom creates new insights for all the participants.
The program is like a 3-day pressure cooker. By combining online and offline components, we can create more in-depth discussions in the classroom.
You will experience a high impact on your daily practice, since the program is focused on direct implementation.
Your profile
This course is ideal for anyone in HR seeking to become more adept in using quantitative data for decision making. Typical participants are (future) HR analysts, HR managers, HR business partners, HR consultants and (financial) business analysts with a strong link on people resources. Participants are from various sectors, such as financial services, healthcare institutions, government agencies and business services.
Searching and applying to jobs can be a costly activity, requiring many hours upon hours of perfecting your motivation letter and CV. Hence, it can be very frustrating to get ghosted (not receiving a reply) for a job. Luckily, Talent Works is able to give us some general tips when it comes to improving the success of your applications. You might remember them from their Interactive Map of the US Job Market.
Using a sample of about 1600 job applications, Talent Works recently conducted all kinds of statistical analyses to look at the hiring process. For instance, they examined the time it takes to get from the application stage to your first day on the job. Split out for various jobs, it seems Mechanical Engineers spend quite a while in the interview stage whereas Software developers are put to work within three weeks.
The numbers of days spent in each application stage per job (Talent.Works)
In a different analysis, Talent Works examined how to minimize your risk of getting ghosted on a job application. For instance, they found that during the “Golden Hours” (the first 96 hours after a job gets posted), your chances of getting an invitation for an interview are up to 8 times higher than afterwards.
If you submit a job application in the first 96 hours, you’re up to 8x more likely to get an interview. After that, every day you wait reduces your chances by 28% (Talent.Works)
Based on the above they come to the following three timeframes in the application cycle:
“Golden Hours”: Applications submitted between 2-4 days after a job is posted have the highest chance of getting an interview. Not only is there a difference, there’s a big difference: you have up to an 8x higher chance of getting an interview during this period, even if you’re submitting the same application.
Twilight Zone: Chances quickly decrease from OK to really bad: every day you wait after the “Golden Hours” reduces your chances by 28%. The longer you wait, the higher the risk that employers have already checked their inboxes and setup interviews with candidates that met their “good enough”-bar.
Resume Blackhole: According to Talent.Works it’s nearly not worth applying after 10 days. On average, job applications during this phase have a meager ~1.5% of getting an interview. Put another way, if you send out 50 job applications, you might hear back from one (if you’re lucky).
Next, Talent.Works investigated on a more granular level what would then be the best time to apply for a job.This resulted in the following figure
The best time to apply for a job is between 6am and 10am. During this time, you have an 13% chance of getting an interview — nearly 5x as if you applied to the same job after work. Whatever you do, don’t apply after 4pm (Talent.Works)
Again, they provide a summary of their conclusions:
The best time to apply for a job is between 6am and 10am. During this time, you have an 13% chance of getting an interview.
After that morning window, your interview odds start falling by 10% every 30 minutes. If you’re late, you’re going to pay dearly.
There’s a brief reprieve during lunchtime, where your odds climb back up to 11% at around 12:30pm but then start falling precipitously again.
The single-worst time to apply for a job is after work — if you apply at 7:30pm, you have less than a 3% chance of getting an interview.
If you want to see more, please visit Talent.Works. Here, you can let them process your CV and help you improve your hiring chances (see also this blog post).
Simpson (1951) demonstrated that a statistical relationship observed within a population—i.e., a group of individuals—could be reversed within all subgroups that make up that population. This phenomenon, where X seems to relate to Y in a certain way, but flips direction when the population is split for W, has since been referred to as Simpson’s paradox. Others names, according to Wikipedia, include the Simpson-Yule effect, reversal paradox or amalgamation paradox.
The most famous example has to be the seemingly gender-biased Berkeley admission rates:
“Examination of aggregate data on graduate admissions to the University of California, Berkeley, for fall 1973 shows a clear but misleading pattern of bias against female applicants. Examination of the disaggregated data reveals few decision-making units that show statistically significant departures from expected frequencies of female admissions, and about as many units appear to favor women as to favor men. If the data are properly pooled, taking into account the autonomy of departmental decision making, thus correcting for the tendency of women to apply to graduate departments that are more difficult for applicants of either sex to enter, there is a small but statistically significant bias in favor of women. […] The bias in the aggregated data stems not from any pattern of discrimination on the part of admissions committees, which seem quite fair on the whole, but apparently from prior screening at earlier levels of the educational system.” – part of abstract of Bickel, Hammel, & O’Connel (1975)
In a table, the effect becomes clear. While it seems as if women are rejected more often overall, women are actually less often rejected on a departmental level. Women simply applied to more selective departments more often (E & C below), resulting in the overall lower admission rate for women (35% as opposed to 44% for men).
Simpsons Paradox can easily occur in organizational or human resources settings as well. Let me run you through two illustrated examples, I simulated:
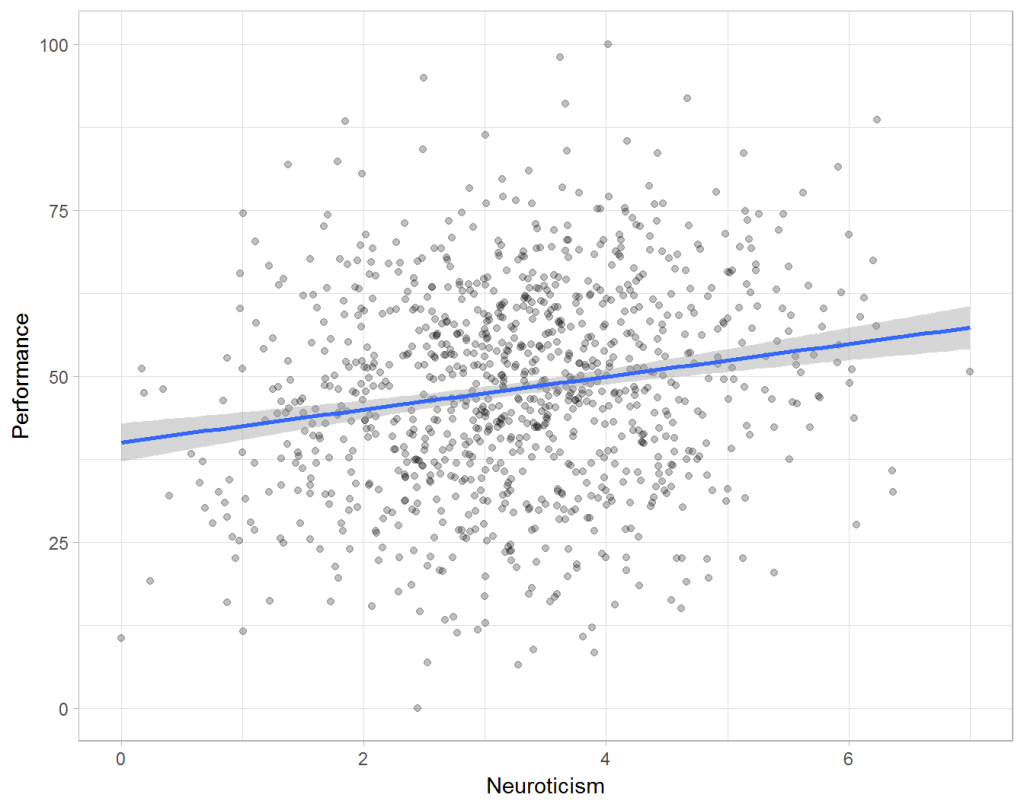
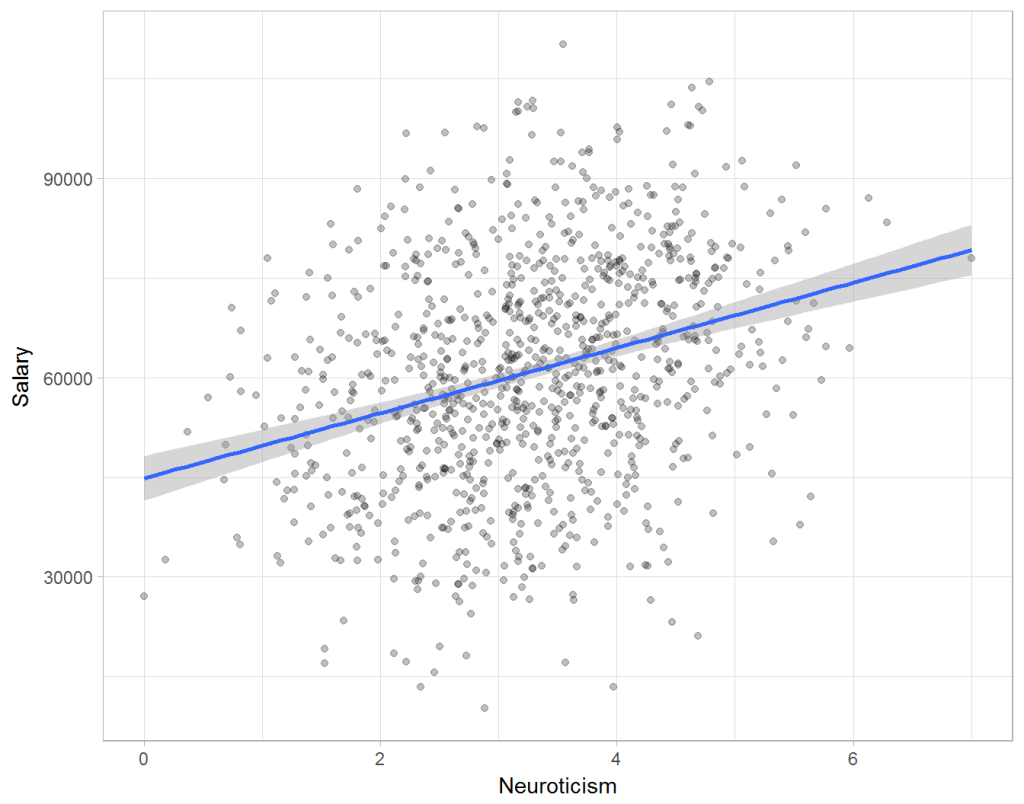
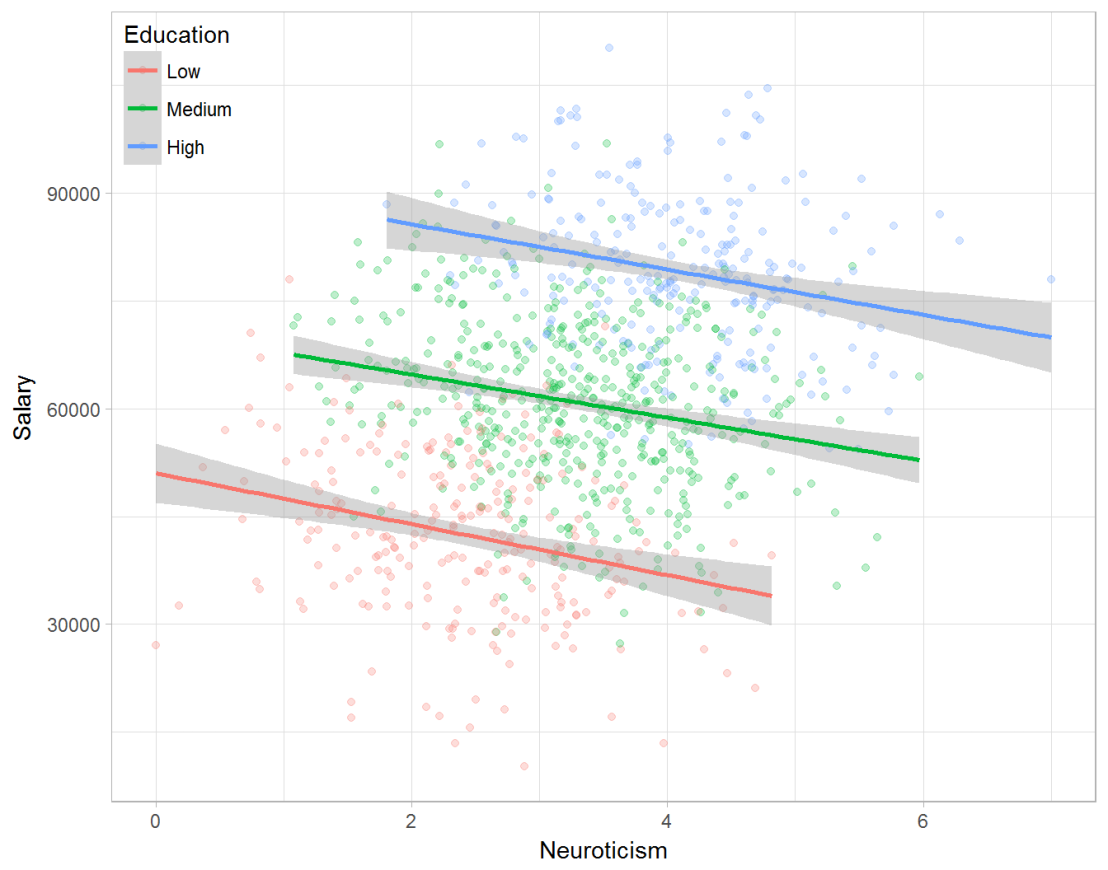
Assume you run a company of 1000 employees and you have asked all of them to fill out a Big Five personality survey. Per individual, you therefore have a score depicting his/her personality characteristic Neuroticism, which can run from 0 (not at all neurotic) to 7 (very neurotic). Now you are interested in the extent to which this Neuroticism of employees relates to their Job Performance (measured 0 – 100) and their Salary (measured in Euro’s per Year). In order to get a sense of the effects, you may decide to visualize both these relations in scatter plots:
From these visualizations it would look like Neuroticism relates significantly and positively to both employees’ performance and their yearly salary. Should you select more neurotic people to improve your overall company performance? Or are you discriminating emotionally-stable (non-neurotic) employees when it comes to salary?
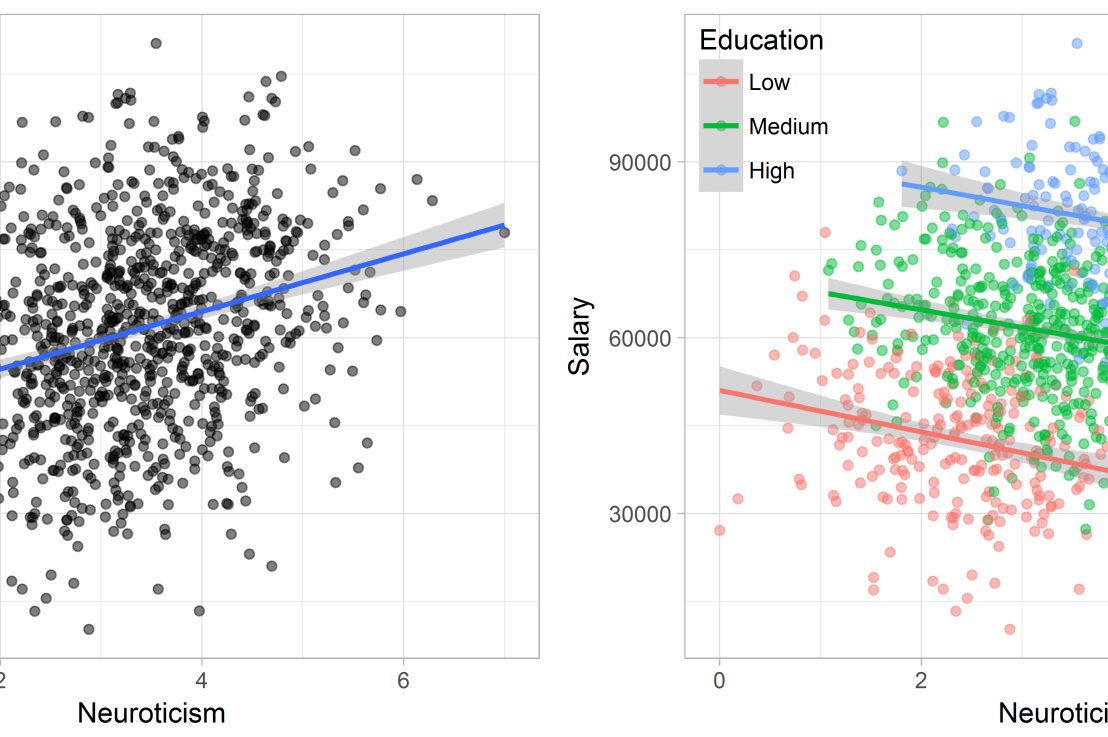
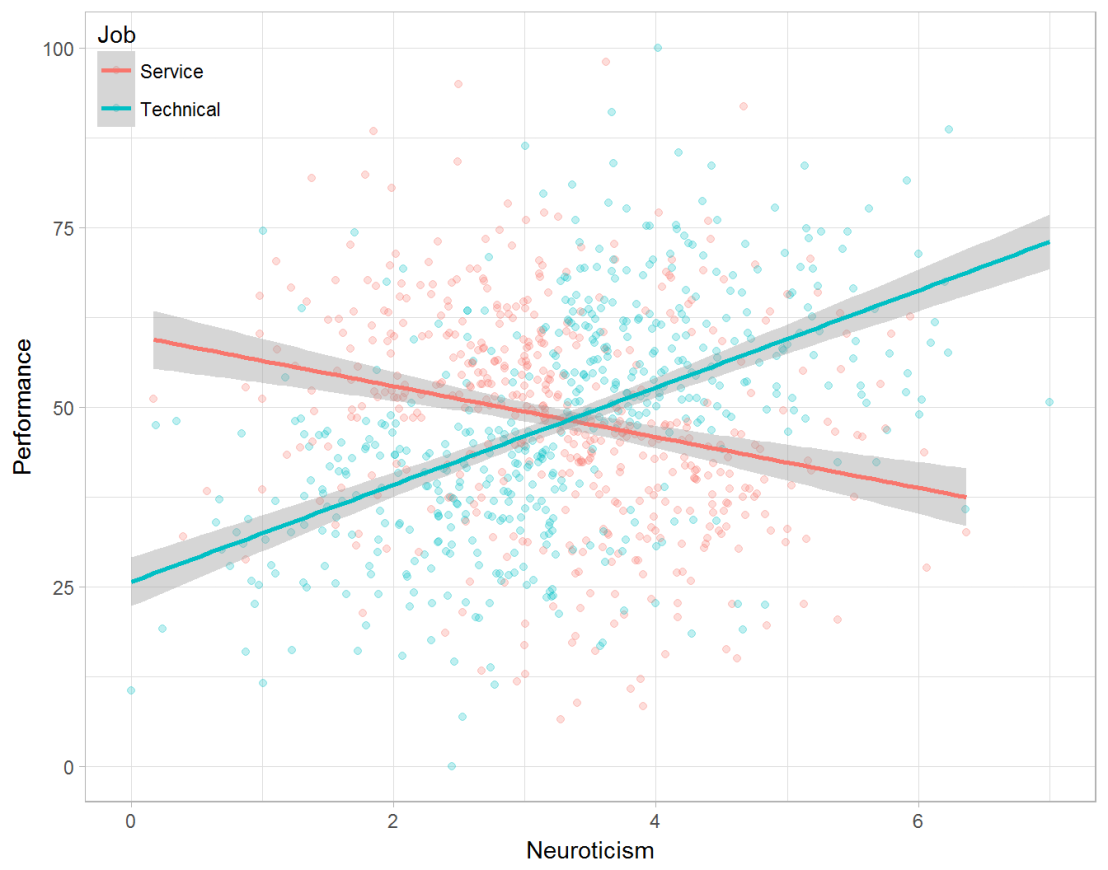
Taking a closer look at the subgroups in your data, you might however find very different relationships. For instance, the positive relationship between neuroticism and performance may only apply to technical positions, but not to those employees’ in service-oriented jobs.
Similarly, splitting the employees by education level, it becomes clear that there is a relationship between neuroticism and education level that may explain the earlier association with salary. More educated employees receive higher salaries and within these groups, neuroticism is actually related to lower yearly income.
If you’d like to see the code used to simulate these data and generate the examples, you can find the R markdown file here on Rpubs.
Solving the paradox
Kievit and colleagues (2013) argue that Simpsons paradox may occur in a wide variety of research designs, methods, and questions, particularly within the social and medical sciences. As such, they propose several means to “control” or minimize the risk of it occurring. The paradox may be prevented from occurring altogether by more rigorous research design: testing mechanisms in longitudinal or intervention studies. However, this is not always feasible. Alternatively, the researchers pose that data visualization may help recognize the patterns and subgroups and thereby diagnose paradoxes. This may be easy if your data looks like this:
But rather hard, or even impossible, when your data looks more like the below:
Clustering may nevertheless help to detect Simpson’s paradox when it is not directly observable in the data. To this end, Kievit and Epskamp (2012) have developed a tool to facilitate the detection of hitherto undetected patterns of association in existing datasets. It is written in R, a language specifically tailored for a wide variety of statistical analyses which makes it very suitable for integration into the regular analysis workflow. As an R package, the tool is is freely available and specializes in the detection of cases of Simpson’s paradox for bivariate continuous data with categorical grouping variables (also known as Robinson’s paradox), a very common inference type for psychologists. Finally, its code is open source and can be extended and improved upon depending on the nature of the data being studied.
One example of application is provided in the paper, for a dataset on coffee and neuroticism. A regression analysis would suggest a significant positive association between coffee and neuroticism overall. However, when the detection algorithm of the R package is applied, a different picture appears: the analysis shows that there are three latent clusters present and that the purported positive relationship only holds for one cluster whereas it is negative in the others.
Update 24-10-2017: minutephysics – one of my favorite YouTube channels – uploaded a video explaining Simpson’s paradox very intuitively in a medical context:
Update 01-11-2017: minutephysics uploaded a follow-up video:
The paradox is that we remain reluctant to fight our bias, even when they are put in plain sight.
Robert Coombs wanted to see whether he could land a new job. He was aware that, these days, organizations often employ applicant tracking systems to progress/fail incoming applications. Hence, Robert concluded that he had two challenges in his search for a new job:
He was up against leaders in their field, so his resume wouldn’t simply jump to the top of the pile.
Robots would read his application, along with those of his competition.
Being a tech enthusiast and having some programming skills, he decided to build his own application robot, capable of sending a customized CV and resume to the thousands of jobs posted online every day, in a matter of seconds. I strongly recommend you read his full story here, but these were his conclusions:
It’s not how you apply, it’s who you know. And if you don’t know someone, don’t bother.
Companies are trying to fill a position with minimal risk, not discover someone who breaks the mold.
The number of jobs you apply to has no correlation to whether you’ll be considered, and you won’t be considered for jobs you don’t get the chance to apply to.
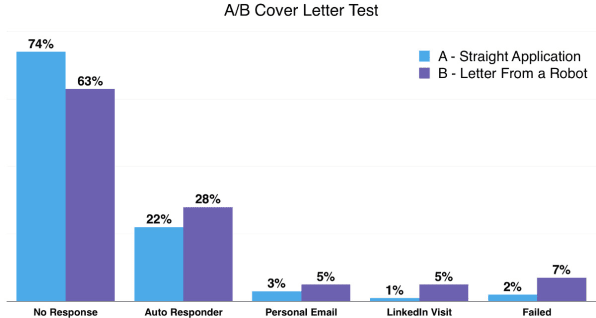
What I found most amusing is that he A/B tested one normal-looking cover letter and a letter in which he that admits right in the second sentence that it was being sent by a robot. “Now, one of those letters should have performed either a lot better or a lot worse than the other. For my purposes, I didn’t care which” he states. But as far as he could tell from the results of this experiment, it seems that nobody even reads cover letters anymore – not even the robots supposedly used in application tracking systems.
The HR technology landscape is evolving rapidly and with it, the HR function is becoming more and more data-driven (though not fast enough, some argue). HRM research, however, is still characterized by a strong reliance on general linear models like linear regression and ANOVA. In our forthcoming article in the special issue on Workforce Analytics of Human Resource Management, my co-authors and I argue that HRM research would benefit from an outside-in perspective, drawing on techniques that are commonly used in fields other than HRM.
Our article first outlines how the current developments in the measurement of HRM implementation and employee behaviors and cognitions may cause the more traditional statistical techniques to fall short. Using the relationship between work engagement and performance as a worked example, we then provide two illustrations of alternative methodologies that may benefit HRM research:
Using latent variables, bathtub models are put forward as the solution to examine multi-level mechanisms with outcomes at the team or organizational level without decreasing the sample size or neglecting the variation inherent in employees’ responses to HRM activities (see figure 1). Optimal matching analysis is proposed as particularly useful to examine the longitudinal patterns that occur in repeated observations over a prolonged timeframe. We describe both methods in a fair amount of detail, touching on elements such as the data requirements all the way up to the actual modeling steps and limitations.
An illustration of the two parts of a latent bathtub model.
I want to thank my co-authors and Shell colleagues Zsuzsa Bakk, Vasileios Giagkoulas, Linda van Leeuwen, and Esther Bongenaar for writing this, in my own biased opinion, wonderful article with me and I hope you will enjoy reading it as much as we did writing it.