Both in science and business, we often experience difficulties collecting enough data to test our hypotheses, either because target groups are small or hard to access, or because data collection entails prohibitive costs.
Such obstacles may result in data sets that are too small for the complexity of the statistical model needed to answer the questions we’re really interested in.
This unique book provides guidelines and tools for implementing solutions to issues that arise in small sample studies. Each chapter illustrates statistical methods that allow researchers and analysts to apply the optimal statistical model for their research question when the sample is too small.
This book will enable anyone working with data to test their hypotheses even when the statistical model required for answering their questions are too complex for the sample sizes they can collect. The covered statistical models range from the estimation of a population mean to models with latent variables and nested observations, and solutions include both classical and Bayesian methods. All proposed solutions are described in steps researchers can implement with their own data and are accompanied with annotated syntax in R.
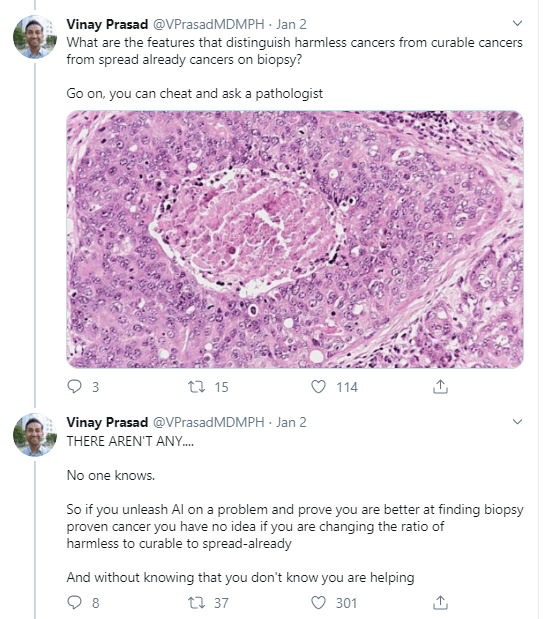
I came across this opinionated though informed commentary by Vinay Prasad on the recent Nature article where Google’s machine learning experts trained models to predict whether scans of patients’ breasts (mammogram’s) show cancerous cells or not.
Vinay Prasad [official bio] is a practicing hematologist-oncologist and Associate Professor of Medicine at Oregon Health and Science University. So he knows what he’s talking about.
He argues that “cancer screening is the LAST thing you should pick FIRST to work on with AI”. Which is an interesting statement in and of itself.
Regardless of my personal opinion on the topic, I found the paper, Vinay’s commentary, and the broader discussion on twitter very interesting and educational to read. I feel it shows how important it is to know the context in which you are applying machine learning. What tremendous value it provides to have domain experts in the same team as the data and machine learning experts.
Simpson (1951) demonstrated that a statistical relationship observed within a population—i.e., a group of individuals—could be reversed within all subgroups that make up that population. This phenomenon, where X seems to relate to Y in a certain way, but flips direction when the population is split for W, has since been referred to as Simpson’s paradox. Others names, according to Wikipedia, include the Simpson-Yule effect, reversal paradox or amalgamation paradox.
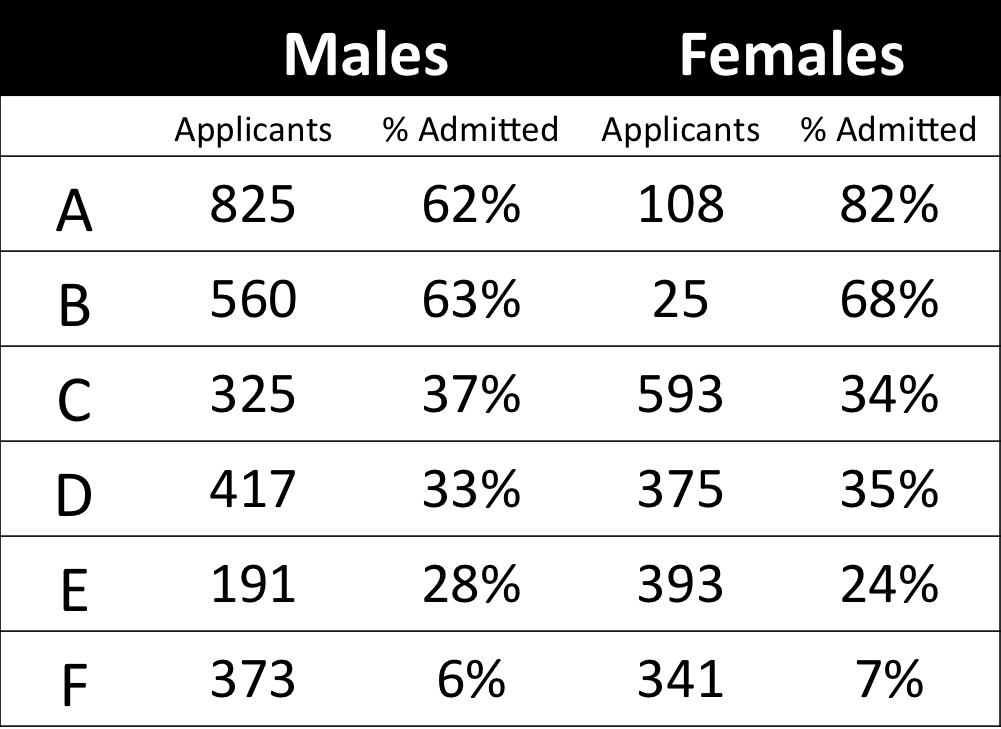
The most famous example has to be the seemingly gender-biased Berkeley admission rates:
“Examination of aggregate data on graduate admissions to the University of California, Berkeley, for fall 1973 shows a clear but misleading pattern of bias against female applicants. Examination of the disaggregated data reveals few decision-making units that show statistically significant departures from expected frequencies of female admissions, and about as many units appear to favor women as to favor men. If the data are properly pooled, taking into account the autonomy of departmental decision making, thus correcting for the tendency of women to apply to graduate departments that are more difficult for applicants of either sex to enter, there is a small but statistically significant bias in favor of women. […] The bias in the aggregated data stems not from any pattern of discrimination on the part of admissions committees, which seem quite fair on the whole, but apparently from prior screening at earlier levels of the educational system.” – part of abstract of Bickel, Hammel, & O’Connel (1975)
In a table, the effect becomes clear. While it seems as if women are rejected more often overall, women are actually less often rejected on a departmental level. Women simply applied to more selective departments more often (E & C below), resulting in the overall lower admission rate for women (35% as opposed to 44% for men).
Simpsons Paradox can easily occur in organizational or human resources settings as well. Let me run you through two illustrated examples, I simulated:
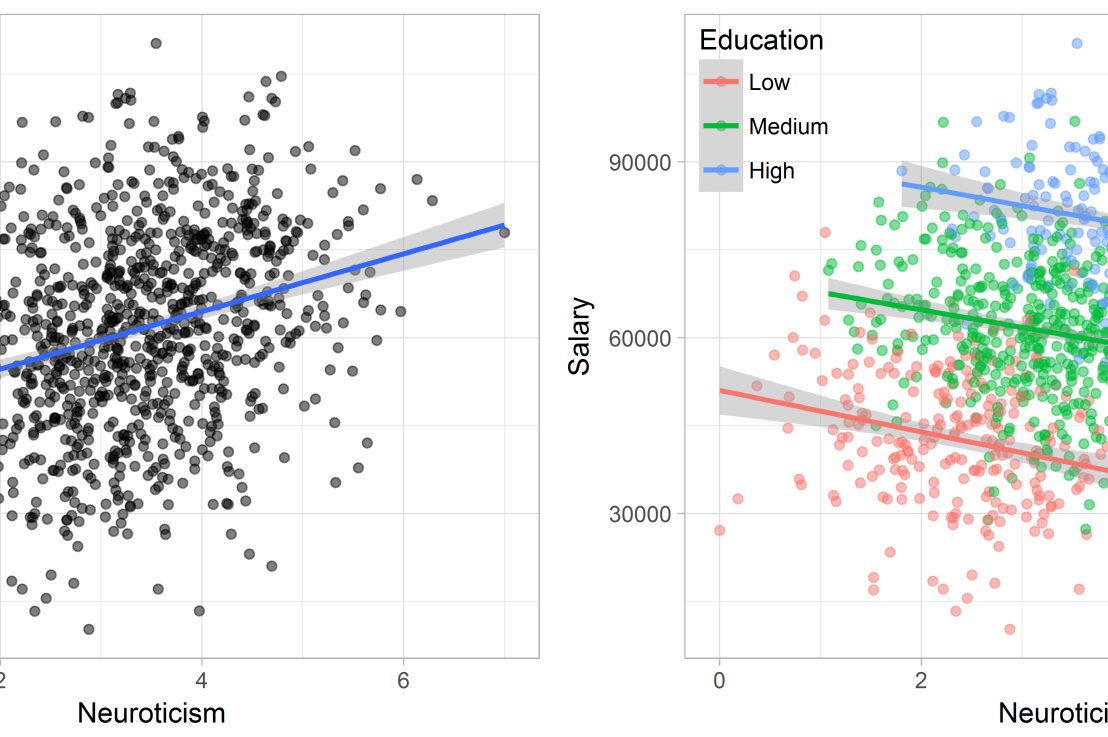
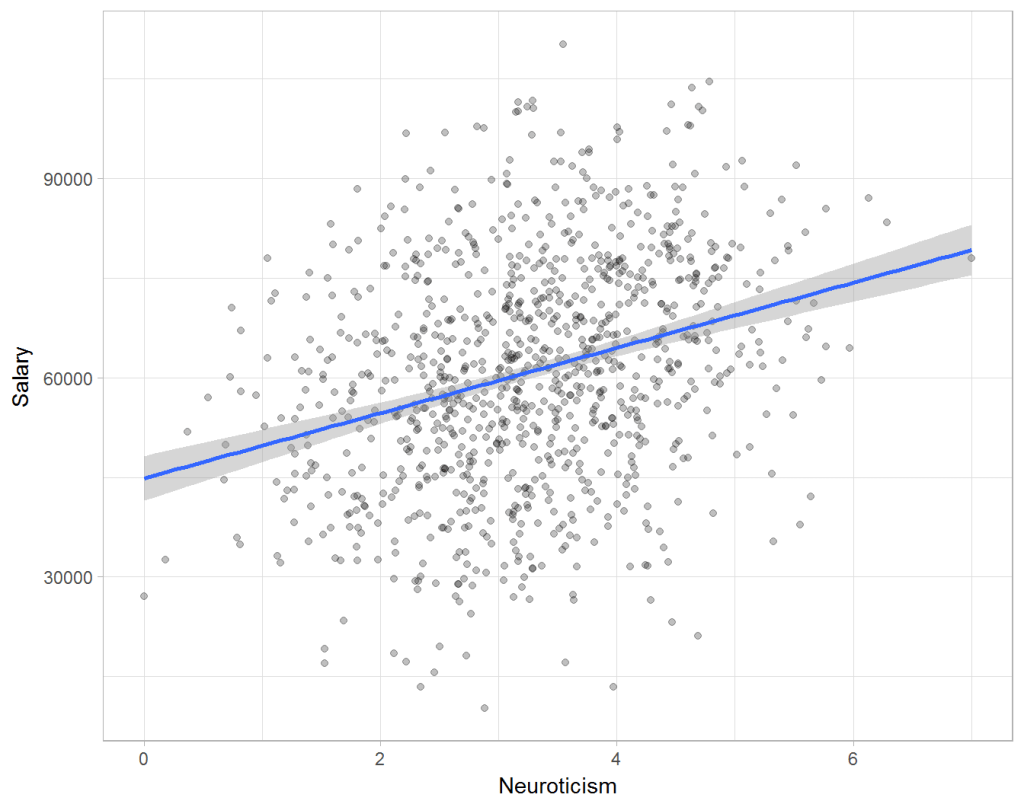
Assume you run a company of 1000 employees and you have asked all of them to fill out a Big Five personality survey. Per individual, you therefore have a score depicting his/her personality characteristic Neuroticism, which can run from 0 (not at all neurotic) to 7 (very neurotic). Now you are interested in the extent to which this Neuroticism of employees relates to their Job Performance (measured 0 – 100) and their Salary (measured in Euro’s per Year). In order to get a sense of the effects, you may decide to visualize both these relations in scatter plots:
From these visualizations it would look like Neuroticism relates significantly and positively to both employees’ performance and their yearly salary. Should you select more neurotic people to improve your overall company performance? Or are you discriminating emotionally-stable (non-neurotic) employees when it comes to salary?
Taking a closer look at the subgroups in your data, you might however find very different relationships. For instance, the positive relationship between neuroticism and performance may only apply to technical positions, but not to those employees’ in service-oriented jobs.
Similarly, splitting the employees by education level, it becomes clear that there is a relationship between neuroticism and education level that may explain the earlier association with salary. More educated employees receive higher salaries and within these groups, neuroticism is actually related to lower yearly income.
If you’d like to see the code used to simulate these data and generate the examples, you can find the R markdown file here on Rpubs.
Solving the paradox
Kievit and colleagues (2013) argue that Simpsons paradox may occur in a wide variety of research designs, methods, and questions, particularly within the social and medical sciences. As such, they propose several means to “control” or minimize the risk of it occurring. The paradox may be prevented from occurring altogether by more rigorous research design: testing mechanisms in longitudinal or intervention studies. However, this is not always feasible. Alternatively, the researchers pose that data visualization may help recognize the patterns and subgroups and thereby diagnose paradoxes. This may be easy if your data looks like this:
But rather hard, or even impossible, when your data looks more like the below:
Clustering may nevertheless help to detect Simpson’s paradox when it is not directly observable in the data. To this end, Kievit and Epskamp (2012) have developed a tool to facilitate the detection of hitherto undetected patterns of association in existing datasets. It is written in R, a language specifically tailored for a wide variety of statistical analyses which makes it very suitable for integration into the regular analysis workflow. As an R package, the tool is is freely available and specializes in the detection of cases of Simpson’s paradox for bivariate continuous data with categorical grouping variables (also known as Robinson’s paradox), a very common inference type for psychologists. Finally, its code is open source and can be extended and improved upon depending on the nature of the data being studied.
One example of application is provided in the paper, for a dataset on coffee and neuroticism. A regression analysis would suggest a significant positive association between coffee and neuroticism overall. However, when the detection algorithm of the R package is applied, a different picture appears: the analysis shows that there are three latent clusters present and that the purported positive relationship only holds for one cluster whereas it is negative in the others.
Update 24-10-2017: minutephysics – one of my favorite YouTube channels – uploaded a video explaining Simpson’s paradox very intuitively in a medical context:
Update 01-11-2017: minutephysics uploaded a follow-up video:
The paradox is that we remain reluctant to fight our bias, even when they are put in plain sight.
The below reiterates and summarizes this Stat article.
Recently, I addressed how bias may slip into Machine Learning applications and this weekend I came across another real-life example: IBM’s Watson, specifically Watson for Oncology. With a single machine, IBM intended to tackle humanity’s most vexing diseases and revolutionize medicine and they quickly zeroed in on a high-profile target: cancer.
However, three years later now, a STAT investigation has found that the supercomputer isn’t living up to the lofty expectations IBM created for it. IBM claims that, through Artificial Intelligence, Watson for Oncology can generate new insights and identify “new approaches” to cancer care. However, the STAT investigation (video below) concludes that the system doesn’t create new knowledge and is artificially intelligent only in the most rudimentary sense of the term. Similarly, cancer specialists using the product argue Watson is still in its “toddler stage” when it comes to oncology.
Let’s start with the positive side. For specific treatments, Watson can scan academic literature, immediately providing the “best data” about a treatment — survival rates, for example — thereby relieving doctors of tedious literature searches. Due to this transparency, Watson may level the hierarchy commonly found in hospital settings, by holding (senior) doctors accountable to the data and empowering junior physicians to back up their arguments. Furthermore, Watson’s information may empower patients as they can be offered a comprehensive packet of treatment options, including potential treatment plans along with relevant scientific articles. Patients can do their own research about these treatments, and maybe even disagree with the doctor about the right course of action.
Although study results demonstrate that Watson saves doctors time and can have a high concordance rate with their treatment recommendations, much more research is needed. The studies were all conference abstracts, which haven’t been published in peer-reviewed journals — and all but one was either conducted by a paying customer or included IBM staff on the author list, or both. More importantly, IBM has failed to exposed Watson for Oncology to critical review by outside scientists nor have they conducted clinical trials to assess its effectiveness. It would be very interesting to examine whether Watson’s implementation is actually saving lives or making healthcare more efficient/effective.
IBM Watson HealthSuch validation is especially necessary because several issues are identified. First, the actual capabilities of Watson for Oncology are not well-understood by the public, and even by some of the hospitals that use it. It’s taken nearly six years of painstaking work by data engineers and doctors to train Watson in just seven types of cancer, and keep the system updated with the latest knowledge. Moreover, because of the complexity of the underlying machine learning algorithms, the recommendations Watson puts out are a black box, and Watson can not provide the specific reasons for picking treatment A over treatment B.
Second, the system is essentially Memorial Sloan Kettering in a portable box. IBM celebrates Memorial Sloan Kettering’s role as the only trainer of Watson. After all, who better to educate the system than doctors at one of the world’s most renowned cancer hospitals? However, doctors claim that Memorial Sloan Kettering’s training has caused bias in the system, because the treatment recommendations it puts into Watson don’t always comport with the practices of doctors elsewhere in the world. When users ask Watson for advice, the system also searches published literature — some of which is curated by Memorial Sloan Kettering — to provide relevant studies and background information to support its recommendation. But the recommendation itself is derived from the training provided by the hospital’s doctors, not the outside literature.
Doctors at Memorial Sloan Kettering acknowledged their influence on Watson. “We are not at all hesitant about inserting our bias, because I think our bias is based on the next best thing to prospective randomized trials, which is having a vast amount of experience,” said Dr. Andrew Seidman, one of the hospital’s lead trainers of Watson. “So it’s a very unapologetic bias.”
However, this bias causes serious problems when Watson for Oncology is implemented in other countries/hospitals. The generally affluent population treated at Memorial Sloan Kettering doesn’t reflect the diversity of people around the world. According to Martijn van Oijen, an epidemiologist and associate professor at Academic Medical Center in the Netherlands, Watson has not been implemented in because of country level differences in treatment approaches. Similarly, oncologists at one hospital in Denmark said they have dropped implementation altogether after finding that local doctors agreed with Watson in only about 33 percent of cases. Different problems occurred in South Korea, where researchers reported that the treatment Watson most often recommended for breast cancer patients simply wasn’t covered by their national insurance system.
Kris, the lead trainer at Memorial Sloan Kettering, says nobody wants to hear the problems. “All they want to hear is that Watson is the answer. And it always has the right answer, and you get it right away, and it will be cheaper. But like anything else, it’s kind of human.”


![imaging-video[1].jpg](https://paulvanderlaken.com/wp-content/uploads/2017/09/imaging-video1.jpg)
