The R programming language has seen the integration of many languages; C, C++, Python, to name a few, can be seamlessly embedded into R so one can conveniently call code written in other languages from the R console. Little known to many, R works just as well with JavaScript—this book delves into the various ways both languages can work together.
John Coene is an well-known R and JavaScript developer. He recently wrote a book on JavaScript for R users, of which he published an online version free to access here.
The book is definitely worth your while if you want to better learn how to develop front-end applications (in JavaScript) on top of your statistical R programs. Think of better understanding, and building, yourself Shiny modules or advanced data visualizations integrated right into webpages.
A nice step on your development path towards becoming a full stack developer by combining R and JavaScript!
Yet most R developers are not familiar with one of web browsers’ core technology: JavaScript. This book aims to remedy that by revealing how much JavaScript can greatly enhance various stages of data science pipelines from the analysis to the communication of results.
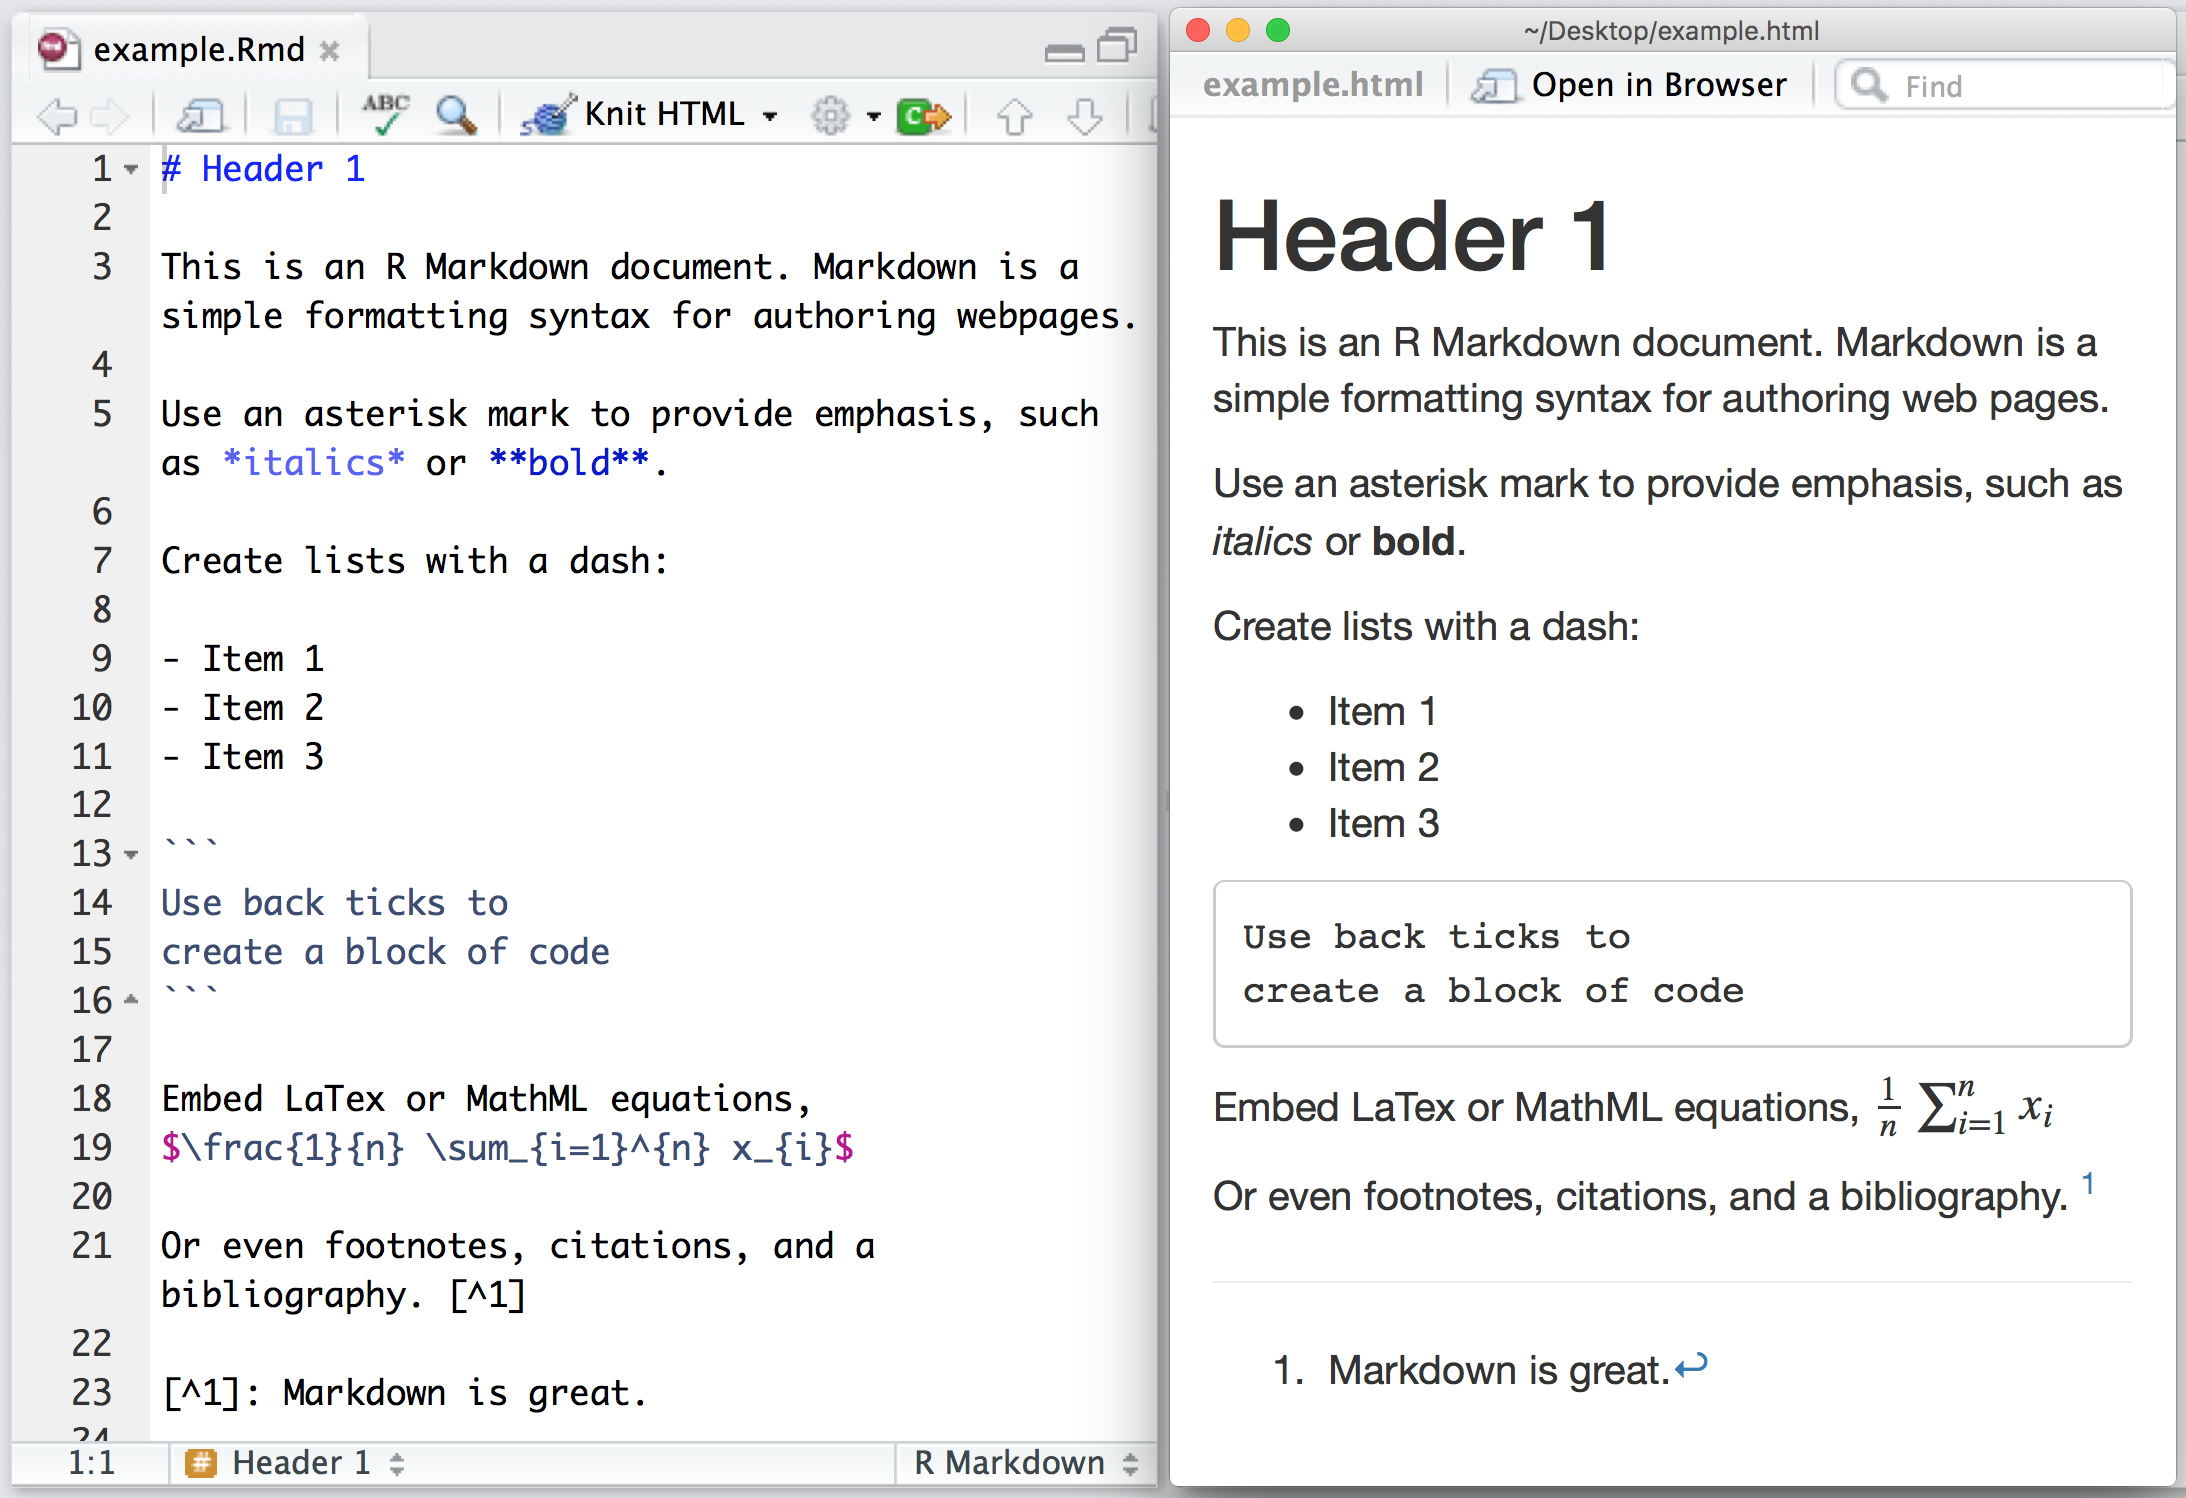
Yan Holtz recently created a neat little overview of handy R Markdown tips and tricks that improve the appearance of output documents. He dubbed this overview Pimp my RMD. Have a look, it’s worth it!
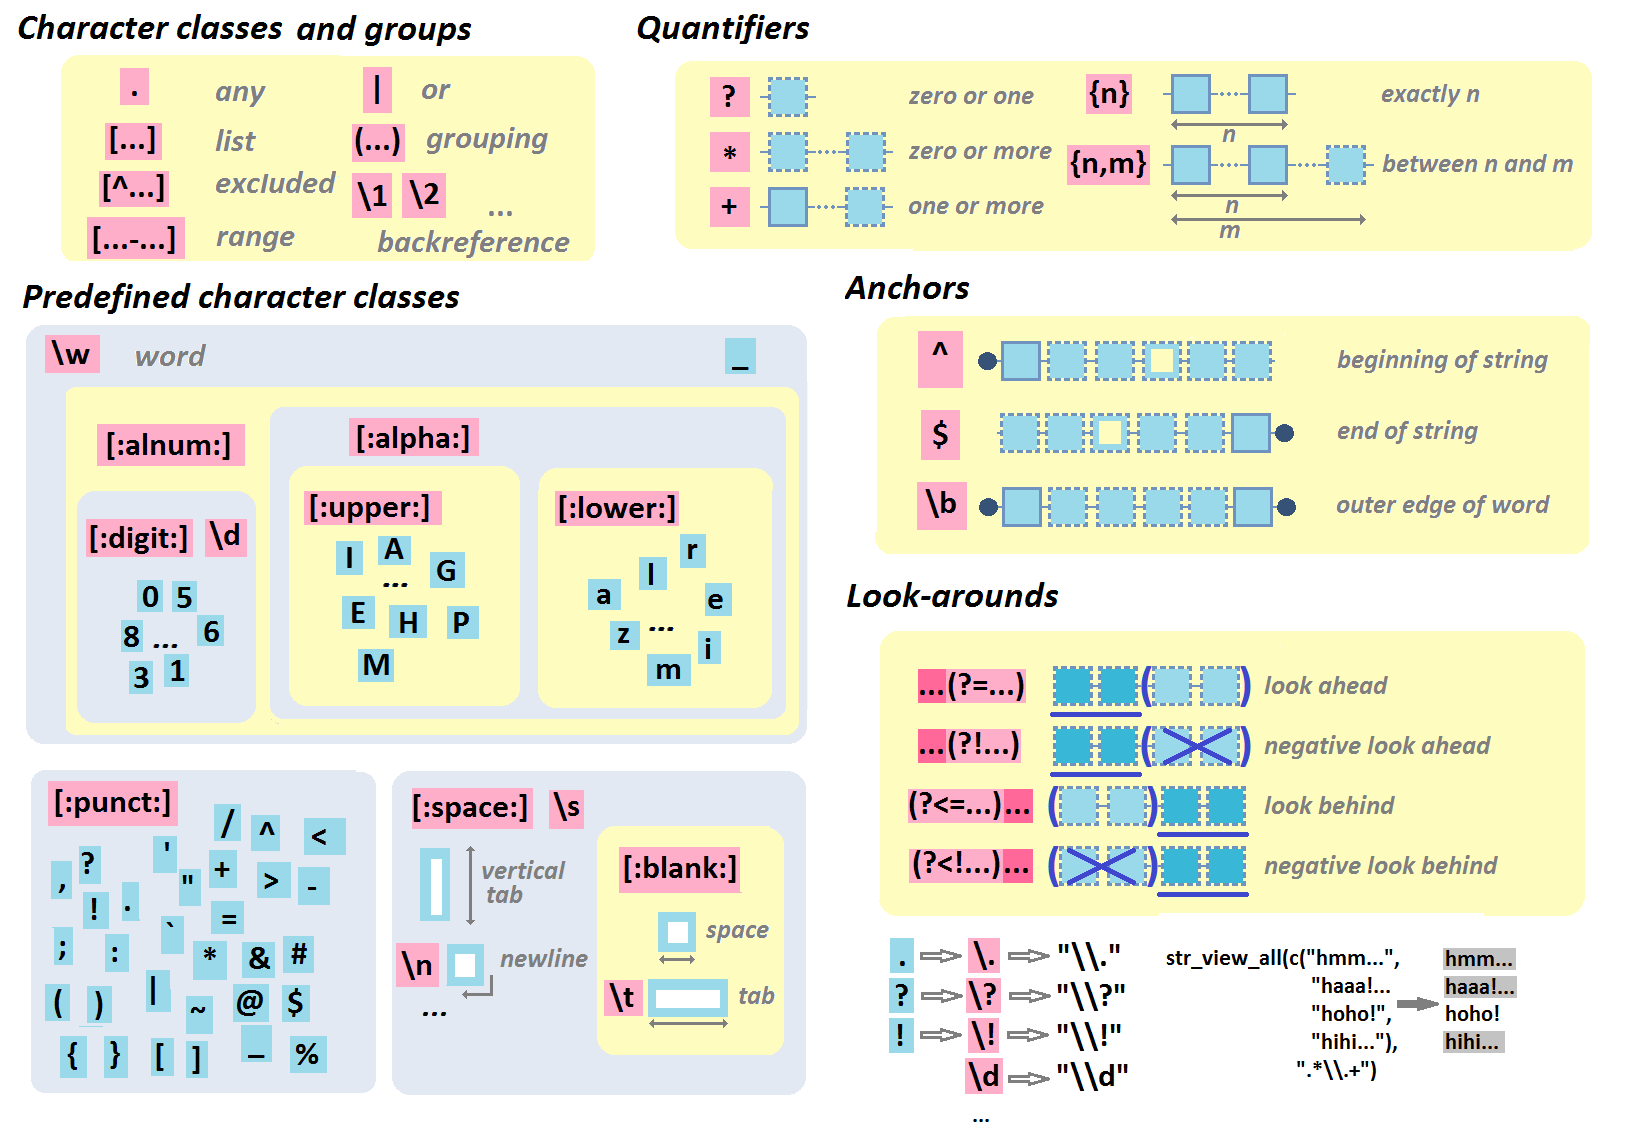
I would like to demonstrate how regular expressions can be used to retrieve (sub)strings that follow a specific format. We could use regex to examine, for instance, when, and by whom, which magical spells are cast.
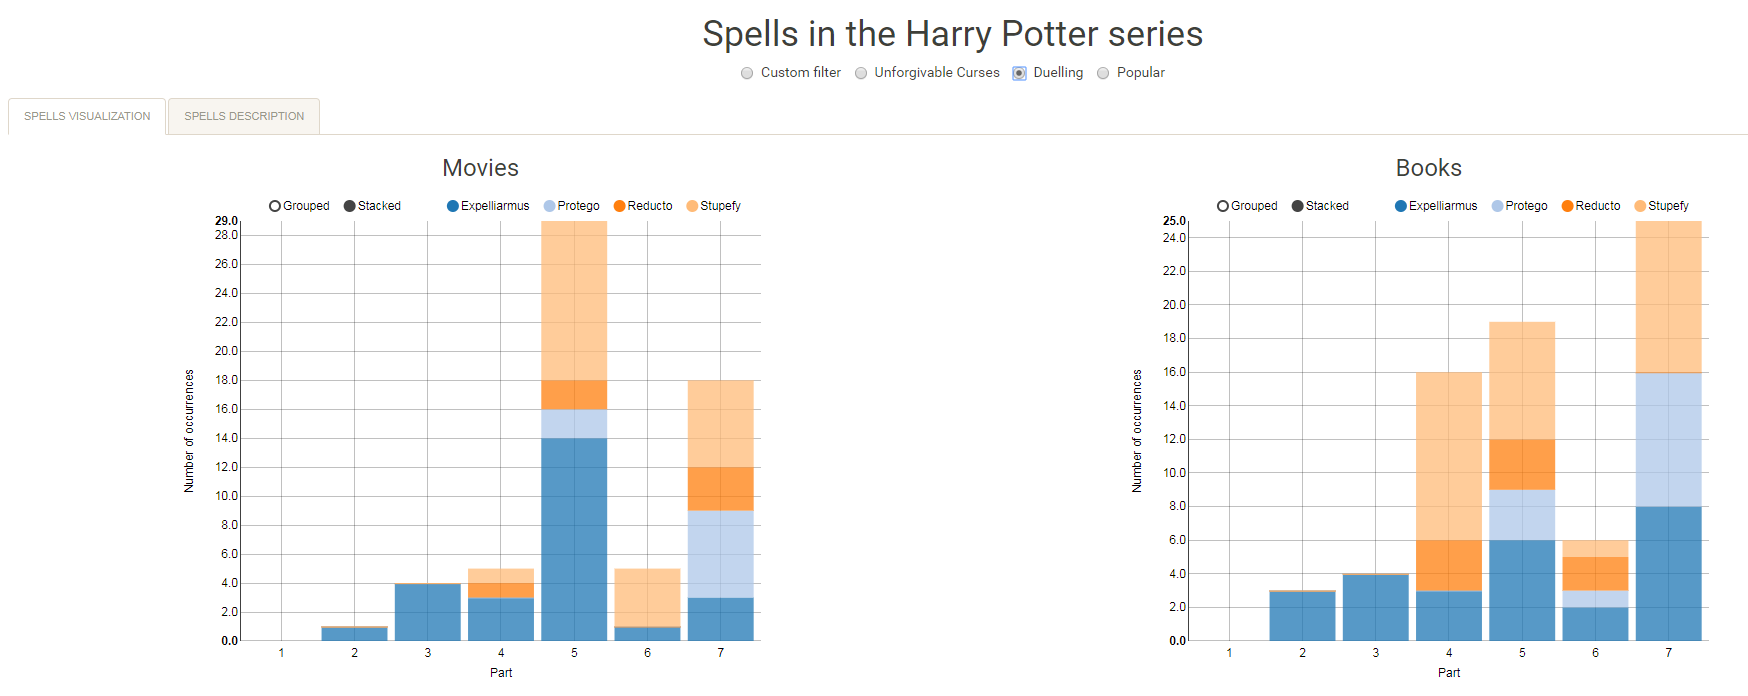
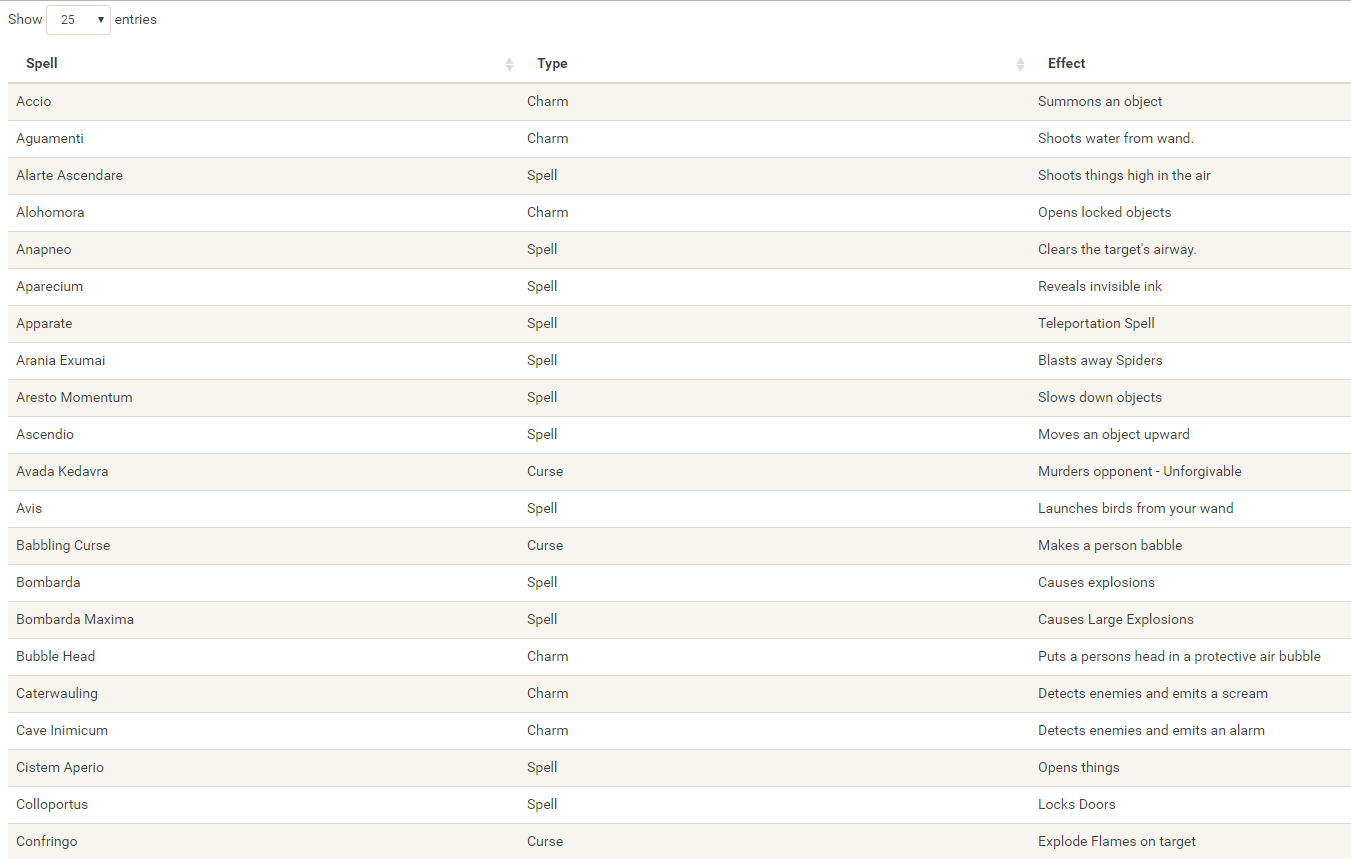
Well, Prusinowskik (real name unknown) beat me to it, and how! S/He formed a comprehensive list of all spells found in the Harry Potter saga (see below), and categorized these into “spells“, “charms“, and “curses“, and into “popular“, “dueling” and “unforgivable” purposes. Next, Prusinowskik built an interactive Shiny application with lovely JavaScript graphs (package: rCharts) for us to discover precisely when during the saga which spells are cast (see also below). Moreover, the analysis was repeated for both the books and the movies.
Truly excellent work Prusinowskik! The Shiny app can be found here.
Obviously, analysing beer data in high on everybody’s list of favourite things to do in your weekend. Amanda Dobbyn wanted to examine whether she could provide us with an informative categorization the 45.000+ beers in her data set, without having to taste them all herself.
You can find the full report here but you may also like to interactively discover beer similarities yourself in Amanda’s Beer Clustering Shiny App. Or just have a quick look at some of Amanda’s wonderful visualizations below.
A density map of the bitterness (y-axis) and alcohol percentages (x-axis) in the most popular beer styles.
A k-means clustering of each of the 45000 beers in 10 clusters. Try out other settings in Amanda’s Beer Clustering Shiny App.
The alcohol percentages (x), bitterness (y) and cluster assignments of some popular beer styles.
Modelling beer’s bitterness (y) by the number of used hops (x).
Help yourself to these free books, tutorials, packages, cheat sheets, and many more materials for R programming. There’s a separate overview for handy R programming tricks. If you have additions, please comment below or contact me!
Integrated Development Environments (IDEs) & Graphical User Inferfaces (GUIs)
Descriptions mostly taken from their own websites:
RStudio*** – Open source and enterprise ready professional software
Jupyter Notebook*** – open-source web application that allows you to create and share documents that contain live code, equations, visualizations and narrative text across dozens of programming languages.


