Having trouble understanding how to interpret distribution plots? Or struggling with Q-Q plots? Sven Halvorson penned down a visual tutorial explaining distributions using visualisations of their quantiles.
Because each slice of the distribution is 5% of the total area and the height of the graph is changing, the slices have different widths. It’s like we’re trying to cut a strange shaped cake into 20 equal pieces using parallel cuts. The slices at the center must be thinner since the distribution is denser (taller) than on the edges.
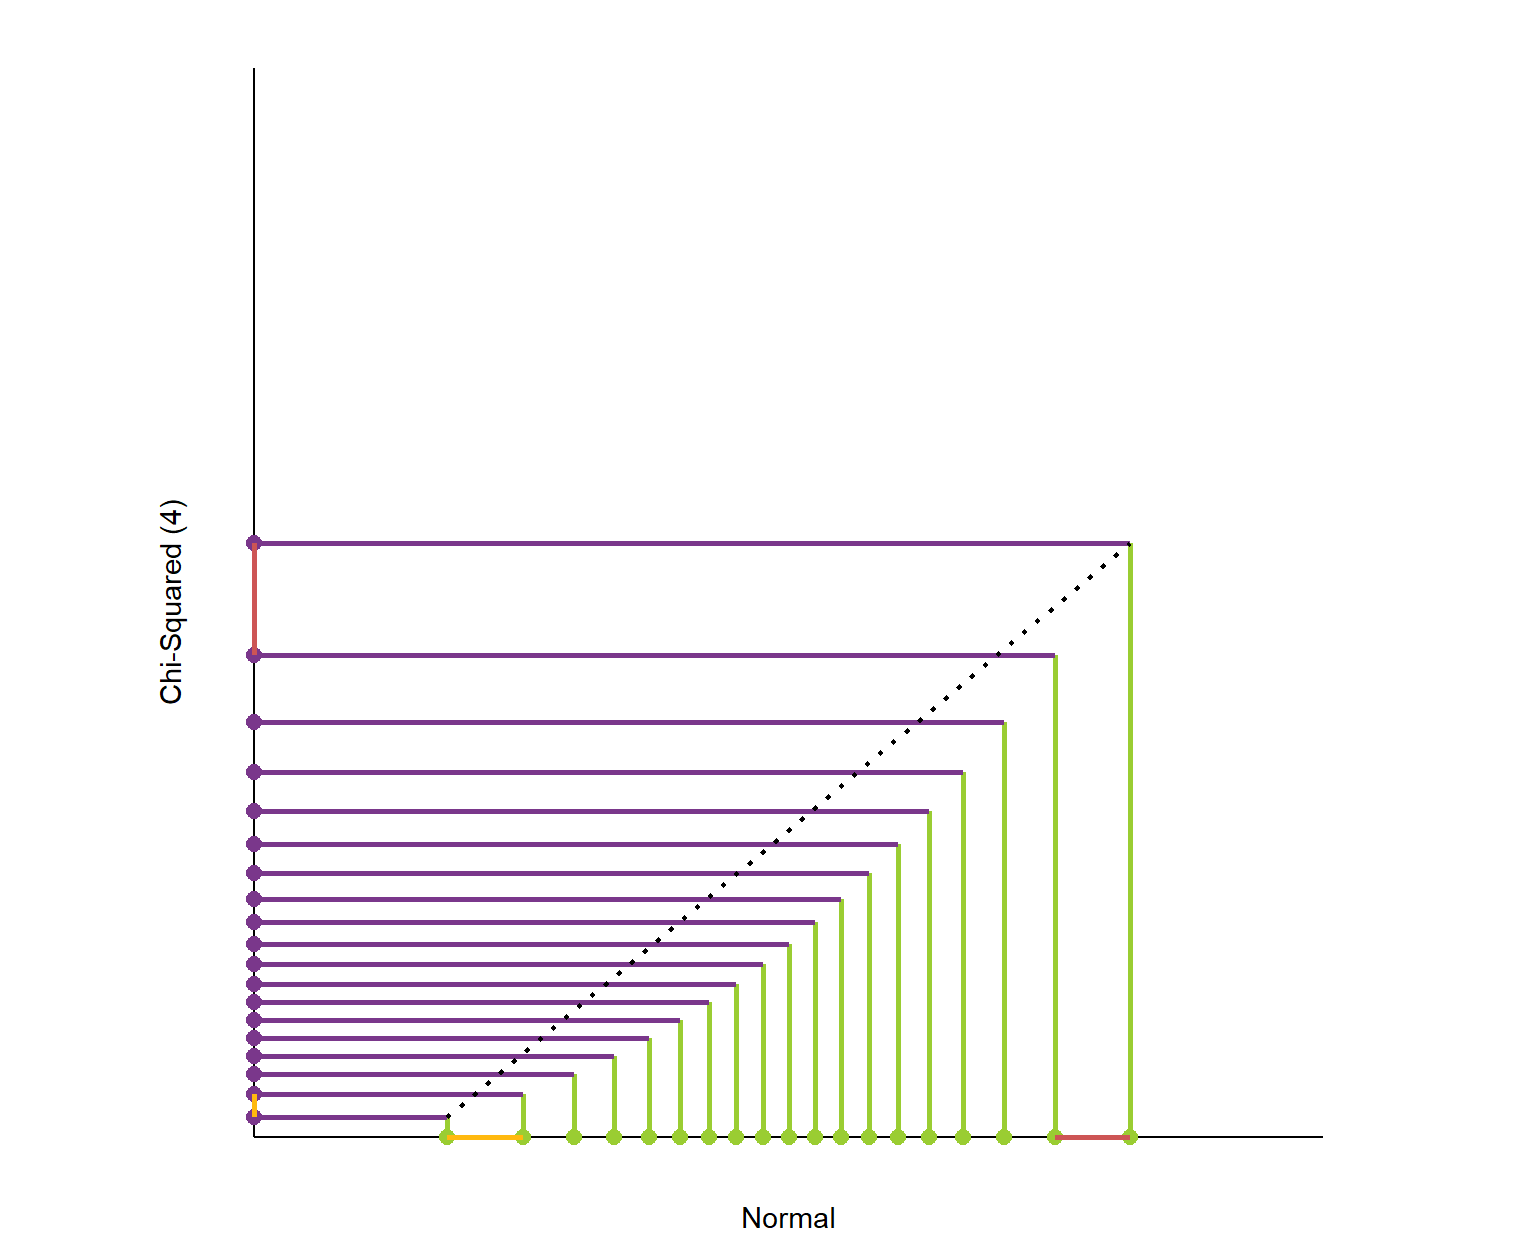
Here is the plot of matching the quantiles of the chi-squared(4) and normal distributions. I’ve again plotted these quantiles over 98% of each distribution’s range. The chi-squared distribution is skewed so its quantiles are packed into a smaller portion of its axis.
What is this graph telling us? It shows that the exchange rate between the quantiles of the two distributions is not constant.
Peter Cottle built this great interactive Git tutorial that teaches you all vital branching skills right in your browser. It’s interactive, beautiful, and very informative, introducing every concept and Git command in a step-by-step fashion.
The tutorial includes many levels that progressively teach you the Git commands you’ll need to apply version control on a daily basis:
There’s also a sandbox mode where you can interactively explore and build your own Git tree.
LearnGitBranching is a git repository visualizer, sandbox, and a series of educational tutorials and challenges. Its primary purpose is to help developers understand git through the power of visualization (something that’s absent when working on the command line). This is achieved through a game with different levels to get acquainted with the different git commands.
You can input a variety of commands into LearnGitBranching (LGB) — as commands are processed, the nearby commit tree will dynamically update to reflect the effects of each command.
PyData is famous for it’s great talks on machine learning topics. This 2019 London edition, Vincent Warmerdamagain managed to give a super inspiring presentation. This year he covers what he dubs Artificial Stupidity™. You should definitely watch the talk, which includes some great visual aids, but here are my main takeaways:
Vincent speaks of Artificial Stupidity, of machine learning gone HorriblyWrong™ — an example of which below — for which Vincent elaborates on three potential fixes:
Example of a model that goes HorriblyWrong™, according to Vincent’s talk.
1. Predict Less, but Carefully
Vincent argues you shouldn’t extrapolate your predictions outside of your observed sampling space. Even better: “Not predicting given uncertainty is a great idea.” As an alternative, we could for instance design a fallback mechanism, by including an outlier detection model as the first step of your machine learning model pipeline and only predict for non-outliers.
I definately recommend you watch this specific section of Vincent’s talk because he gives some very visual and intuitive explanations of how extrapolation may go HorriblyWrong™.
Be careful! One thing we should maybe start talking about to our bosses: Algorithms merely automate, approximate, and interpolate. It’s the extrapolation that is actually kind of dangerous.
Vincent Warmerdam @ Pydata 2019 London
Basically, we can choose to not make automated decisions sometimes.
2. Constrain thy Features
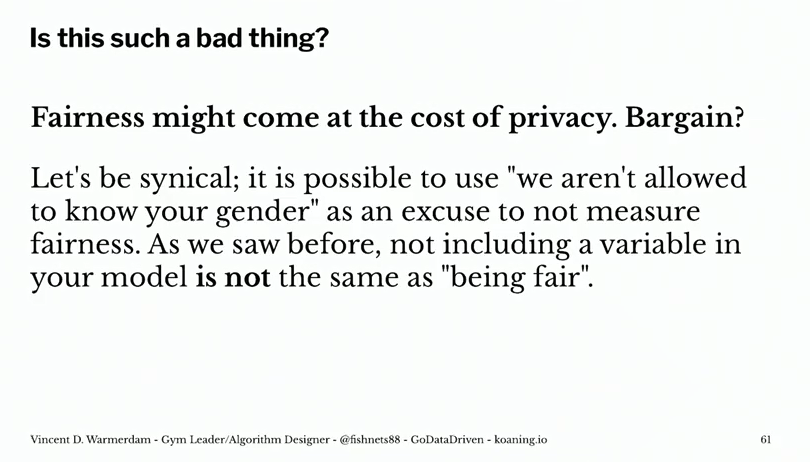
What we feed to our models really matters. […] You should probably do something to the data going into your model if you want your model to have any sort of fairness garantuees.
Vincent Warmerdam @ Pydata 2019 London
Often, simply removing biased features from your data does not reduce bias to the extent we may have hoped. Fortunately, Vincent demonstrates how to remove biased information from your variables by applying some cool math tricks.
Unfortunately, doing so will often result in a lesser predictive accuracy. Unsurprisingly though, as you are not closely fitting the biased data any more. What makes matters more problematic, Vincent rightfully mentions, is that corporate incentives often not really align here. It might feel that you need to pick: it’s either more accuracy or it’s more fairness.
However, there’s a nice solution that builds on point 1. We can now take the highly accurate model and the highly fair model, make predictions with both, and when these predictions differ, that’s a very good proxy where you potentially don’t want to make a prediction. Hence, there may be observations/samples where we are comfortable in making a fair prediction, whereas in most other situations we may say “right, this prediction seems unfair, we need a fallback mechanism, a human being should look at this and we should not automate this decision”.
Vincent does not that this is only one trick to constrain your model for fairness, and that fairness may often only be fair in the eyes of the beholder. Moreover, in order to correct for these biases and unfairness, you need to know about these unfair biases. Although outside of the scope of this specific topic, Vincent proposes this introduces new ethical issues:
Basically, we can choose to put our models on a controlled diet.
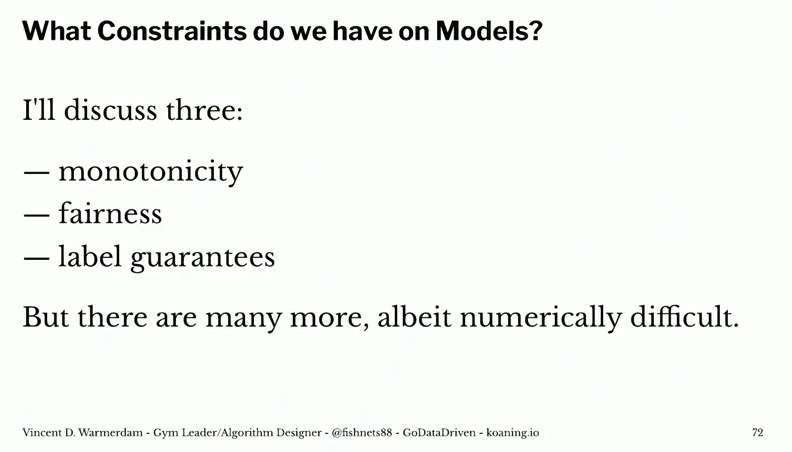
3. Constrain thy Model
Vincent argues that we should include constraints (based on domain knowledge, or common sense) into our models. In his presentation, he names a few. For instance, monotonicity, which implies that the relationship between X and Y should always be either entirely non-increasing, or entirely non-decreasing. Incorporating the previously discussed fairness principles would be a second example, and there are many more.
If we every come up with a model where more smoking leads to better health, that’s bad. I have enough domain knowledge to say that that should never happen. So maybe I should just make a system where I can say “look this one column with relationship to Y should always be strictly negative”.
Vincent Warmerdam @ Pydata 2019 London
Basically, we can integrate domain knowledge or preferences into our models.
Wanting to broaden your scope and learn a new programming language? This great workshop was given at EARL 2018 by Mango Solutions and helps R programmers transition into Python building on their existing R knowledge. The workshop includes exercises that introduce you to the key concepts of Python and some of its most powerful packages for data science, including numpy, pandas, sklearn, and seaborn.
Have a look at the associated workshop guide that walk you through the assignments, or at the github repo with all materials in Jupyter notebooks.
The Bayesian method is the natural approach to inference, yet it is hidden from readers behind chapters of slow, mathematical analysis. Nevertheless, mathematical analysis is only one way to “think Bayes”. With cheap computing power, we can now afford to take an alternate route via probabilistic programming.
Cam Davidson-Pilon wrote the book Bayesian Methods for Hackers as a introduction to Bayesian inference from a computational and understanding-first, mathematics-second, point of view.
The book explains Bayesian principles with code and visuals. For instance:
%matplotlib inline
from IPython.core.pylabtools import figsize
import numpy as np
from matplotlib import pyplot as plt
figsize(11, 9)

import scipy.stats as stats

dist = stats.beta
n_trials = [0, 1, 2, 3, 4, 5, 8, 15, 50, 500]
data = stats.bernoulli.rvs(0.5, size=n_trials[-1])
x = np.linspace(0, 1, 100)

for k, N in enumerate(n_trials):
    sx = plt.subplot(len(n_trials)/2, 2, k+1)
    plt.xlabel("$p$, probability of heads") \
        if k in [0, len(n_trials)-1] else None
    plt.setp(sx.get_yticklabels(), visible=False)
    heads = data[:N].sum()
    y = dist.pdf(x, 1 + heads, 1 + N - heads)
    plt.plot(x, y, label="observe %d tosses,\n %d heads" % (N, heads))
    plt.fill_between(x, 0, y, color="#348ABD", alpha=0.4)
    plt.vlines(0.5, 0, 4, color="k", linestyles="--", lw=1)

    leg = plt.legend()
    leg.get_frame().set_alpha(0.4)
    plt.autoscale(tight=True)


plt.suptitle("Bayesian updating of posterior probabilities",
             y=1.02,
             fontsize=14)

plt.tight_layout()
I can only recommend you start with the online version of Bayesian Methods for Hackers, but note that the print version helps sponsor the author ánd includes some additional features:
Additional Chapter on Bayesian A/B testing
Updated examples
Answers to the end of chapter questions
Additional explanation, and rewritten sections to aid the reader.
If you’re interested in learning more about Bayesian analysis, I recommend these other books:
There’s another great talk on the RStudio website. In this talk, Mark Sellors discusses some of the misinformation around the idea of what “putting something into production” actually means, and provides some tips on overcoming obstacles.


