Statistics, and statistical inference in specific, are becoming an ever greater part of our daily lives. Models are trying to estimate anything from (future) consumer behaviour to optimal steering behaviours and we need these models to be as accurate as possible. Trevor Hastie is a great contributor to the development of the field, and I highly recommend the machine learning books and courses that he developed, together with Robert Tibshirani. These you may find in my list of R Resources (Cheatsheets, Tutorials, & Books).
Today I wanted to share another book Hastie wrote, together with Bradley Efron, another colleague of his at Stanford University. It is called Computer Age Statistical Inference (Efron & Hastie, 2016) and is a definite must read for every aspiring data scientist because it illustrates most algorithms commonly used in modern-day statistical inference. Many of these algorithms Hastie and his colleagues at Stanford developed themselves and the book handles among others:
Coding Train is a Youtube channel by Daniel Shiffman that covers anything from the basics of programming languages like JavaScript (with p5.js) and Java (with Processing) to generative algorithms like physics simulation, computer vision, and data visualization. In particular, these latter topics, which Shiffman bundles under the label “the Nature of Code”, draw me to the channel.
In a recent series, Daniel draws from his free e-book to create his seven-video playlist where he elaborates on the inner workings of neural networks, visualizing the entire process as he programs the algorithm from scratch in Processing (Java). I recommend the two videos below consisting of the actual programming, especially for beginners who want to get an intuitive sense of how a neural network works.
This blog explains t-Distributed Stochastic Neighbor Embedding (t-SNE) by a story of programmers joining forces with musicians to create the ultimate drum machine (if you are here just for the fun, you may start playing right away).
Kyle McDonald, Manny Tan, and Yotam Mann experienced difficulties in pinpointing to what extent sounds are similar (ding, dong) and others are not (ding, beep) and they wanted to examine how we, humans, determine and experience this similarity among sounds. They teamed up with some friends at Google’s Creative Lab and the London Philharmonia to realize what they have named “the Infinite Drum Machine” turning the most random set of sounds into a musical instrument.
The project team wanted to include as many different sounds as they could, but had less appetite to compare, contrast and arrange all sounds into musical accords themselves. Instead, they imagined that a computer could perform such a laborious task. To determine the similarities among their dataset of sounds – which literally includes a thousand different sounds from the ngaaarh of a photocopier to the zing of an anvil – they used a fairly novel unsupervised machine learning technique called t-Distributed Stochastic Neighbor Embedding, or t-SNE in short (t-SNE Wiki; developer: Laurens van der Maaten). t-SNE specializes in dimensionality reduction for visualization purposes as it transforms highly-dimensional data into a two- or three-dimensional space. For a rapid introduction to highly-dimensional data and t-SNE by some smart Googlers, please watch the video below.
As the video explains, t-SNE maps complex data to a two- or three-dimensional space and was therefore really useful to compare and group similar sounds. Sounds are super highly-dimensional as they are essentially a very elaborate sequence of waves, each with a pitch, a duration, a frequency, a bass, an overall length, etcetera (clearly I am no musician). You would need a lot of information to describe a specific sound accurately. The project team compared sound to fingerprints, as there is an immense amount of data in a single padamtss.
t-SNE takes into account all this information of a sound and compares all sounds in the dataset. Next, it creates 2 or 3 new dimensions and assigns each sound values on these new dimensions in such a way that sounds which were previously similar (on the highly-dimensional data) are also similar on the new 2 – 3 dimensions. You could say that t-SNE summarizes (most of) the information that was stored in the previous complex data. This is what dimensionality reduction techniques do: they reduce the number of dimensions you need to describe data (sufficiently). Fortunately, techniques such as t-SNE are unsupervised, meaning that the project team did not have to tag or describe the sounds in their dataset manually but could just let the computer do the heavy lifting.
The result of this project is fantastic and righteously bears the name of Infinite Drum Machine (click to play)! You can use the two-dimensional map to explore similar sounds and you can even make beats using the sequencing tool. The below video summarizes the creation process.
Amazed by this application, I wanted to know how t-SNE is being used in other projects. I have found a tremendous amount of applications that demonstrate how to implement t-SNE in Python, R, and even JS whereas the method also seems popular in academia.
Clusters of similar cats/dogs in Luke Metz’ application of t-SNE.Cho et al., 2014 have used t-SNE in their natural language processing projects as it allows for an easy examination of the similarity among words and phrases. Mnih and colleagues (2015) have used t-SNE to examine how neural networks were playing video games.
Two-dimensional t-SNE visualization of the hidden layer activity of neural network playing Space Invaders (Mnih et al., 2015)
On a final note, while acknowledging its potential, this blog warns for the inaccuracies in t-SNE due to the aesthetical adjustments it often seems to make. They have some lovely interactive visualizations to back up their claim. They conclude that it’s incredible flexibility allows t-SNE to find structure where other methods cannot. Unfortunately, this makes it tricky to interpret t-SNE results as the algorithm makes all sorts of untransparent adjustments to tidy its visualizations and make the complex information fit on just 2-3 dimensions.
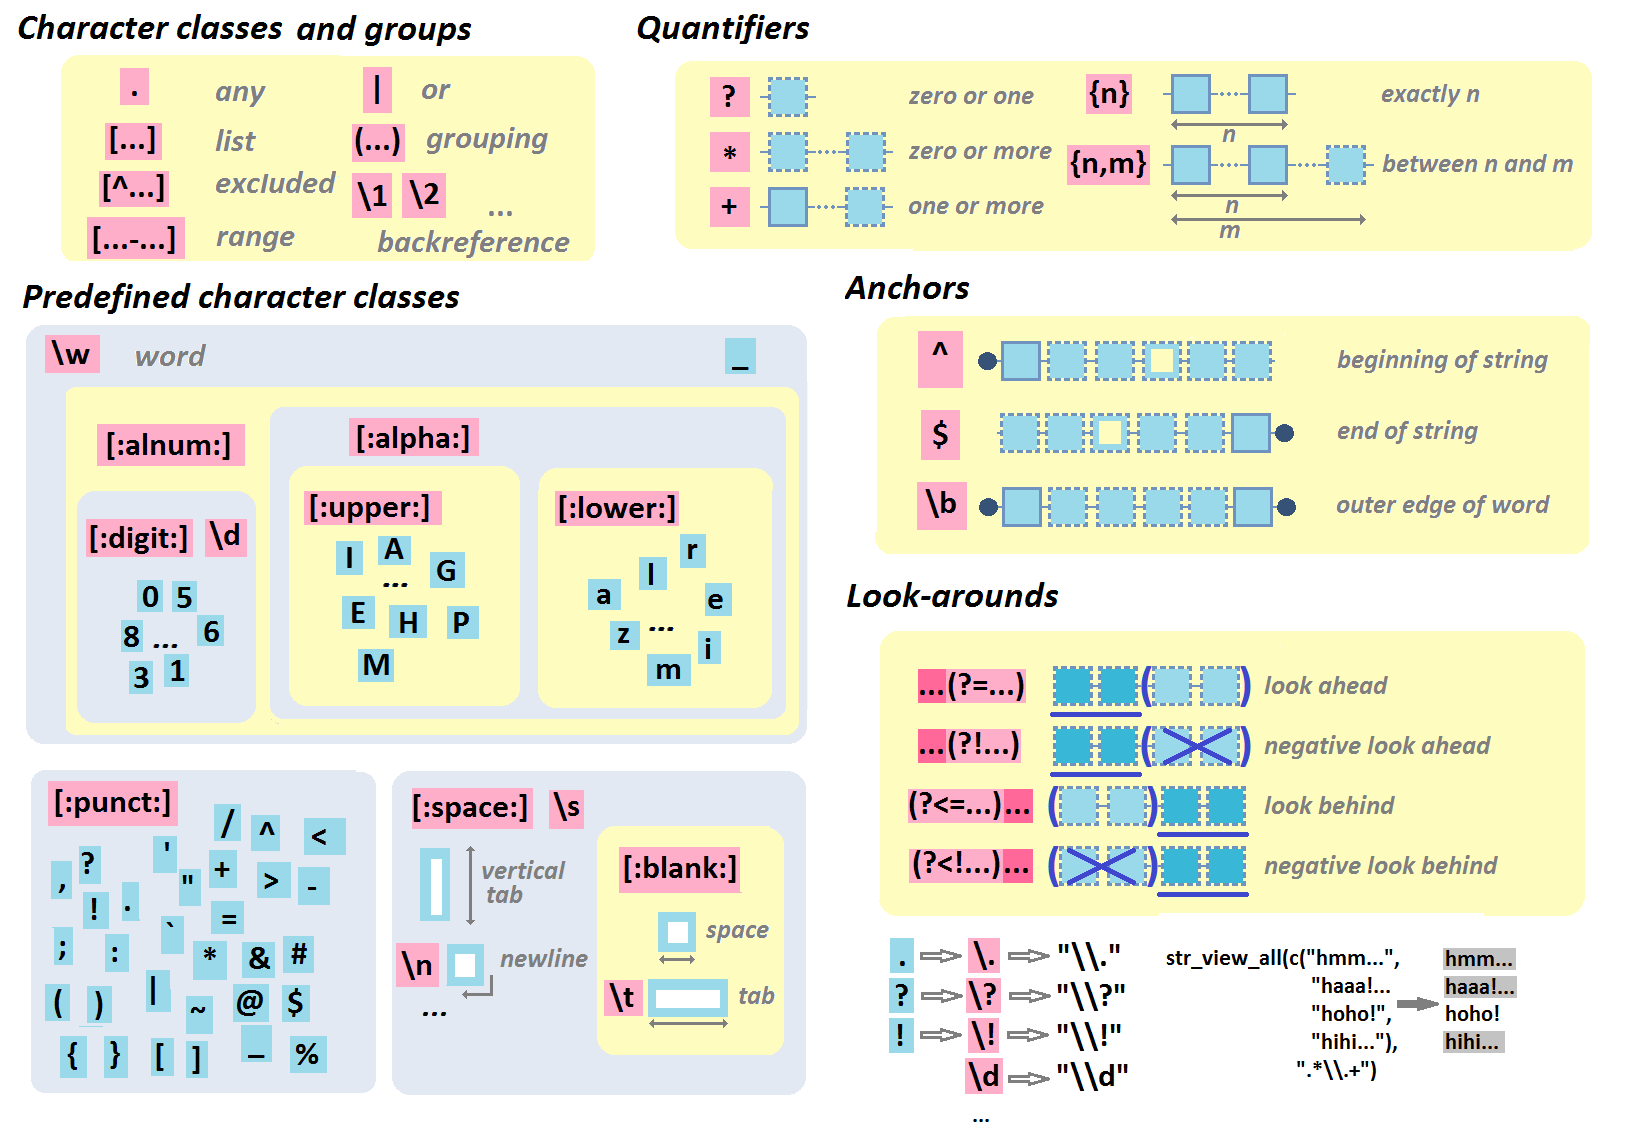
Help yourself to these free books, tutorials, packages, cheat sheets, and many more materials for R programming. There’s a separate overview for handy R programming tricks. If you have additions, please comment below or contact me!
Integrated Development Environments (IDEs) & Graphical User Inferfaces (GUIs)
Descriptions mostly taken from their own websites:
RStudio*** – Open source and enterprise ready professional software
Jupyter Notebook*** – open-source web application that allows you to create and share documents that contain live code, equations, visualizations and narrative text across dozens of programming languages.


![indico_features_img_callout_small-1024x973[1].jpg](https://paulvanderlaken.com/wp-content/uploads/2017/08/indico_features_img_callout_small-1024x9731.jpg?w=1108)

