Category: application

Google Facets: Interactive Visualization for Everybody

Google Facets: Interactive Visualization for Everybody

Last week, Google released Facets, their new, open source visualization tool. Facets consists of two interfaces that allow users to investigate their data at different levels.

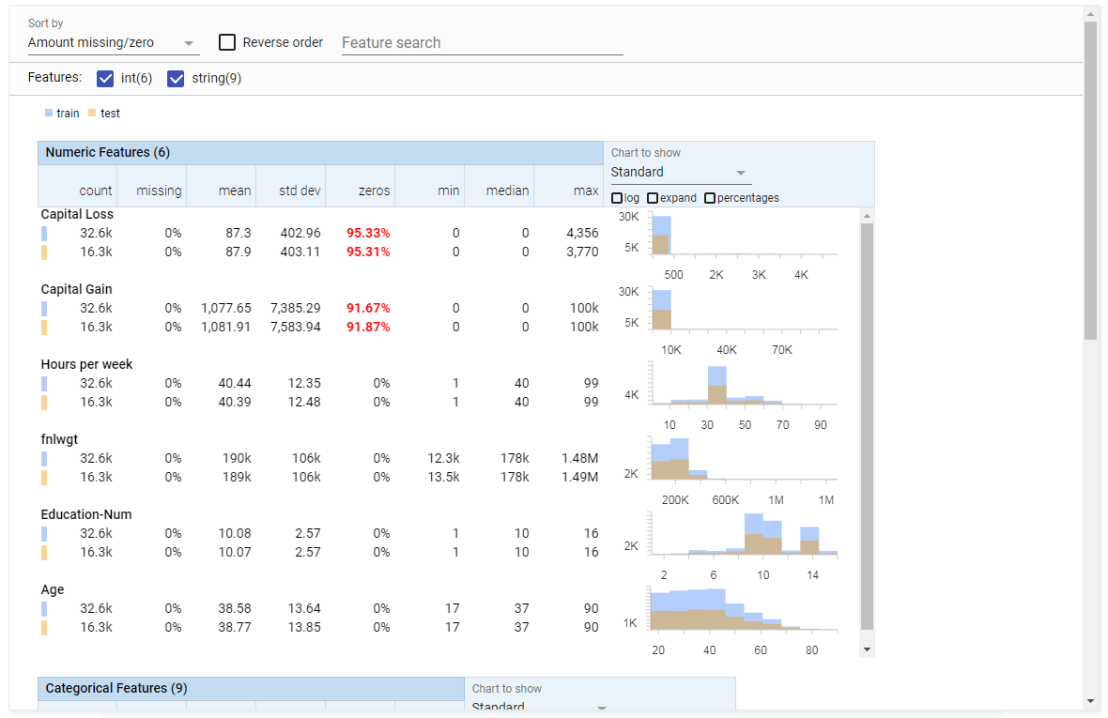
Facets Overview provides users with a quick understanding of the distribution of values across the variables in their dataset. Overview is especially helpful in detecting unexpected values, missing values, unbalanced distributions, and skewed distributions. Overview will detect all kinds of statistics for every column (i.e., variable) in your dataset, along with some simple vizualizations, such as histograms.

Overview
Example of Facets Overview tool

Dive is the name of the second interface of Facets. It provides an intuitive dashboard in which users can explore relationships between data points across the different variables in their dataset. The dashboard is easy to customize and users can control the position, color, and visual representation of each data point based on the underlying values.

Dive
Example of Facets Dive tool

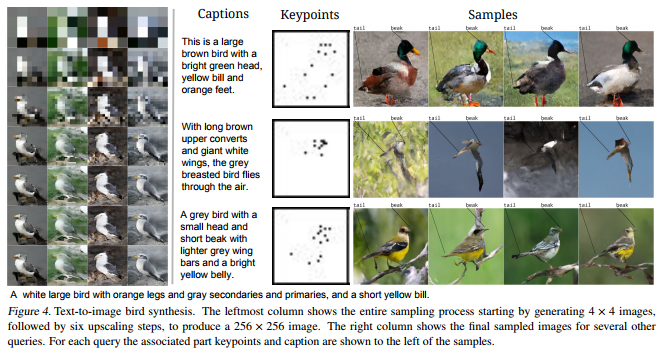
Moreover, if the data points have images associated with them, these images can be used as the visual representations of the data points. The latter is especially helpful when Facets is used for its actual purpose: aiding in machine learning processes. The below GIF demonstrates how Facets Dive spots incorrectly labelled images with ease, allowing users to zoom in on a case-by-case level, for instance, to identify a frog that has been erroneously labelled as a cat.

Exploration of the CIFAR-10 dataset using Facets Dive

To use a demo version of the tools with your own data, visit the Facets website. For more details, visit the Facets website or Google’s Research blog on Facets.

Generating images from scratch: Parallel Multiscale Autoregressive Density Estimation

Generating images from scratch: Parallel Multiscale Autoregressive Density Estimation

A while ago, I blogged about this new algorithm, pix2code, which takes in pictures of graphical user interfaces and outputs the underlying code. Today, I discovered another fantastic algorithm, by Scott Reed and his colleagues at Google Deepmind. txt2pix would be a catchy name for this algorithm, as it can take in a fairly complex sentence (e.g., “a grey bird with a black head, orange eyes, and a yellow beak“) and generate a completely new and unique image based on its content. In their recently published paper, they elaborate on the algorithms inner workings.

Deepmind.png
An example of the training and generation process reported in the paper

Scott and his team have been working on this project for quite some time. The early version of the algorithm generated an image one pixel at a time, but it had difficulties generating large or high-quality images. After picking a starting pixel to generate, any consecutively generated pixel the algorithm generates needs to align with its neighbours. For example, if pixel A is the first pixel in the generation of the yellow beak of a bird, any pixels that are created in the neighbourhood of that pixel should take into account that pixel A is trying to visualize a yellow beak, and behave accordingly: either continuing the beak, or ending the beak and starting on another element of the image.

The problem with such an iterative approach (i.e., pixel by pixel) is that it can take a very long time for a computer to generate an image. Considering that a fairly small image, say 256 by 256 pixels, already contains 65.536 pixels, each of which needs to be generated while considering all its neighbours and keeping in mind the bigger picture. In the most recent, updated version of the algorithm, Scott and his team have allowed the generation of multiple unrelated pixels simultaneously at different ‘zones’ of the image. Hence the Parallel in Parallel Multiscale Autoregressive Density Estimation. With this parallel approach, the algorithm can now generate the pixels representing the yellow beak in one area of the image, while simultaneously generating pixels for the bird’s wings and the branch it’s sitting on at different sections of the image. This speeds up the process quite extensively, demanding less computation time, thus allowing for quicker image generation.

I can definitely recommend that you check out Scott Reeds’ twitter feed for some amazing animated GIFs of the generation process:

If you want to know more details behind the algorithm but do not fancy reading the entire paper, I recommend this short explanation video by Károly Zsolnai-Fehér (what a name!) of Two Minute papers:

Digitizing the Tour de France 2017

Digitizing the Tour de France 2017

Combining two of my favorite things, Dimension Data elaborates on how they are using data, machine learning and predictive modeling to take the Tour de France experience to the next level in 2017.

Eurosport already jumped on the bandwagon in 2016 with some amazing visualizations of common Tour scenarios. Here is one on how to win a sprint:

And one on how to beat the crosswind:

pix2code: teaching AI to build apps

Last May, Tony Beltramelli of Ulzard Technologies presented his latest algorithm pix2code at the NIPS conference. Put simply, the algorithm looks at a picture of a graphical user interface (i.e., the layout of an app), and determines via an iterative process what the underlying code likely looks like.

Afbeeldingsresultaat voor user interface
Graphical user interface examples (Google Images)

Please watchUlzard’s pix2code demo video or the third-party summary at the bottom of this blog. My undertanding is that pix2code is based on convolutional and recurrent neural networks (long explanation video) in combination with long short-term memory (short explanation video). Based on a single input image, pix2code can generate code that is 77% accurate and it works for three of the larger platforms (i.e. iOS, Android and web-based technologies).

The input and output of pix2code

Obviously, this is groundbreaking technology. When further developed, pix2code not only increases the speed with which society is automated/robotized but it also further expands the automation to more complex and highly needed tasks, such as programming and web/app development.

Here you can read the full academic paper on pix2code.

Below is the official demo reviewed by another data enthusiast with commentary and some additional food for thought.

Read here some of my other blogs on neural networks and robotization:

R learning: Neural Networks

R learning: Neural Networks

Artificial neural networks (ANNs) are computing systems inspired by the human brain. They can teach themselves to do tasks, simply by considering examples of the tasks’ outcome. For example, they can learn to identify images that contain cats by analyzing example images that have been tagged “cat” or “no cat”. When given enough examples, the neural network can autonomously determine whether “untagged” images include cats or not (Wikipedia). If you want to learn more and have 20 minutes to spare, I can recommend this YouTube video by Brandon Rohrer.

Neural networks are commonly used for those machine learning problems where there is a vast amount of (complex) data available. Some toy examples include fingerprint recognition, language translation, car steering behaviours, object detection, text generation, and doodle recognition (by Google). Chances are pretty high that any system that makes complex recommendations these days (e.g., “Is this John in the picture?”, “Did you mean “South End Taco’s” instead of “Sout En dTacos”?”) has a neural net running in the background.

http://www.r-exercises.com designs tutorials for beginning programmers in R. On their website they host a learning series on neural networks, consisting of three sets of exercises: Part 1Part 2, and Part 3. Afterwards, you can check your performance with the solutions: Solutions 1Solutions 2, and Solutions 3.

Keep on learning!

P.S. afterwards you might want to check out this package and API for deep learning in R and Python.

TACIT: An open-source Text Analysis, Crawling, and Interpretation Tool

Click here for the original PDF: TACIT 2017


The first programs for (scientific) text mining are already over 50 years old. More recent efforts, such as the Linguistic Inquiry Word Count (LIWC; Tausczik & Pennebaker, 2010), have greatly improved our text analytical capabilities. Moreover, several single-purpose programs have been developed, which also consider syntactic text structures (e.g., Syntactic Complexity Analyzer [Lu, 2010], TAALES [Kyle & Crossley, 2015]).However, the widespread use of many of these programs has been hampered by two major barriers.

First, considerable technical expertise is required, which obstructs researchers without statistical backgrounds. For example, packages such as tm in R (Meyer et al., 2015) have been developed to conduct natural-language processing, but the steep learning curve forms a challenge. Additionally, the constant increase of computational processing power and the proliferation of new algorithms makes it difficult for researchers to maintain working knowledge of state-of-the-art methods.

Alternatively, most of the existing user-friendly NLP programs (and packages), such as RapidMiner (Akthar & Hahne, 2012), SAS Text Miner (Abell, 2014), or SPSS Modeler (IBM Corp., 2011), charge either a large software fee up front or a subscription fee. The cost of these programs can be prohibitively expensive for junior researchers and researchers looking to integrate new techniques into their research toolbox.

In the attached article, TACIT is introduced: Text Analysis, Crawling and Investigation Tool. TACIT is an open-source architecture that establishes a pipeline between the various stages of text-based research by integrating tools for text mining, data cleaning, and analysis under a single user-friendly architecture. In addition to being prepackaged with a range of easily applied, cutting-edge methods, TACIT’s design also allows other researchers to write their own plugins.

The authors’ hope is that TACIT can facilitate the integration and use of advancements in computational linguistics in psychological research, and by doing so can help researchers make use of the ever-growing documents of our social discourse in ways that have previously not been possible.