Tag: generation

Generative art: Let your computer design you a painting

Generative art: Let your computer design you a painting

I really like generative art, or so-called algorithmic art. Basically, it means you take a pattern or a complex system of rules, and apply it to create something new following those patterns/rules.

When I finished my PhD, I got a beautiful poster of where the k-nearest neighbors algorithms was used to generate a set of connected points.

Marcus Volz’ nearest neighbors graph, via https://marcusvolz.com/#nearest-neighbour-graph

My first piece of generative art.

As we recently moved into our new house, I decided I wanted to have a brother for the knn-poster. So I did some research in algorithms I wanted to use to generate a painting. I found some very cool ones, of which I unforunately can’t recollect the artists anymore:

However, I preferred to make one myself. So we again turned to the work of the author that made the knn-poster: Marcus Volz.

He has written (in R) many other algorithms. And we found that one specifically nicely matched the knn-poster. His metropolis – or generative city:

Marcus’ generative city, via https://marcusvolz.com/#generative-city

However, I wanted to make one myself, so I download Marcus code, and tweaked it a bit. Most importantly, I made it start in the center, made it fill up the whole space, and I made it run more efficient so I could generate a couple dozen large cities quickly, and pick the one I liked most. Here’s the end result:

And in action, in my living room:

You can find my code here on github.

Simulating data with Bayesian networks, by Daniel Oehm

Simulating data with Bayesian networks, by Daniel Oehm

Daniel Oehm wrote this interesting blog about how to simulate realistic data using a Bayesian network.

Bayesian networks are a type of probabilistic graphical model that uses Bayesian inference for probability computations. Bayesian networks aim to model conditional dependence, and therefore causation, by representing conditional dependence by edges in a directed graph. Through these relationships, one can efficiently conduct inference on the random variables in the graph through the use of factors.

Devin Soni via Medium

As Bayes nets represent data as a probabilistic graph, it is very easy to use that structure to simulate new data that demonstrate the realistic patterns of the underlying causal system. Daniel’s post shows how to do this with bnlearn.

Daniel’s example Bayes net

New data is simulated from a Bayes net (see above) by first sampling from each of the root nodes, in this case sex. Then followed by the children conditional on their parent(s) (e.g. sport | sex and hg | sex) until data for all nodes has been drawn. The numbers on the nodes below indicate the sequence in which the data is simulated, noting that rcc is the terminal node.

Daniel Oehms in his blog

The original and simulated datasets are compared in a couple of ways 1) observing the distributions of the variables 2) comparing the output from various models and 3) comparing conditional probability queries. The third test is more of a sanity check. If the data is generated from the original Bayes net then a new one fit on the simulated data should be approximately the same. The more rows we generate the closer the parameters will be to the original values.

The original data alongside the generated data in Daniel’s example

As you can see, a Bayesian network allows you to generate data that looks, feels, and behaves a lot like the data on which you based your network on in the first place.

This can be super useful if you want to generate a synthetic / fake / artificial dataset without sharing personal or sensitive data.

Moreover, the underlying Bayesian net can be very useful to compute missing values. In Daniel’s example, he left out some values on purpose (pretending they were missing) and imputed them with the Bayes net. He found that the imputed values for the missing data points were quite close to the original ones:

For two variables, the original values plotted against the imputed replacements.

In the original blog, Daniel goes on to show how to further check the integrity of the simulated data using statistical models and shares all his code so you can try this out yourself. Please do give his website a visit as Daniel has many more interesting statistics blogs!

Building a realistic Reddit AI that get upvoted in Python

Building a realistic Reddit AI that get upvoted in Python

Sometimes I find these AI / programming hobby projects that I just wished I had thought of…

Will Stedden combined OpenAI’s GPT-2 deep learning text generation model with another deep-learning language model by Google called BERT (Bidirectional Encoder Representations from Transformers) and created an elaborate architecture that had one purpose: posting the best replies on Reddit.

The architecture is shown at the end of this post — copied from Will’s original blog here. Moreover, you can read this post for details regarding the construction of the system. But let me see whether I can explain you what it does in simple language.

The below is what a Reddit comment and reply thread looks like. We have str8cokane making a comment to an original post (not in the picture), and then tupperware-party making a reply to that comment, followed by another reply by str8cokane. Basically, Will wanted to create an AI/bot that could write replies like tupperware-party that real people like str8cokane would not be able to distinguish from “real-people” replies.

Note that with 4 points, str8cokane‘s original comments was “liked” more than tupperware-party‘s reply and str8cokane‘s next reply, which were only upvoted 2 and 1 times respectively.

gpt2-bert on China
Example reddit comment and replies (via bonkerfield.org/)

So here’s what the final architecture looks like, and my attempt to explain it to you.

  1. Basically, we start in the upper left corner, where Will uses a database (i.e. corpus) of Reddit comments and replies to fine-tune a standard, pretrained GPT-2 model to get it to be good at generating (red: “fake”) realistic Reddit replies.
  2. Next, in the upper middle section, these fake replies are piped into a standard, pretrained BERT model, along with the original, real Reddit comments and replies. This way the BERT model sees both real and fake comments and replies. Now, our goal is to make replies that are undistinguishable from real replies. Hence, this is the task the BERT model gets. And we keep fine-tuning the original GPT-2 generator until the BERT discriminator that follows is no longer able to distinguish fake from real replies. Then the generator is “fooling” the discriminator, and we know we are generating fake replies that look like real ones!
    You can find more information about such generative adversarial networks here.
  3. Next, in the top right corner, we fine-tune another BERT model. This time we give it the original Reddit comments and replies along with the amount of times they were upvoted (i.e. sort of like likes on facebook/twitter). Basically, we train a BERT model to predict for a given reply, how much likes it is going to get.
  4. Finally, we can go to production in the lower lane. We give a real-life comment to the GPT-2 generator we trained in the upper left corner, which produces several fake replies for us. These candidates we run through the BERT discriminator we trained in the upper middle section, which determined which of the fake replies we generated look most real. Those fake but realistic replies are then input into our trained BERT model of the top right corner, which predicts for every fake but realistic reply the amount of likes/upvotes it is going to get. Finally, we pick and reply with the fake but realistic reply that is predicted to get the most upvotes!
What Will’s final architecture, combining GPT-2 and BERT, looked like (via bonkerfield.org)

The results are astonishing! Will’s bot sounds like a real youngster internet troll! Do have a look at the original blog, but here are some examples. Note that tupperware-party — the Reddit user from the above example — is actually Will’s AI.

COMMENT: 'Dune’s fandom is old and intense, and a rich thread in the cultural fabric of the internet generation' BOT_REPLY:'Dune’s fandom is overgrown, underfunded, and in many ways, a poor fit for the new, faster internet generation.'
bot responds to specific numerical bullet point in source comment

Will ends his blog with a link to the tutorial if you want to build such a bot yourself. Have a try!

Moreover, he also notes the ethical concerns:

I know there are definitely some ethical considerations when creating something like this. The reason I’m presenting it is because I actually think it is better for more people to know about and be able to grapple with this kind of technology. If just a few people know about the capacity of these machines, then it is more likely that those small groups of people can abuse their advantage.

I also think that this technology is going to change the way we think about what’s important about being human. After all, if a computer can effectively automate the paper-pushing jobs we’ve constructed and all the bullshit we create on the internet to distract us, then maybe it’ll be time for us to move on to something more meaningful.

If you think what I’ve done is a problem feel free to email me , or publically shame me on Twitter.

Will Stedden via bonkerfield.org/2020/02/combining-gpt-2-and-bert/

Neural Synesthesia: GAN AI dreaming of music

Neural Synesthesia: GAN AI dreaming of music

Xander Steenbrugge shared his latest work on LinkedIn yesterday, and I was completely stunned!

Xander had been working on, what he called, a “fun side-project”, but which was in my eyes, absolutely awesome. He had used two generative adversarial networks (GANs) to teach one another how to respond visually to changing audio cues.

This resulted in the generation of stunning audio-visual fanatasy worlds that are complete brain porn. You just can’t stop staring. So much is happening in these video’s; everything looks familiar, whereas nothing really represent anything realistic. There’s always a sliver of reality before the visual shapes morph to their next form.

Have a look yourself at the video’s on Xander’s new Youtube channel “Neural Synesthesia dedicated to this project. The videos are also hosted here on Vimeo, where they are rendered in higher resolution even.

This is my favorite video, but there are more below.

Amazing how the image responds to changes in the music, right? I suspect Xander let’s the algorithm traverse some latent space with spaces that are determined by the bass, trebble, and other audio-cues.

The audio behind the above video is also just enticing. The track is called Raindrops, by Kupla X j’san.

Here’s another one of Xander’s videos, with the same audio track as background:

But Xander didn’t limit his GANs to generating landscapes and still paintings, but he also dared to do some human faces. These also turned out amazing.

Both the left and right face seem to start out in about the same position/seed in the latent space, but traverse in different, though still similar directions, morphing into all kinds of reaslistic and more alien forms. The result is simply out of this world!

The music behind this video is by Phantom Studies, by Dettmann | Klock.

Curious to see where this project and others head as we continue to see development in this GAN field. This must turn the world of design and art up side down in the coming decade…

A beautiful machine-generated still from the Neural Synthesia videos (link)
Bellwoods: A procedurally generated game in only 13 kilobytes

Bellwoods: A procedurally generated game in only 13 kilobytes

JS13K Games is a competition where developers are challenged to create an entire game using less than 13 kilobytes of memory. Creative developer Matt Deslaudiers participated and created Bellwoods: an art game for mobile and desktop that you can play in your browser.

The concept of the game is simple: fly your kite through endless fields of colour and sound, trying to discover new worlds. To remain under 13kb, all of the graphics and audio in Bellwoods are procedurally generated. The game was mostly programmed in JavaScript with minimal custom HTML/CSS. Matt’s motivation and the actual development you can read about in his original blog. The source code the game, Matt also shared on GitHub.

Mélissa Hernandez, a French UX and Interaction Designer, helped Matt design this beautiful game. Together, they even versed a haiku that not only evokes the mood of the game, but also provides some subtle gameplay instructions:

over the tall grass
following birds, chasing wind
in search of color

Play the game yourself, or have a quick look and feel with the video below.

Generating Book Covers By Their Words — My Dissertation Cover

Generating Book Covers By Their Words — My Dissertation Cover

As some of you might know, I am defending my PhD dissertation later this year. It’s titled “Data-Driven Human Resource Management: The rise of people analytics and its application to expatriate management” and, over the past few months, I was tasked with designing its cover.

Now, I didn’t want to buy some random stock photo depicting data, an organization, or overly happy employees. I’d rather build something myself. Something reflecting what I liked about the dissertation project: statistical programming and sharing and creating knowledge with others.

Hence, I came up with the idea to use the collective intelligence of the People Analytics community to generate a unique cover. It required a dataset of people analytics-related concepts, which I asked People Analytics professionals on LinkedIn, Twitter, and other channels to help compile. Via a Google Form, colleagues, connections, acquitances, and complete strangers contributed hundreds of keywords ranging from the standard (employees, HRM, performance) to the surprising (monetization, quantitative scissors [which I had to Google]). After reviewing the list and adding some concepts of my own creation, I ended up with 1786 unique words related to either business, HRM, expatriation, data science, or statistics.

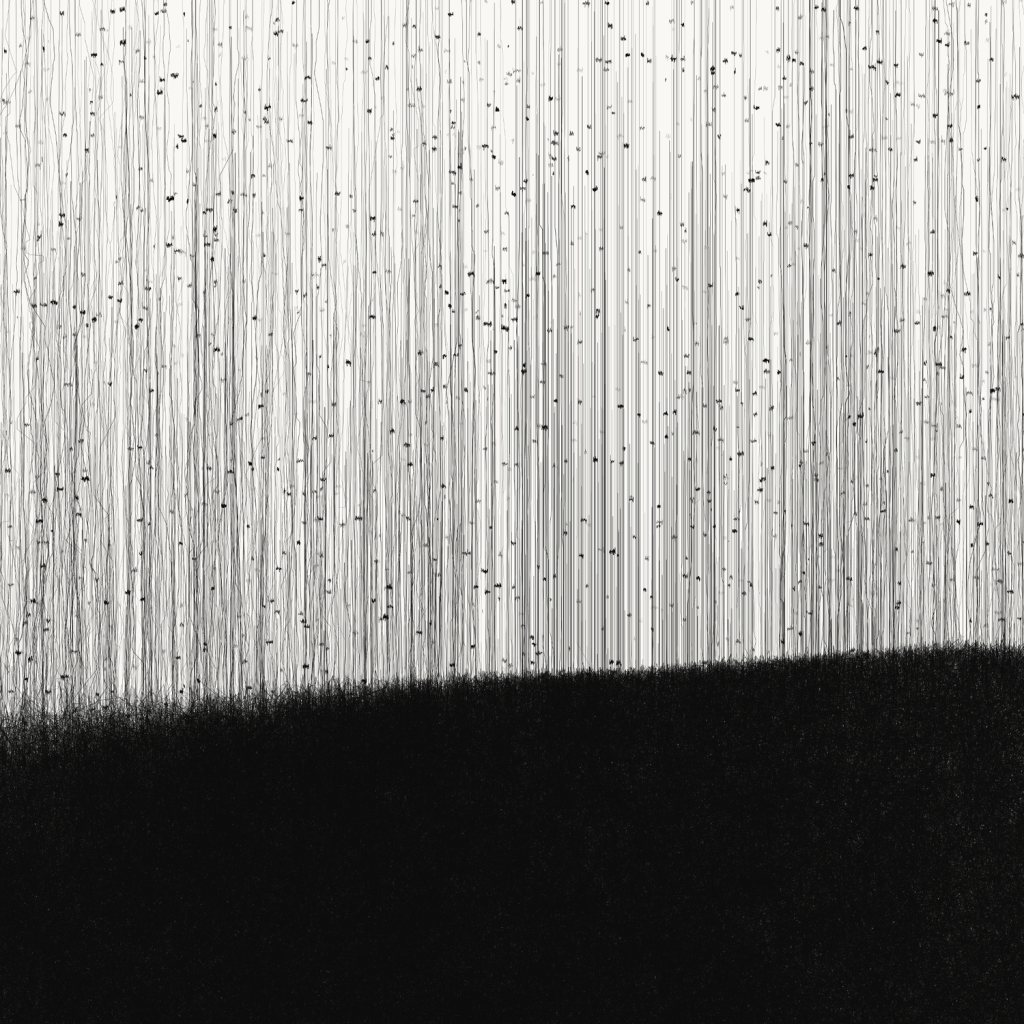
I very much dislike wordclouds (these are kind of cool though), but already had a different idea in mind. I thought of generating a background cover of the words relating to my dissertation topic, over which I could then place my title and other information. I wanted to place these keywords randomly, maybe using a color schema, or with some random sizes.

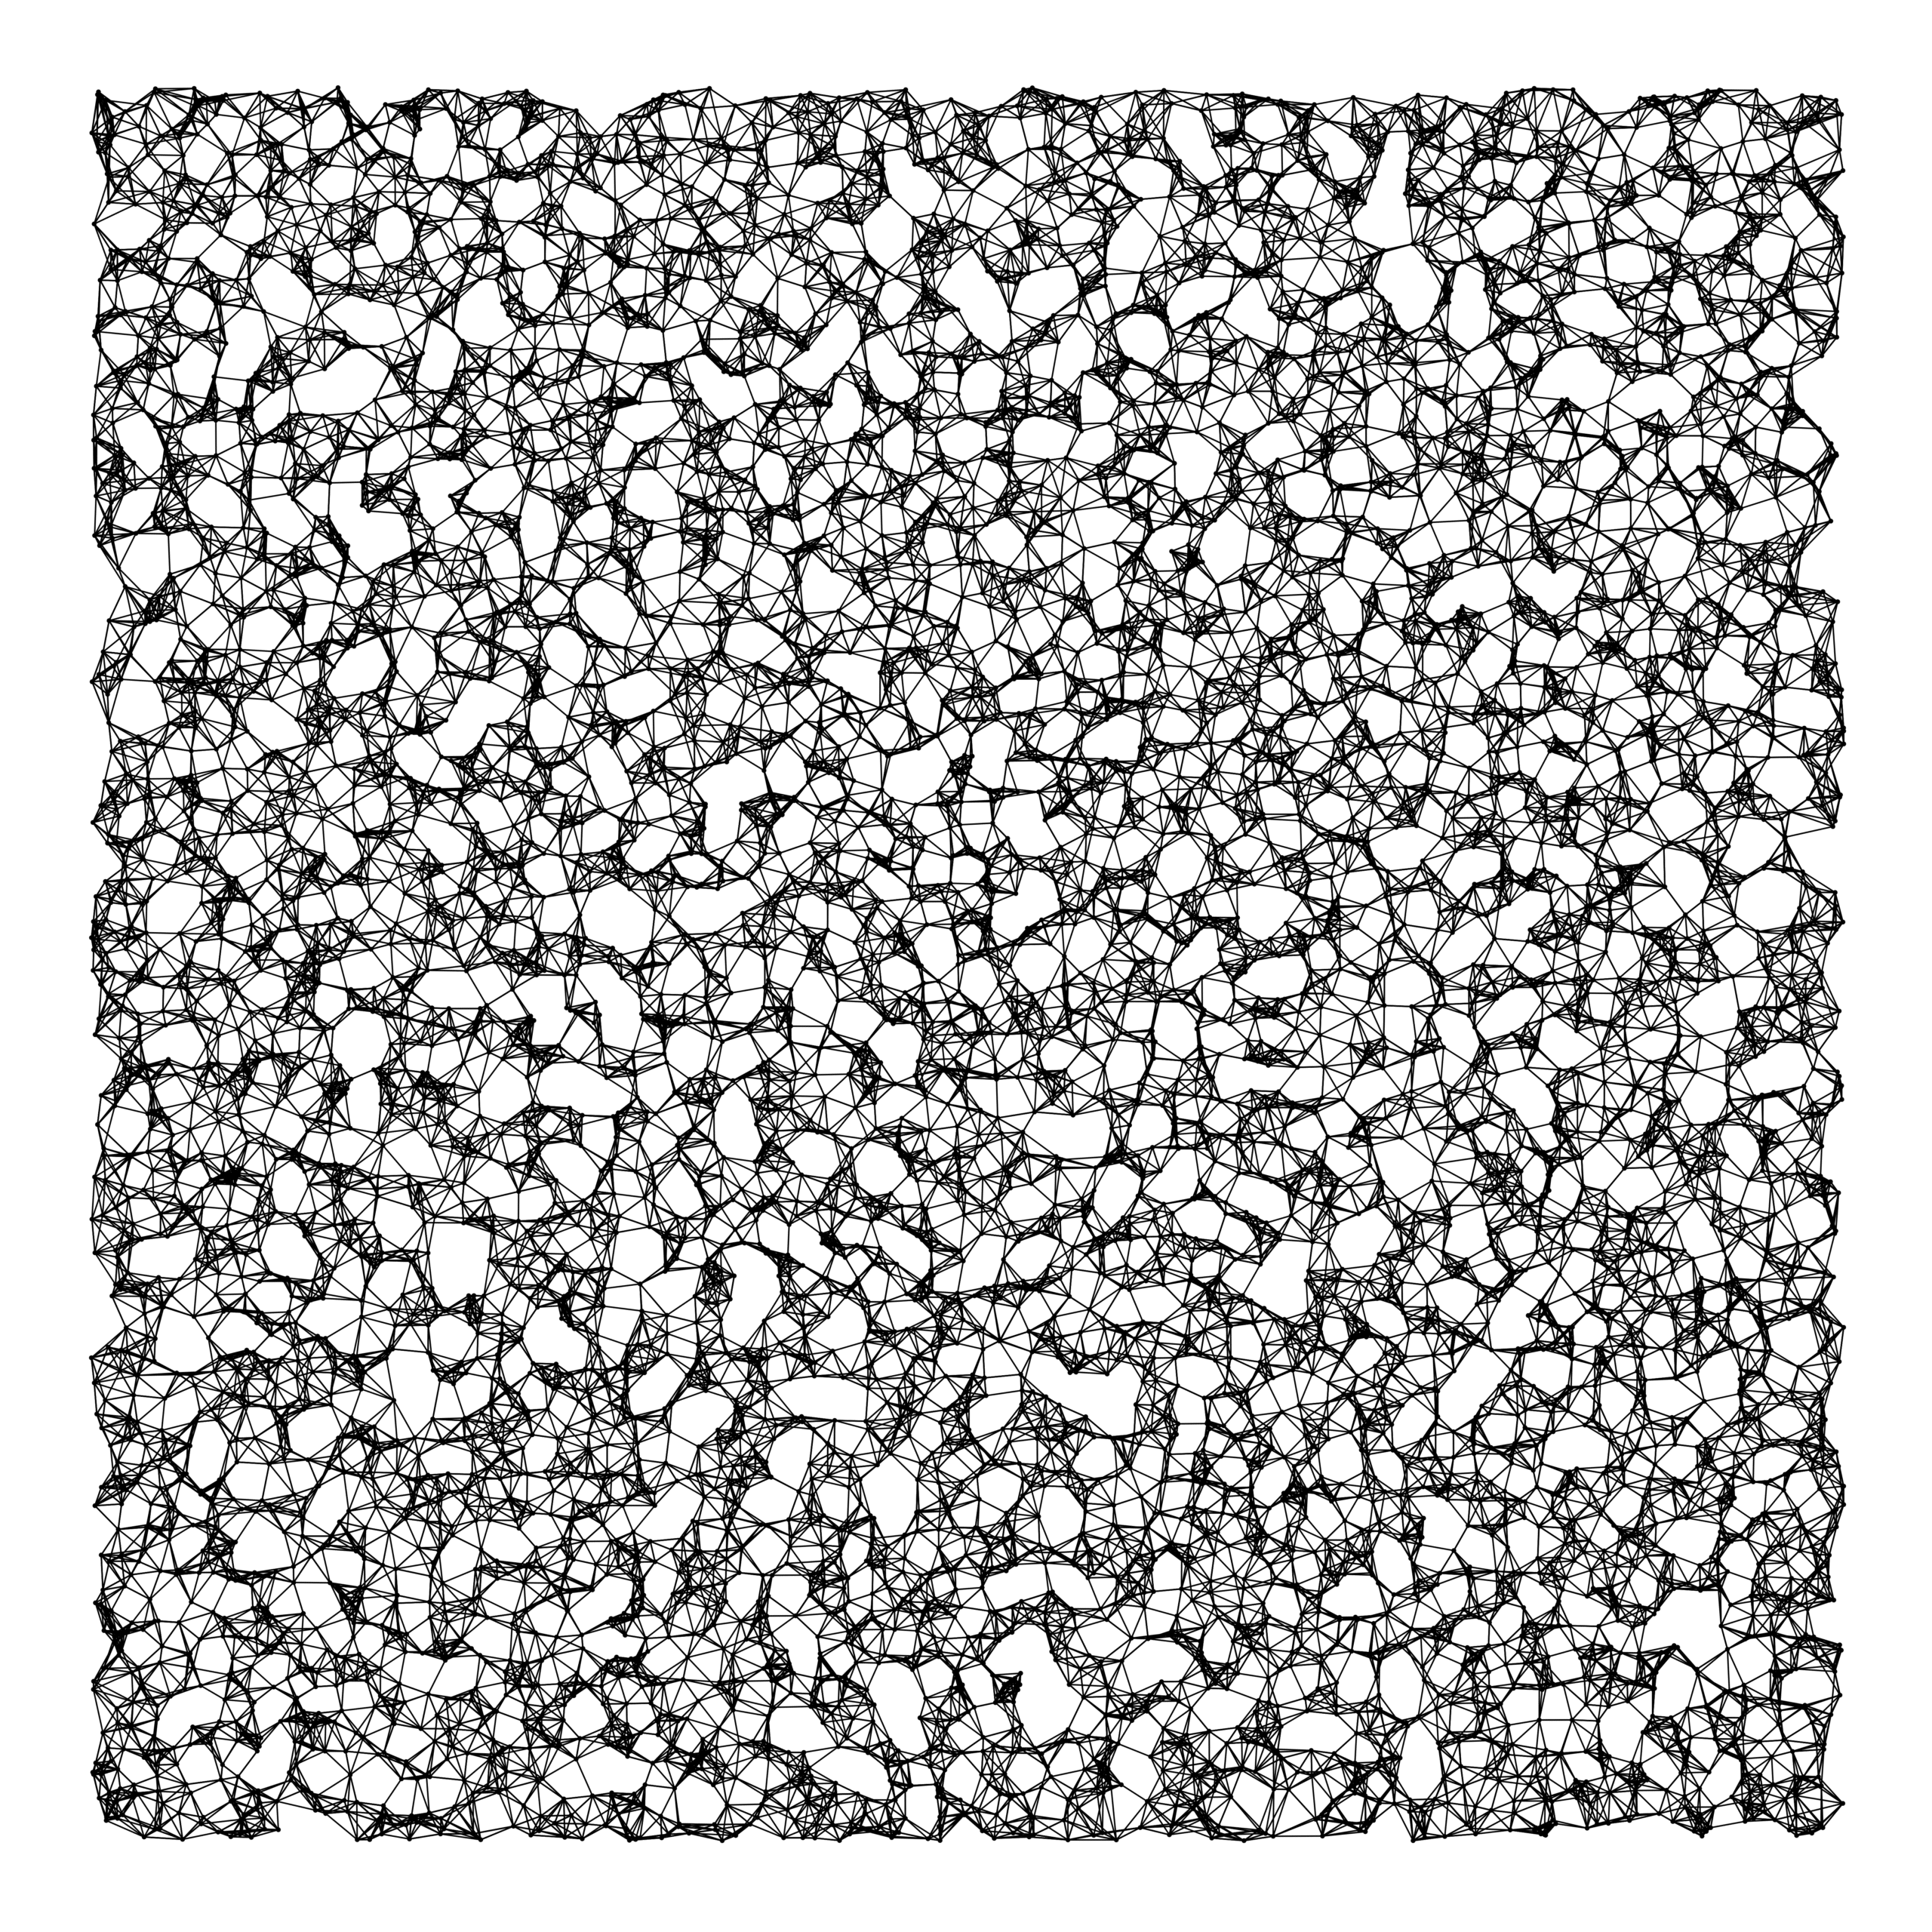
The picture below shows the result of one of my first attempts. I programmed everything in R, writing some custom functionality to generate the word-datasets, the cover-plot, and .png, .pdf, and .gif files as output.

canvas.PNG

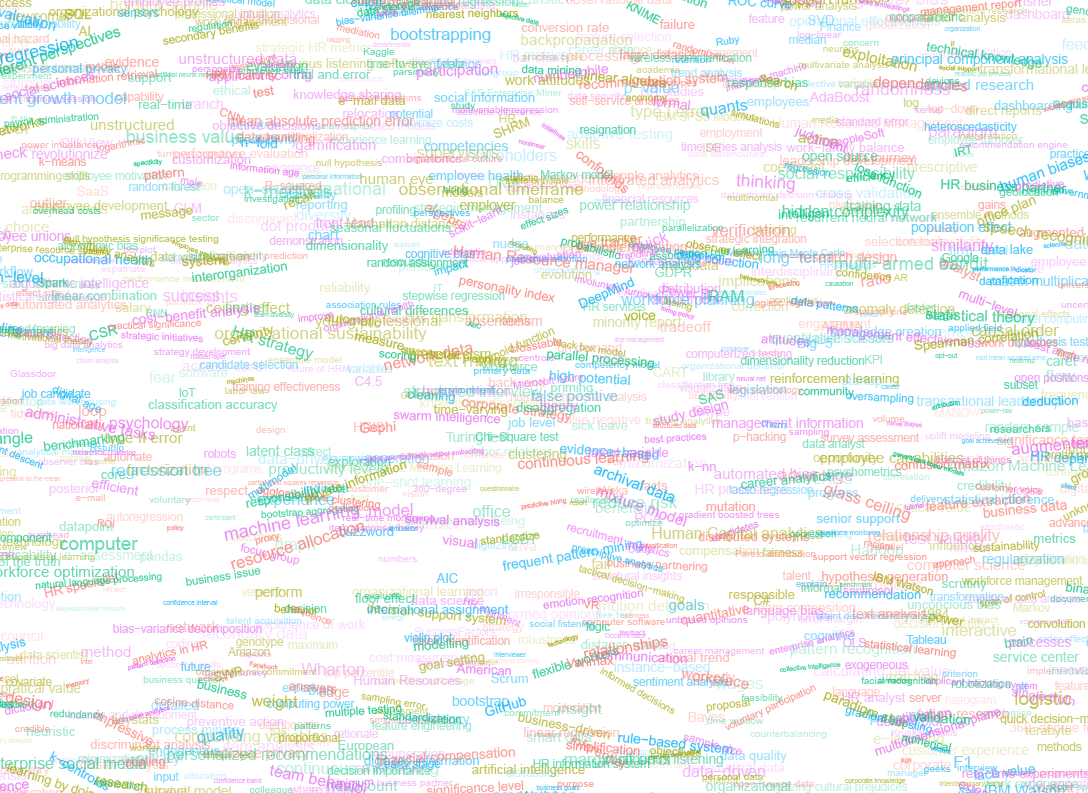
Random colors did not produce a pleasing result and I definitely needed more and larger words in order to fill my 17cm by 24cm canvas!

Hence, I started experimenting. Using base R’s expand.grid() and set.seed() together with mapply(), I could quickly explore and generate a large amount of covers based on different parameter settings and random fluctuations.

expand.grid(seed = c(1:3), 
            dupl = c(1:4, seq(5, 30, 5)),
            font = c("sans", "League Spartan"),
            colors = c(blue_scheme, red_scheme, 
                       rainbow_scheme, random_scheme),
            size_mult = seq(1, 3, 0.3),
            angle_sd = c(5, 10, 12, 15)) -> 
  param

mapply(create_textcover, 
       param$seed, param$dupl, 
       param$font, param$colors, 
       param$size_mult, param$angle_sd)

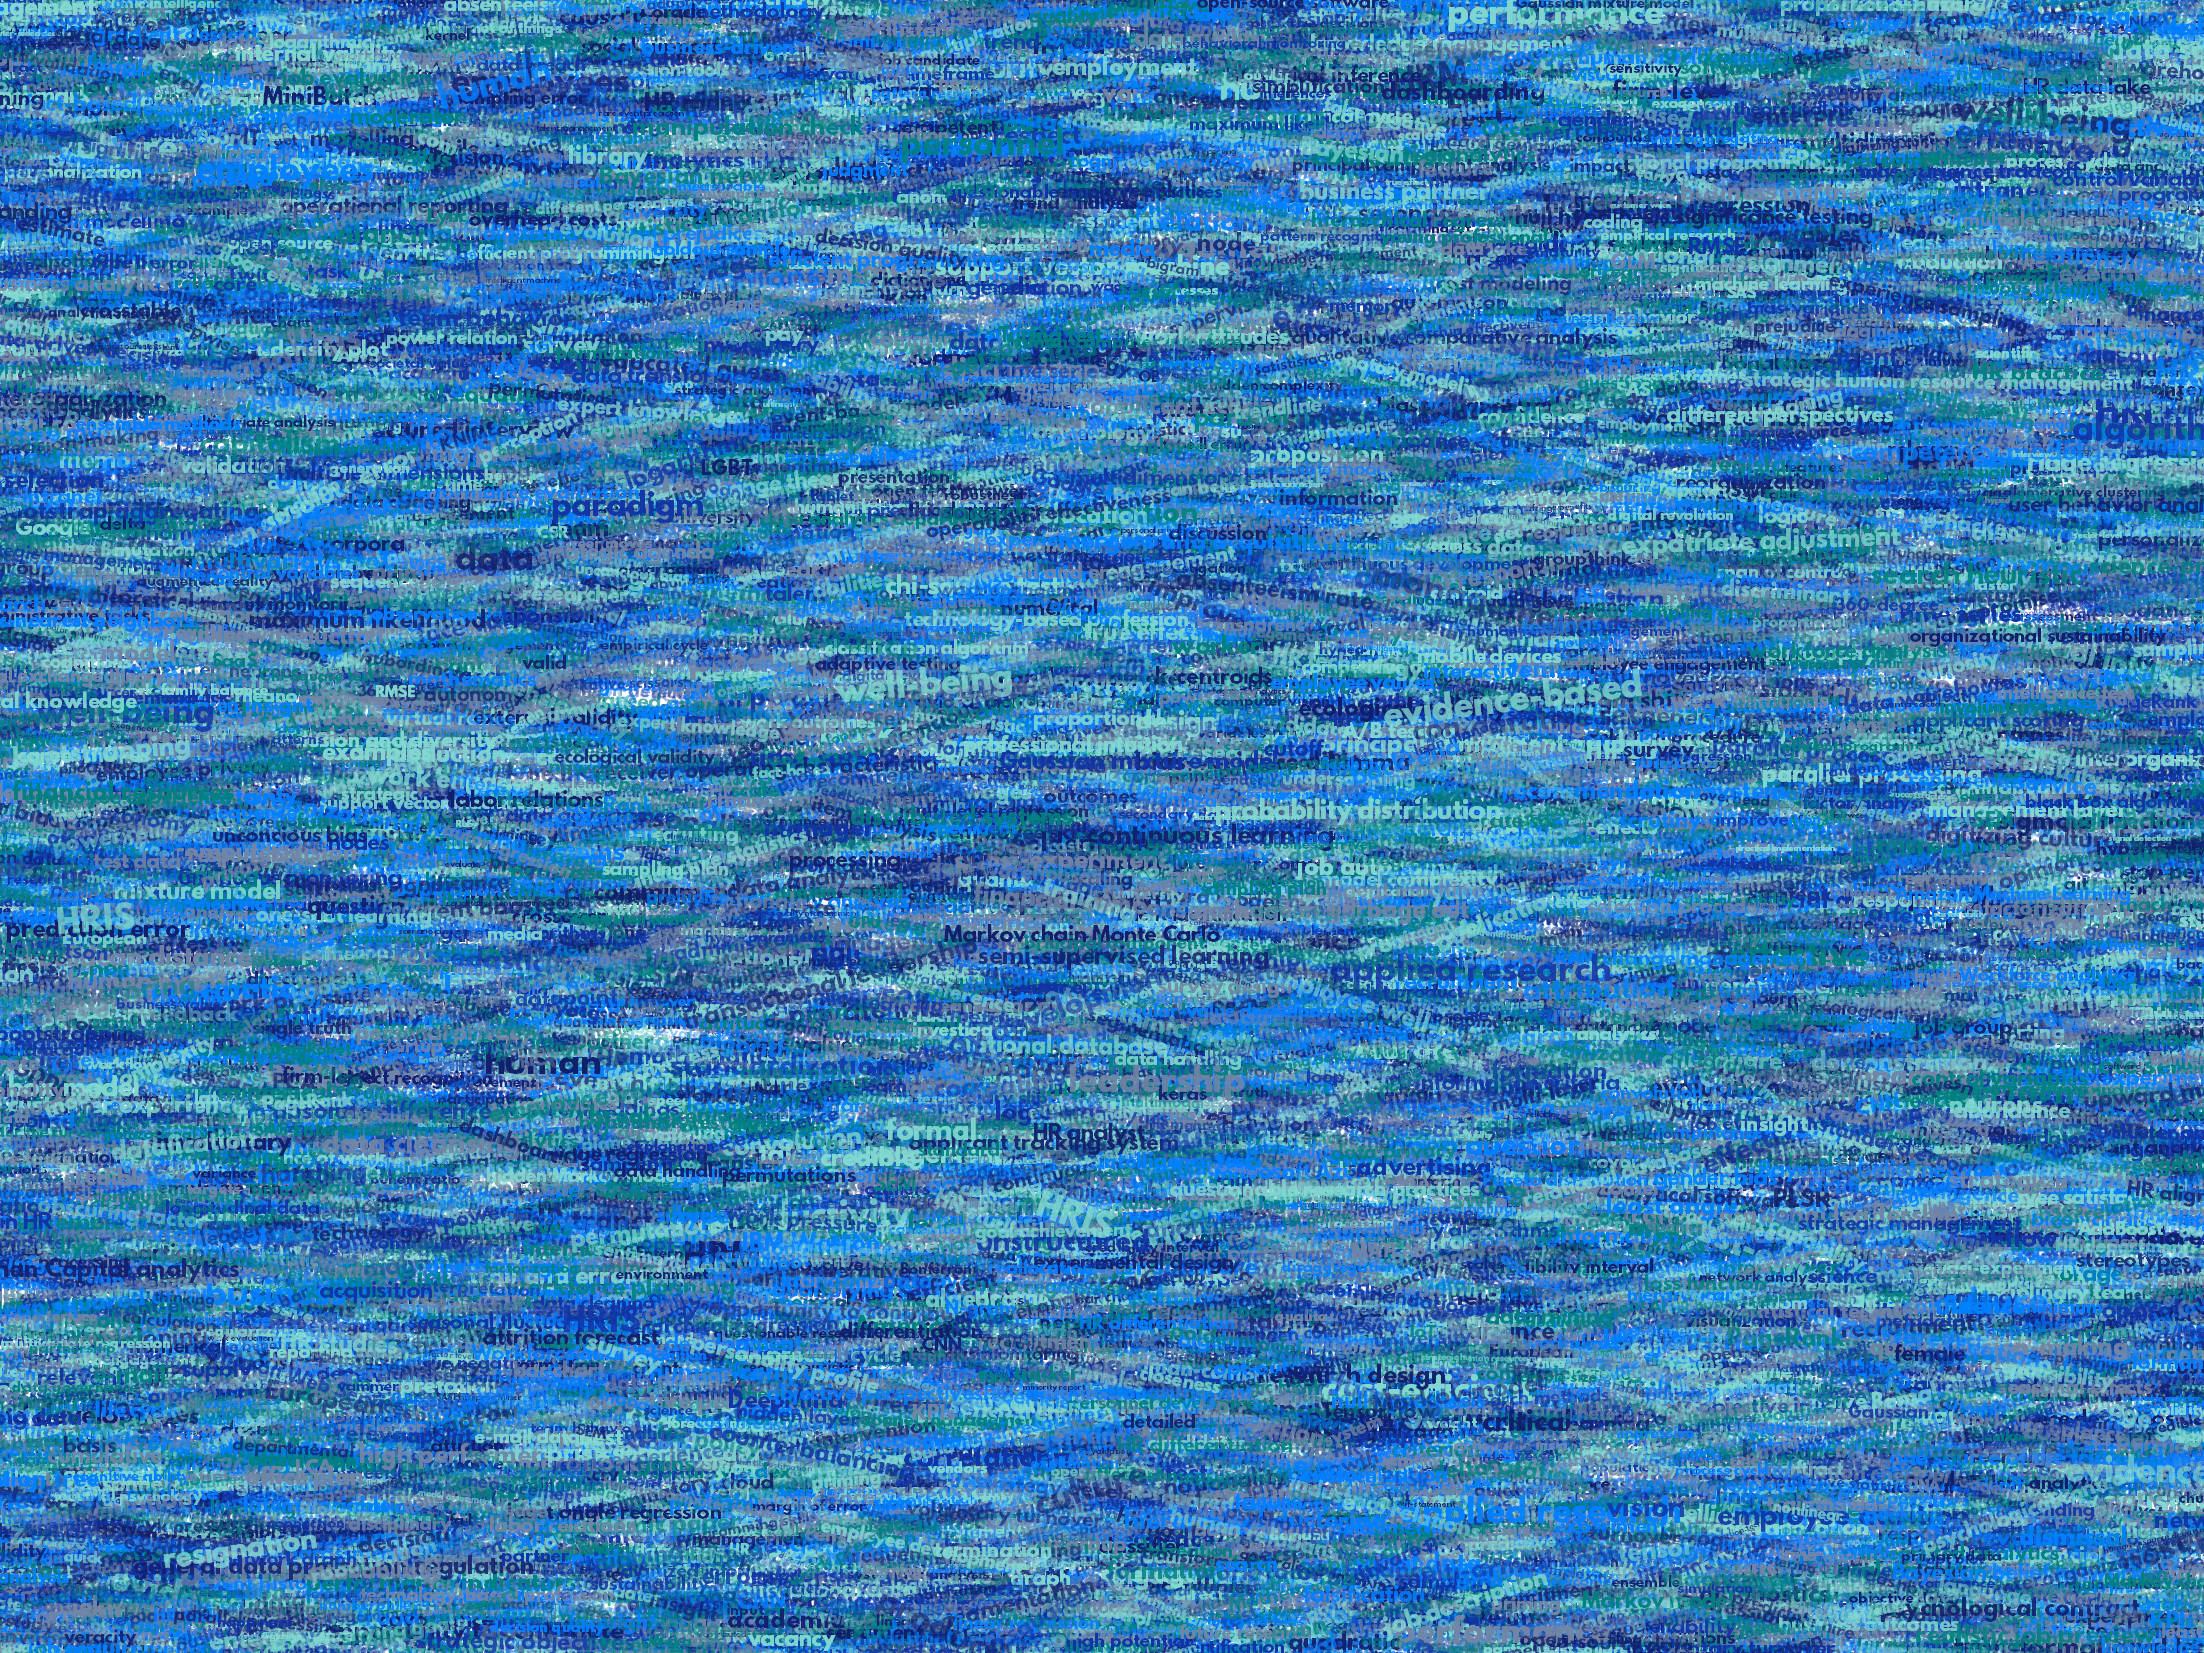
The generation process for each unique cover only took a few seconds, so I would generate a few hundred, quickly browse through them, update the parameters to match my preferences, and then generate a new set. Among others, I varied the color palette used, the size range of the words, their angle, the font used, et cetera. To fill up the canvas, I experimented with repeating the words: two, three, five, heck, even twenty, thirty times. After an evening of generating and rating, I came to the final settings for my cover:

  • Words were repeated twenty times in the dataset.
  • Words were randomly distributed across the canvas.
  • Words placed in random order onto the canvas, except for a select set of relevant words, placed last.
  • Words’ transparency ranged randomly between 0% and 70%.
  • Words’ color was randomly selected out of six colors from this palette of blues.
  • Words’ writing angles were normally distributed around 0 degrees, with a standard deviation of 12 degrees. However, 25% of words were explicitly without angle.
  • Words’ size ranged between 1 and 4 based on a negative binomial distribution (10 * 0.8) resulting in more small than large words. The set of relevant words were explicitly enlarged throughout.

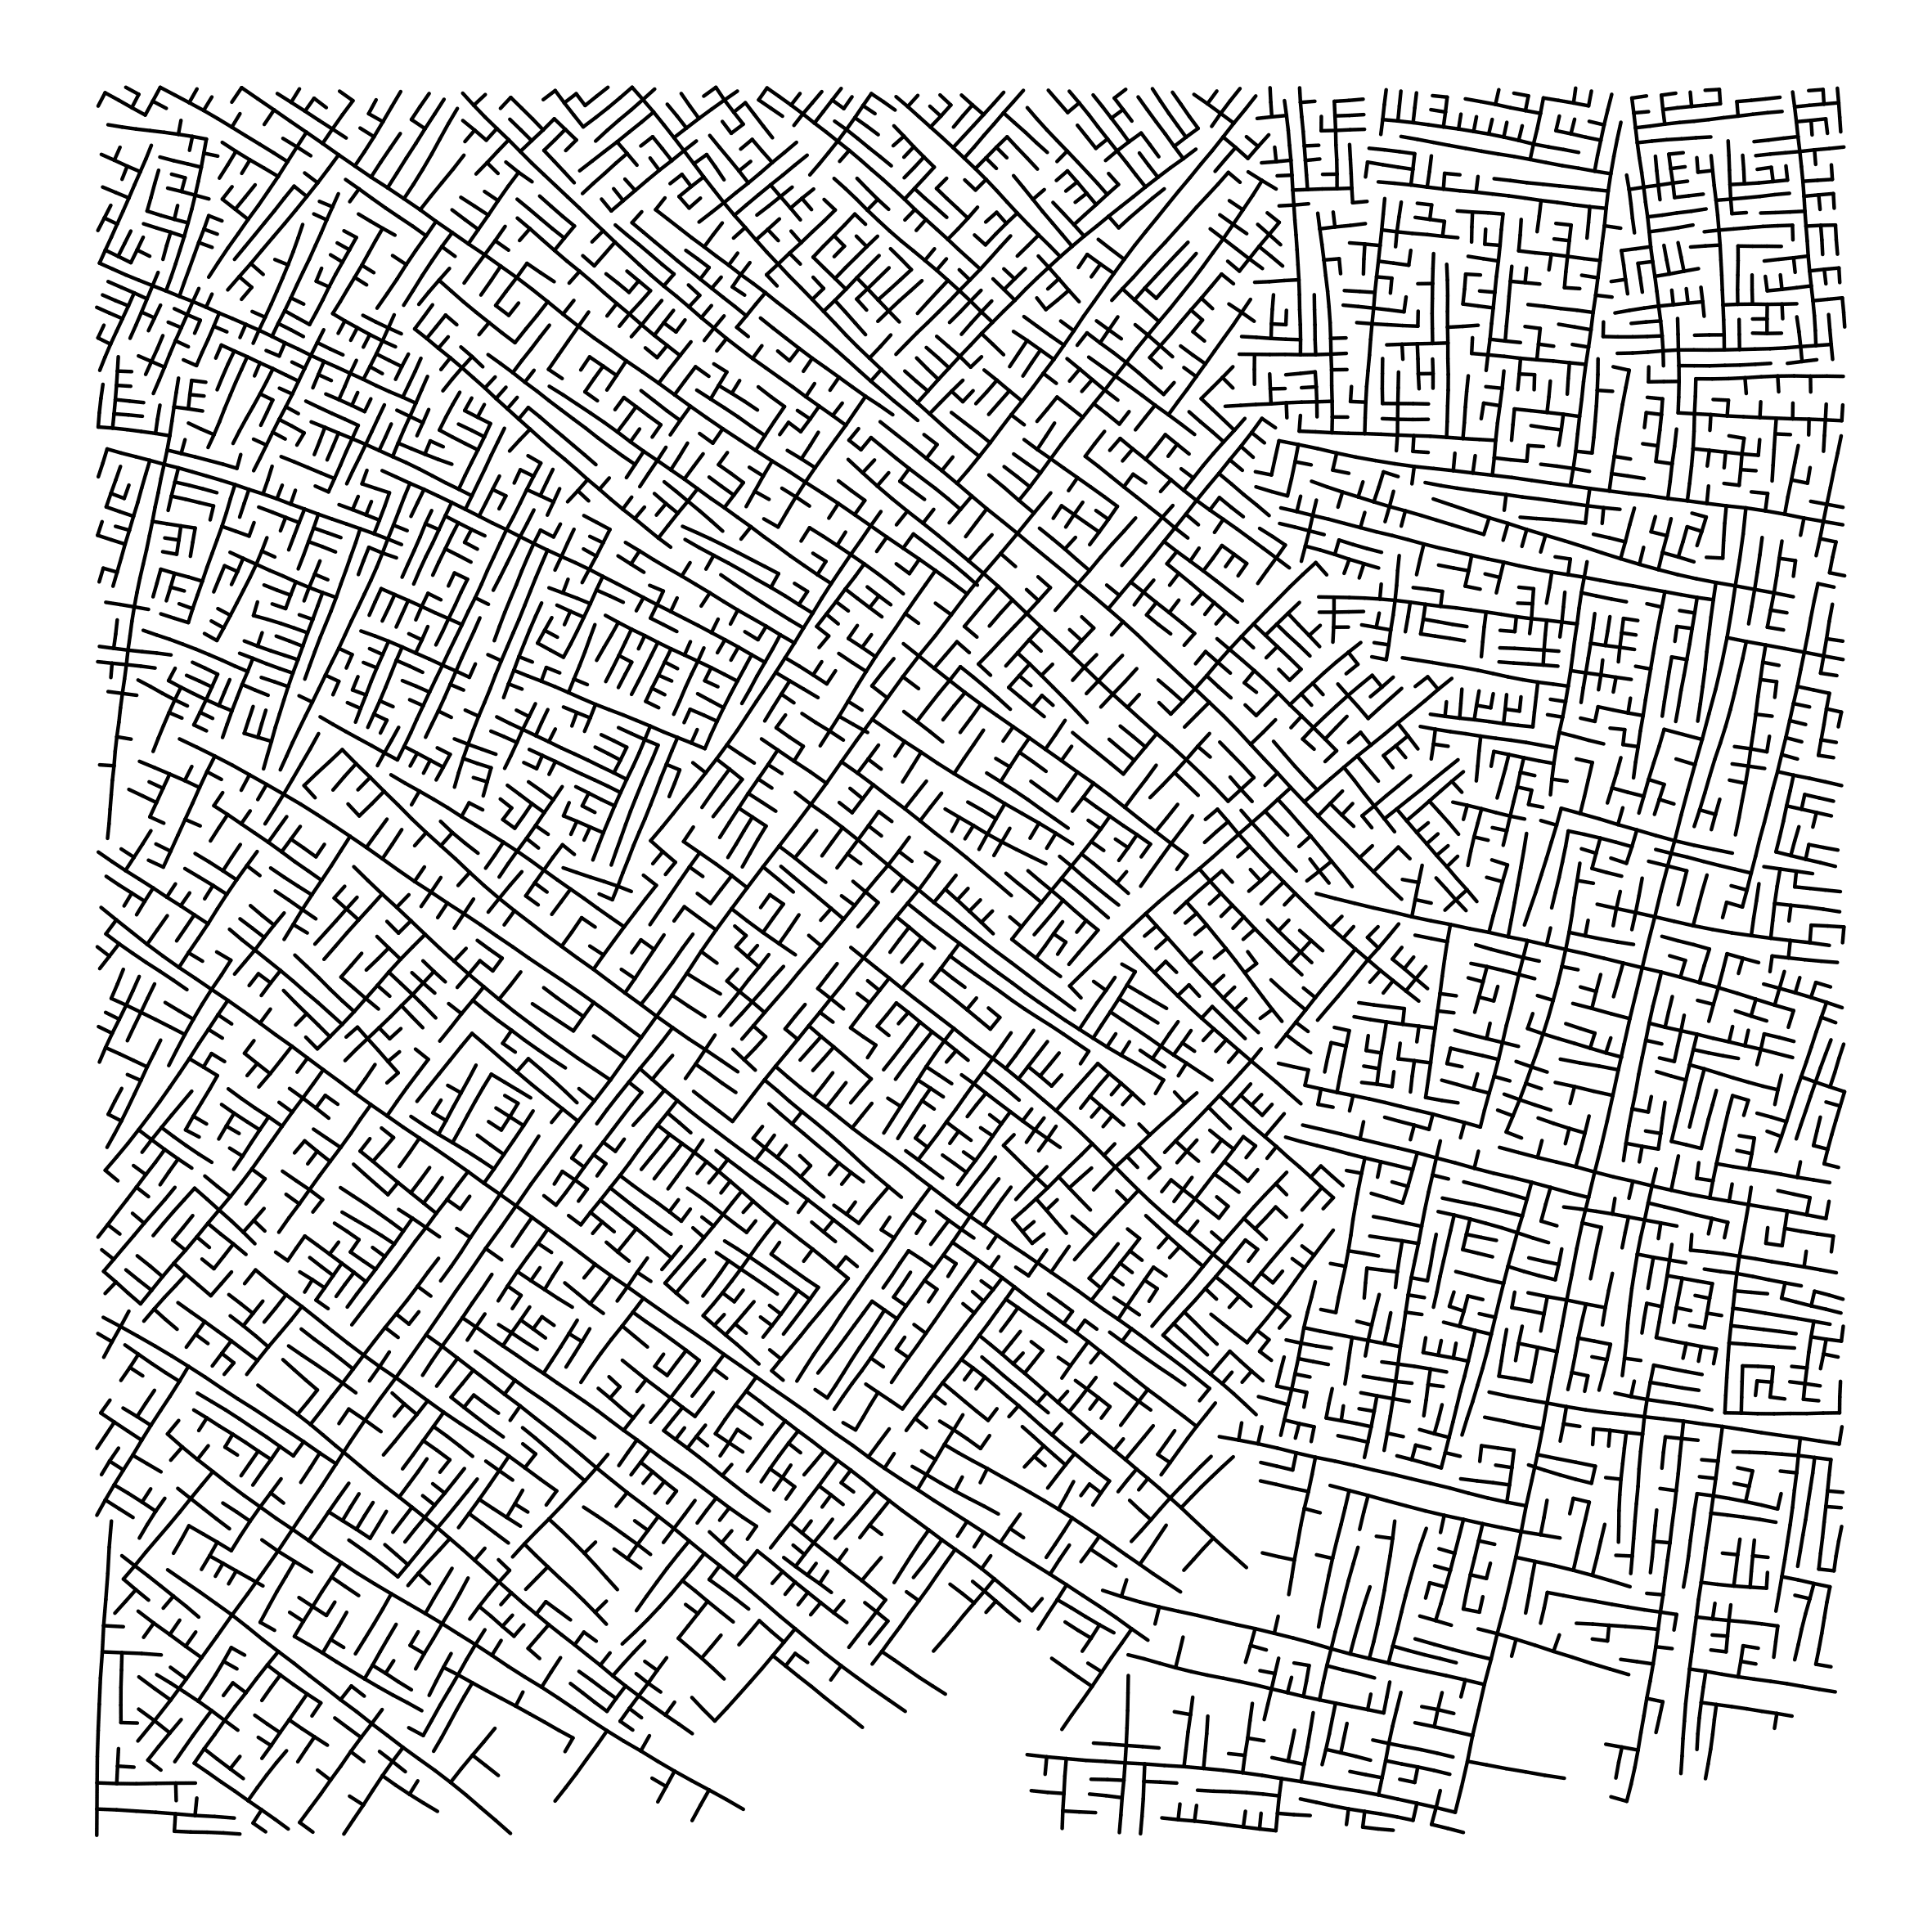
With League Spartan (#thisisparta) loaded as a beautiful custom font, this was the final cover background which I and my significant other liked most:

cover_wordcloud_20-League Spartan-4.png

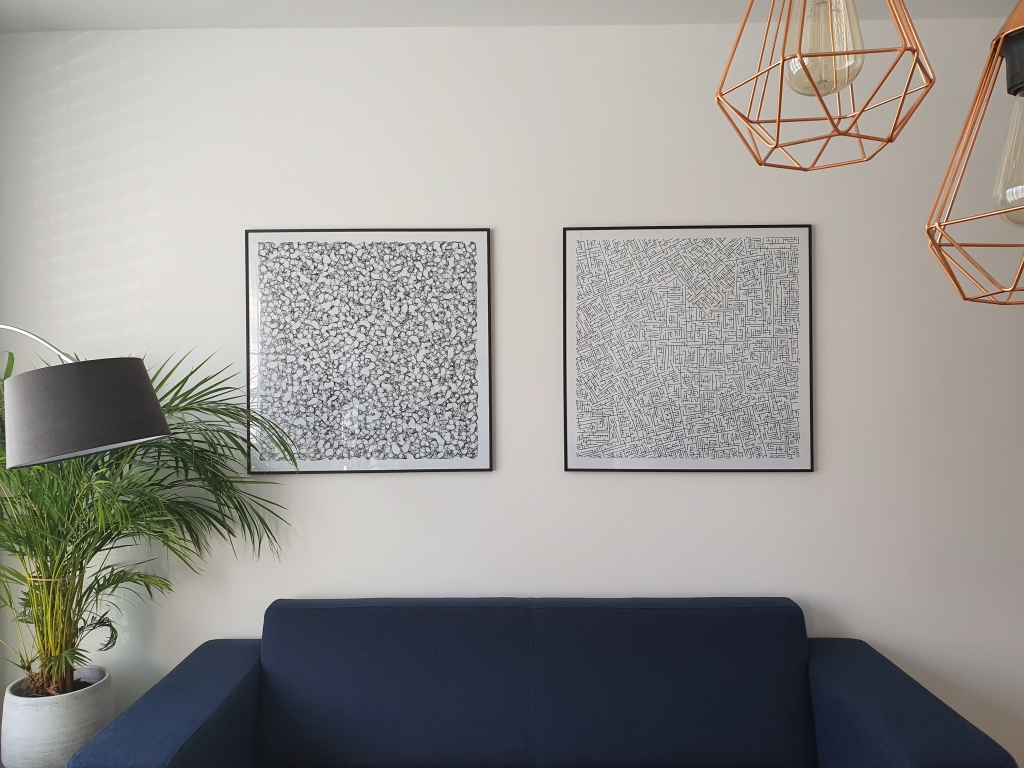
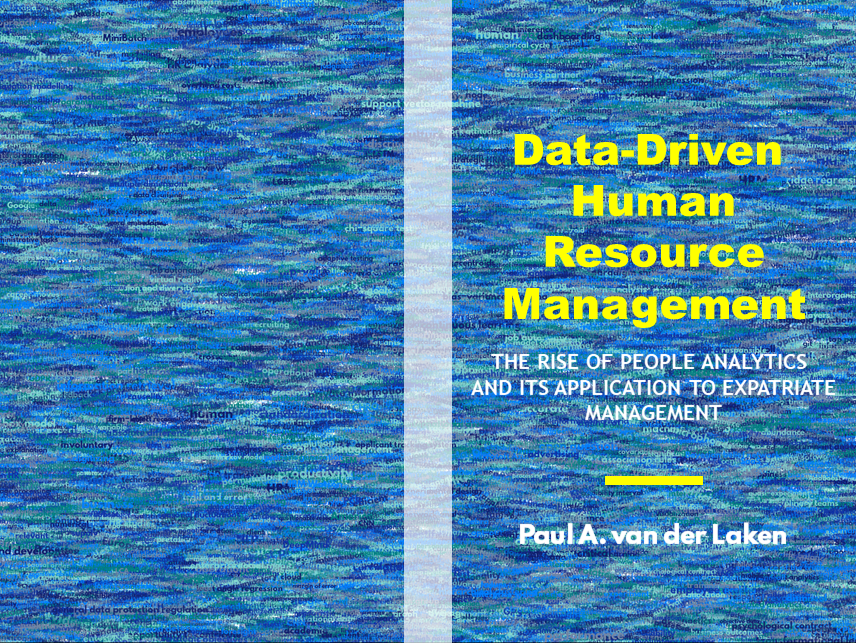
While I still need to decide on the final details regarding title placement and other details, I suspect that the final cover will look something like below — the white stripe in the middle depicting the book’s back.

coverpaul.png

Now, for the finale, I wanted to visualize the generation process via a GIF. Thomas Lin Pedersen developed this great gganimate package, which builds on the older animation package. The package greatly simplifies creating your own GIFs, as I already discussed in this earlier blog about animated GIFs in R. Anywhere, here is the generation process, where each frame includes the first frame ^ 3.2 words:

cover_wordcloud_20-League Spartan_4.gif

If you are interested in the process, or the R code I’ve written, feel free to reach out!

I’m sharing a digital version of the dissertation online sometime around the defense date: November 9th, 2018. If you’d like a copy, you can still leave your e-mailadress in the Google Form here and I’ll make sure you’ll receive your copy in time!