Wanting to broaden your scope and learn a new programming language? This great workshop was given at EARL 2018 by Mango Solutions and helps R programmers transition into Python building on their existing R knowledge. The workshop includes exercises that introduce you to the key concepts of Python and some of its most powerful packages for data science, including numpy, pandas, sklearn, and seaborn.
Have a look at the associated workshop guide that walk you through the assignments, or at the github repo with all materials in Jupyter notebooks.
Fortunately, so much of the conference is shared on Twitter and media outlets that I still felt included. Here are some things that I liked and learned from, despite the Austin-Tilburg distance.
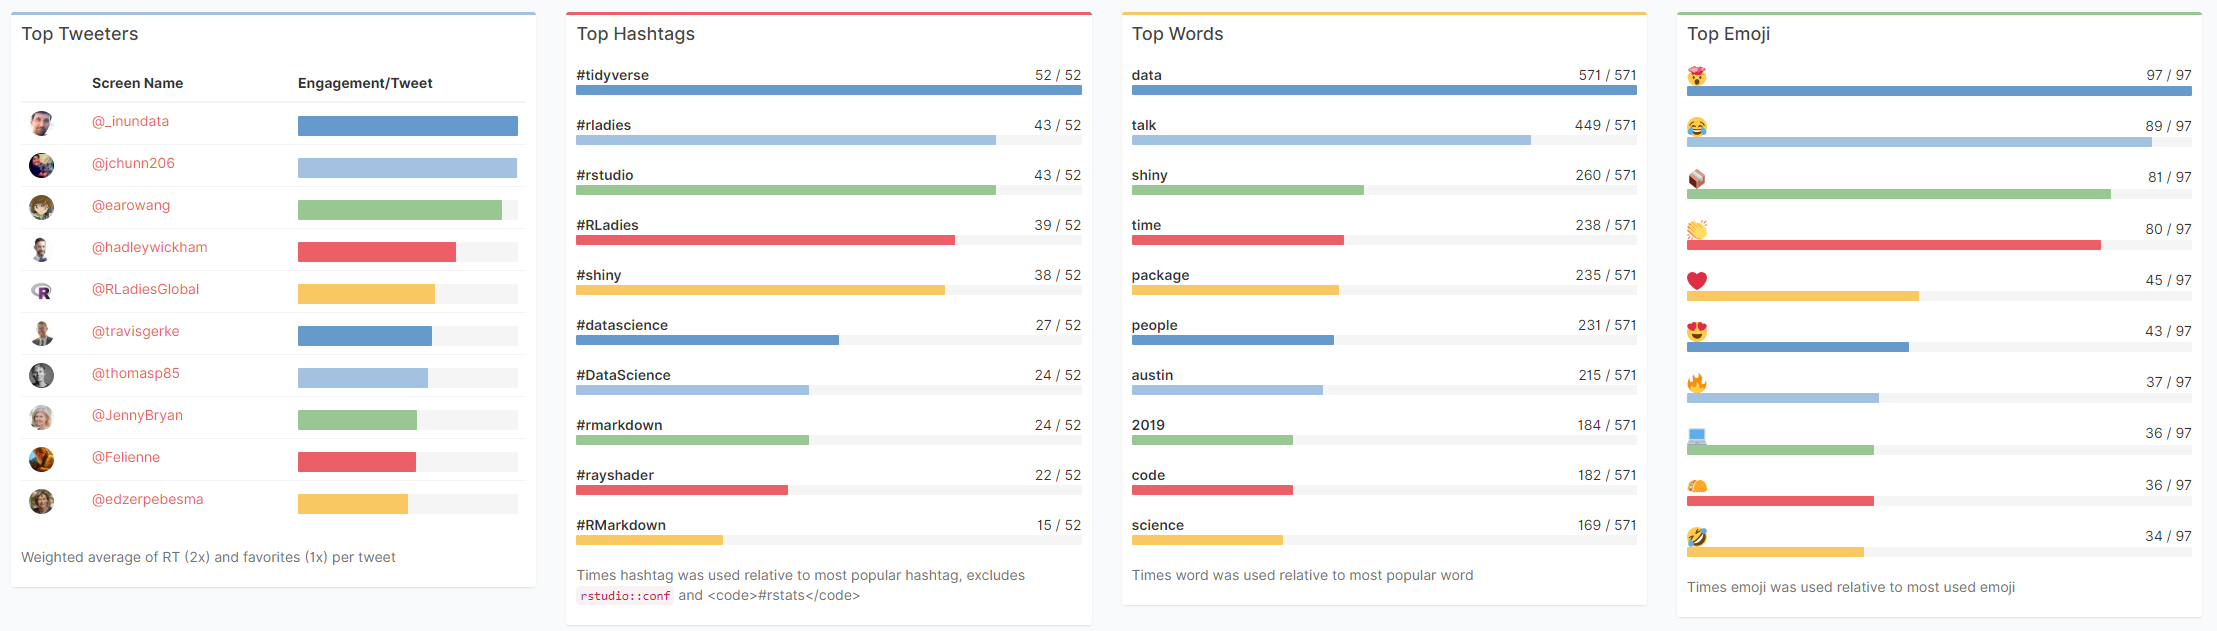
Garrick Aden-Buie made a fabulous Shiny app that allows you to review all #rstudioconf tweets during and since the conference. It even includes some random statistics about the tweets, and a page with all the shared media.
Data scientists can fail by: ❌not saying no enough ❌not providing anything more than a cursory analysis ❌assuming PM knows enough to ask question in the right way and not collaborating with them ❌caring more about using fancy method than solving business problems#rstudioconf
Did you know that RStudio also posts all the webinars they host? There really are some hidden pearls among them. For instance, this presentation by Nathan Stephens on rendering rmarkdown to powerpoint will save me tons of work, and those new to broom will also be astonished by this webinar by Alex Hayes.
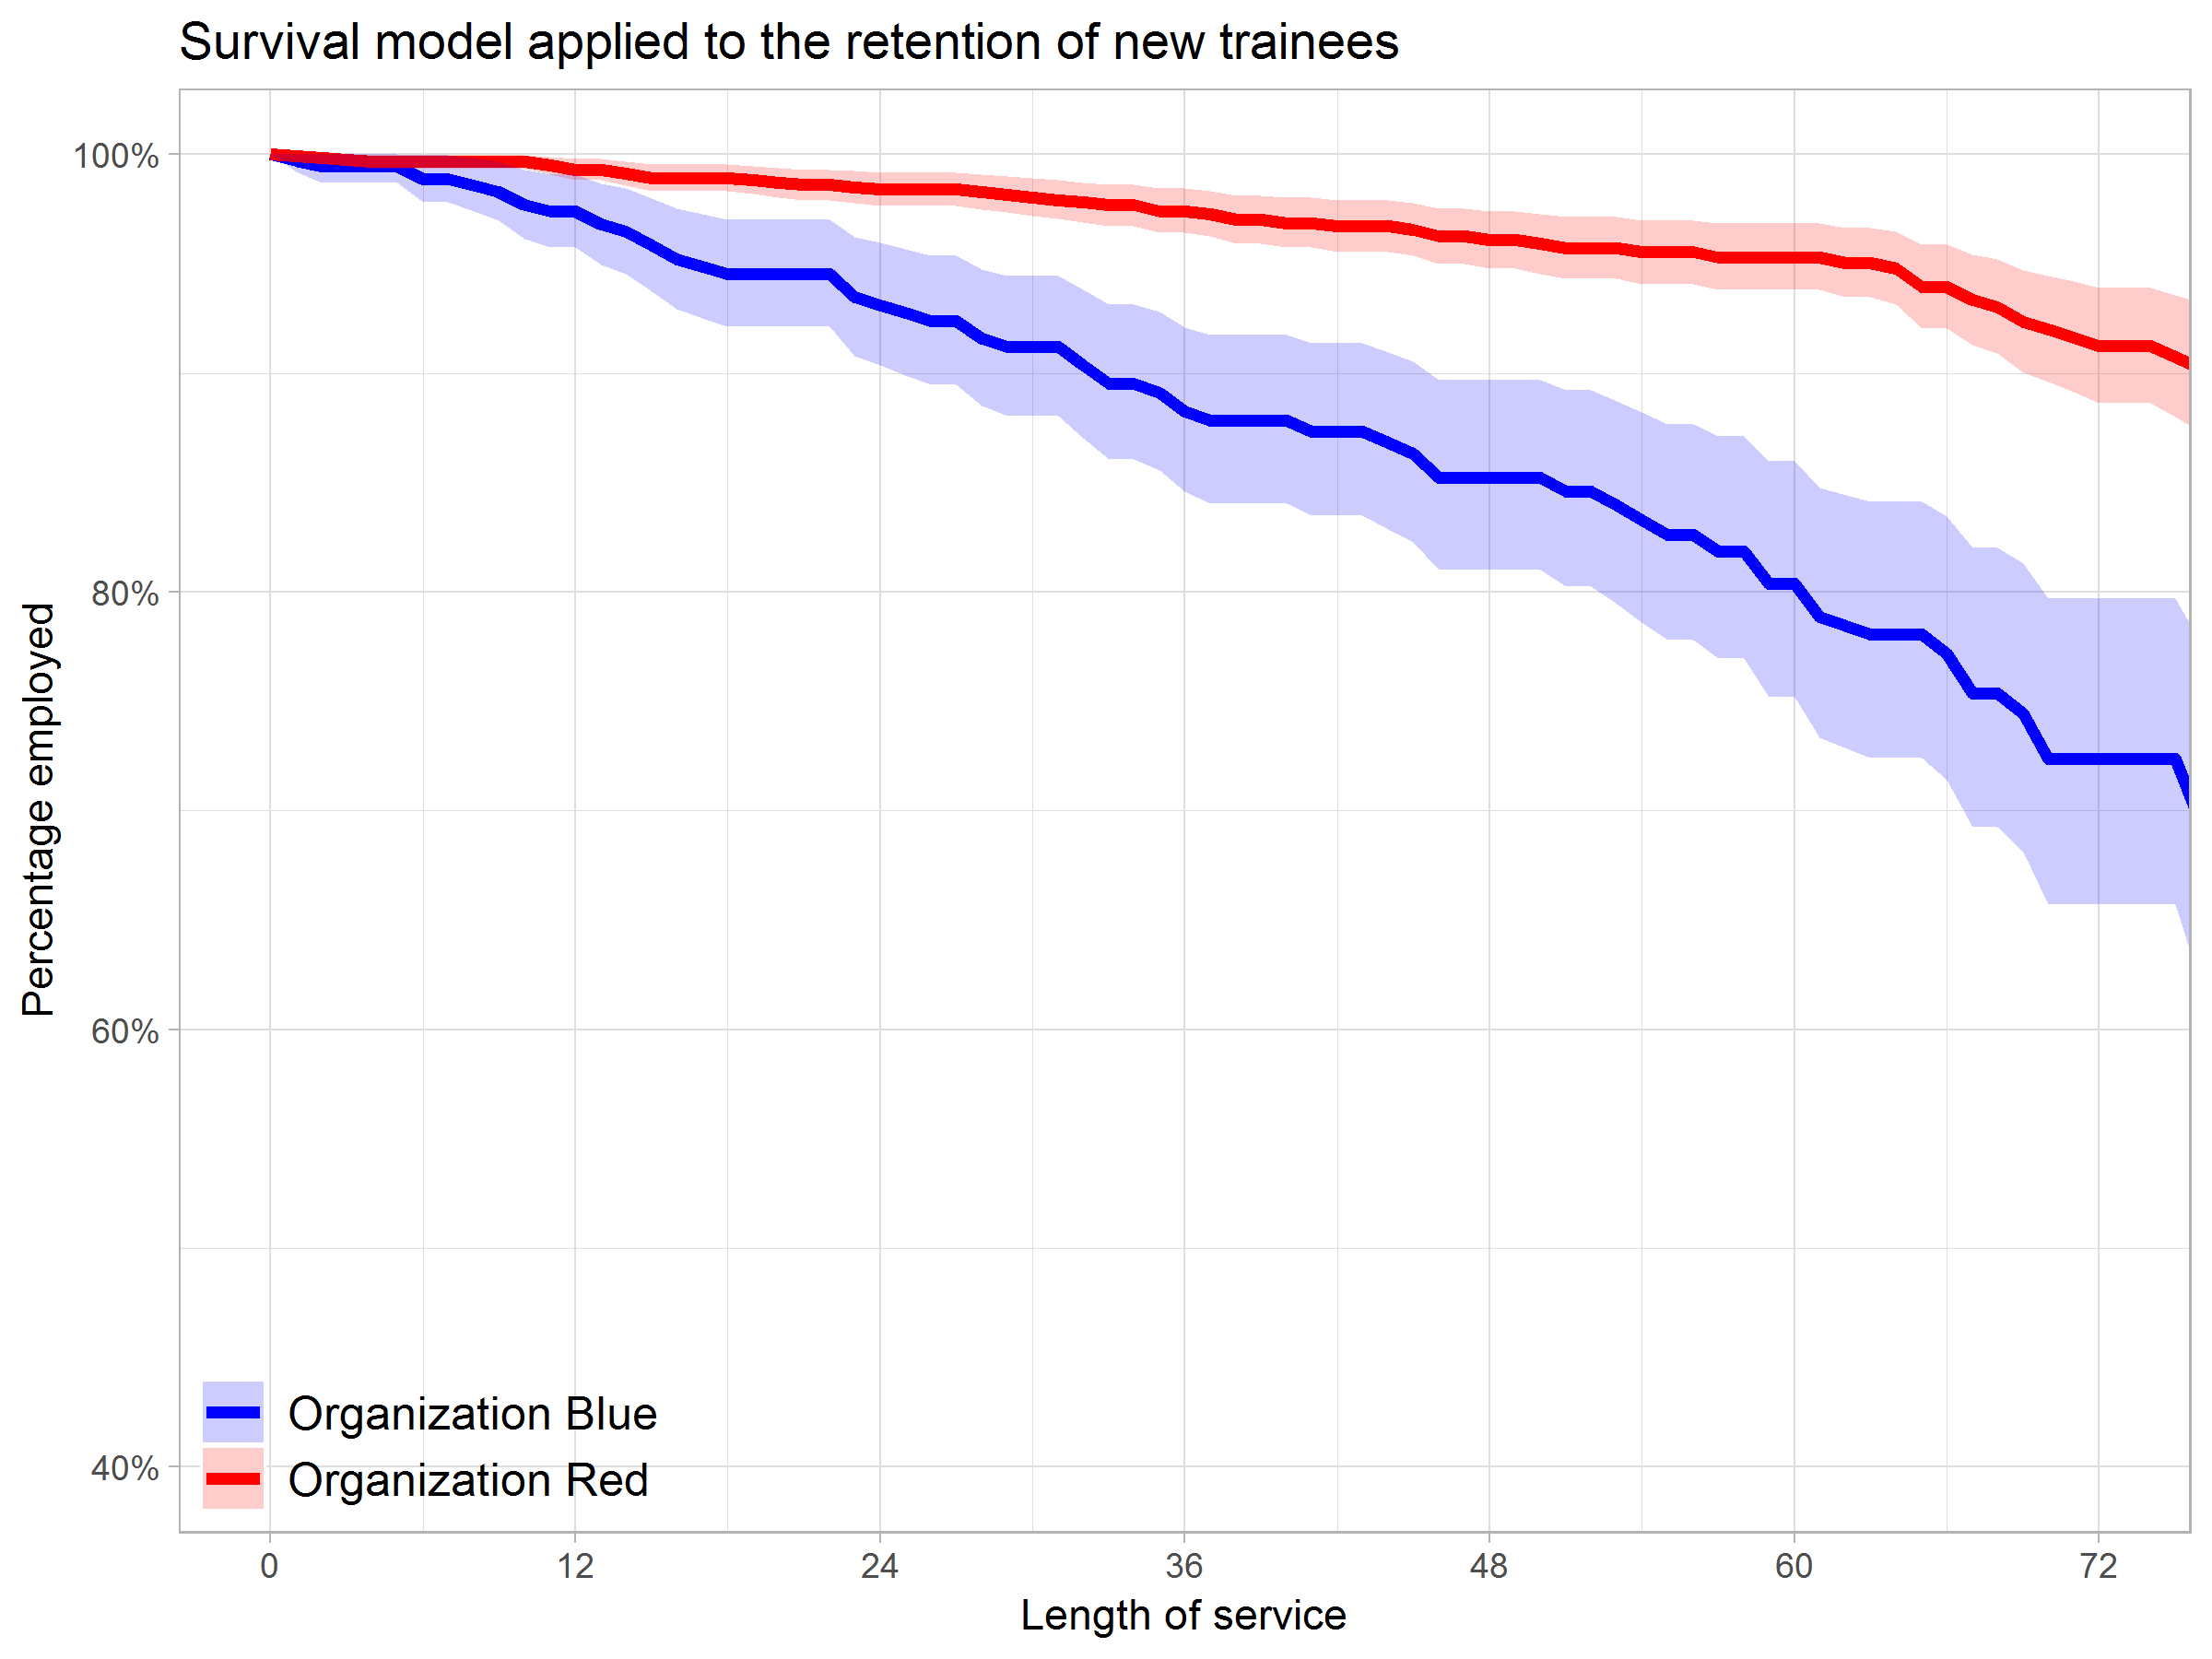
Past week, Analytics in HR published a guest blog about one of my People Analytics projects which you can read here. In the blog, I explain why and how I examined the turnover of management trainees in light of the international work assignments they go on.
For the analyses, I used a statistical model called a survival analysis – also referred to as event history analysis, reliability analysis, duration analysis, time-to-event analysis, or proporational hazard models. It estimates the likelihood of an event occuring at time t, potentially as a function of certain data.
The sec version of surival analysis is a relatively easy model, requiring very little data. You can come a long way if you only have the time of observation (in this case tenure), and whether or not an event (turnover in this case) occured. For my own project, I had two organizations, so I added a source column as well (see below).
PyData provides a forum for the international community of users and developers of data analysis tools to share ideas and learn from each other. The communities approach data science using many languages, including (but not limited to) Python, Julia, and R.
April 2018, a PyData conference was held in London, with three days of super interesting sessions and hackathons. While I couldn’t attend in person, I very much enjoy reviewing the sessions at home as all are shared open access on YouTube channel PyDataTV!
In the following section, I will outline some of my favorites as I progress through the channel:
Winning with simple, even linear, models:
One talk that really resonated with me is Vincent Warmerdam‘s talk on “Winning with Simple, even Linear, Models“. Working at GoDataDriven, a data science consultancy firm in the Netherlands, Vincent is quite familiar with deploying deep learning models, but is also midly annoyed by all the hype surrounding deep learning and neural networks. Particularly when less complex models perform equally well or only slightly less. One of his quote’s nicely sums it up:
“Tensorflow is a cool tool, but it’s even cooler when you don’t need it!”
— Vincent Warmerdam, PyData 2018
In only 40 minutes, Vincent goes to show the finesse of much simpler (linear) models in all different kinds of production settings. Among others, Vincent shows:
how to solve the XOR problem with linear models
how to win at timeseries with radial basis features
how to use weighted regression to deal with historical overfitting
how deep learning models introduce a new theme of horror in production
how to create streaming models using passive aggressive updating
how to build a real-time video game ranking system using mere histograms
how to create a well performing recommender with two SQL tables
how to rock at data science and machine learning using Python, R, and even Stan
The 2018 annual Society for Industrial and Organizational Psychology (SIOP) conference featured its first-ever machine learning competition. Teams competed for several months in predicting the enployee turnover (or churn) in a large US company. A more complete introduction as presented at the conference can be found here. All submissions had to be open source and the winning submissions have been posted in this GitHub repository. The winning teams consist of analysts working at WalMart, DDI, and HumRRO. They mostly built ensemble models, in Python and/or R, combining algorithms such as (light) gradient boosted trees, neural networks, and random forest analysis.
rstudio::conf is theyearly conference when it comes to R programming and RStudio. In 2017, nearly 500 people attended and, last week, 1100 people went to the 2018 edition. Regretfully, I was on holiday in Cardiff and missed out on meeting all my #rstats hero’s. Just browsing through the #rstudioconf Twitter-feed, I already learned so many new things that I decided to dedicate a page to it!
Fortunately, you can watch the live streams taped during the conference:
One of the workshops deserves an honorable mention. Jenny Bryan presented on What they forgot to teach you about R, providing some excellent advice on reproducible workflows. It elaborates on her earlier blog on project-oriented workflows, which you should read if you haven’t yet. Some best pRactices Jenny suggests:
Restart R often. This ensures your code is still working as intended. Use Shift-CMD-F10 to do so quickly in RStudio.
Use stable instead of absolute paths. This allows you to (1) better manage your imports/exports and folders, and (2) allows you to move/share your folders without the code breaking. For instance, here::here("data","raw-data.csv") loads the raw-data.csv-file from the data folder in your project directory. If you are not using the here package yet, you are honestly missing out! Alternatively you can use fs::path_home(). normalizePath() will make paths work on both windows and mac. You can usebasename instead of strsplit to get name of file from a path.
To upload an existing git directory to GitHub easily, you can usethis::use_github().
If you include the below YAML header in your .R file, you can easily generate .md files for you github repo.
#' ---
#' output: github_document
#' ---
Moreover, Jenny proposed these useful default settings for knitr:
Another of Jenny Bryan‘s talks was named Data Rectangling and although you might not get much out of her slides without her presenting them, you should definitely try the associated repurrrsivetutorial if you haven’t done so yet. It’s a poweR up for any useR!
I can’t remember who shared it, but a very cool trick is to name the viewing tab of any dataframe you pipe into View() using df %>% View("enter_view_tab_name").
These probably only present a minimal portion of the thousands of tips and tricks you could have learned by simply attending rstudio::conf. I will definitely try to attend next year’s edition. Nevertheless, I hope the above has been useful. If I missed out on any tips, presentations, tweets, or other materials, please reply below, tweet me or pop me a message!