Did you know that dragonflies are one of the most effective and accurate predators alive? And that while it has a brain consisting of very few neurons. Neuroscientist Greg Gage and his colleagues studied how a dragonfly locks onto its preys and captures it within milliseconds. Actually, a dragonfly seems to be little more than a small neural network hooked up to some wings, and optimized through millions of years of evolution.
I recently got pointed towards a 2017 paper on bioRxiv that blew my mind: three researchers at the Computational Neuroscience Laboratories at Kyoto, Japan, demonstrate how they trained a deep neural network to decode human functional magnetic resonance imaging (fMRI) patterns and then generate the stimulus images.
In simple words, the scholars used sophisticated machine learning to reconstruct the photo’s their research particpants saw based on their brain activity… INSANE! The below shows the analysis workflow, and an actual reconstructed image. More reconstructions follow further on.
Figure 1 | Deep image reconstruction. Overview of deep image reconstruction is shown. The pixels’ values of the input image are optimized so that the DNN features of the image are similar to those decoded from fMRI activity. A deep generator network (DGN) is optionally combined with the DNN to produce natural-looking images, in which optimization is performed at the input space of the DGN. [original]Three healthy young adults participated in two types of experiments: an image presentation experiment and an imagery experiment.
In the image presentation experiments, participants were presented with several natural images from the ImageNet database, with 40 images geometrical shapes, and with 10 images of black alphabetic characters. These visual stimuli were rear-projected onto a screen in an fMRI scanner bore. Data from each subject were collected over multiple scanning sessions spanning approximately 10 months. Images were flashed at 2 Hz for several seconds. In the imagery experiment, subjects were asked to visually imagine / remember one of 25 images of the presentation experiments. Subjects were
required to start imagining a target image after seeing some cue words.
In both experimental setups, fMRI data were collected using 3.0-Tesla Siemens MAGNETOM Verio scanner located at the Kokoro Research Center, Kyoto University.
The results, some of which I copied below, are plainly amazing.
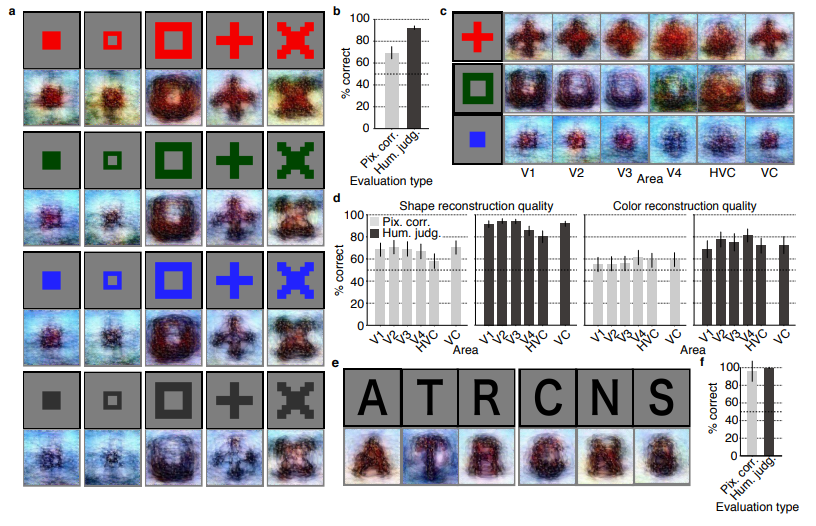
Figure 2 | Seen natural image reconstructions. Images with black and gray frames show presented and reconstructed images, respectively (reconstructed from VC activity). a) Reconstructions utilizing the DGN (using DNN1–8). Three reconstructed images correspond to reconstructions from three subjects. b) Reconstructions with and without the DGN (DNN1–8). The first, second, and third rows show presented images, reconstructions with and without the DGN, respectively. c) Reconstruction quality of seen natural images (error bars, 95% confidence interval (C.I.) across samples; three subjects pooled; chance level, 50%). d) Reconstructions using different combinations of DNN layers (without the DGN). e) Subjective assessment of reconstructions from different combinations of DNN layers (error bars, 95% C.I. across samples) [original]Figure 3 | Seen artificial shape reconstructions. Images with black and gray frames show presented and reconstructed images (DNN 1–8, without the DGN). a) Reconstructions for seen colored artificial shapes (VC activity). b, Reconstruction quality of colored artificial shapes. c) Reconstructions of colored artificial shapes obtained from multiple visual areas. d) Reconstruction quality of shape and colors for different visual areas. e) Reconstructions of alphabetical letters. f) Reconstruction quality for alphabetical letters. For b, d, f, error bars indicate 95% C.I. across samples (three subjects pooled; chance level, 50%) [original] Supplementary Figure 2 | Other examples of natural image reconstructions obtained with the DGN. Images with black and gray frames show presented and reconstructed images, respectively (reconstructed from VC activity using all DNN layers). Three reconstructed images correspond to reconstructions from three subjects. [original]Supplementary Figure 3 | Reconstructions through optimization processes. Reconstructed images obtained through the optimization processes are shown (reconstructed from VC activity of Subject 1 using all DNN layers and the DGN). Images with black and gray frames show presented and reconstructed images, respectively. [original]There were many more examples of reconstructed images, as well as much more detailed information regarding the machine learning approach and experimental setup, so I strongly advise you check out the orginal paper.
I can’t even imagine what such technology would imply for society… Proper minority report stuff here.
Here’s the abstract as an additional teaser:
Abstract
Machine learning-based analysis of human functional magnetic resonance imaging
(fMRI) patterns has enabled the visualization of perceptual content. However, it has been limited to the reconstruction with low-level image bases (Miyawaki et al., 2008; Wen et al., 2016) or to the matching to exemplars (Naselaris et al., 2009; Nishimoto et al., 2011). Recent work showed that visual cortical activity can be decoded (translated) into hierarchical features of a deep neural network (DNN) for the same input image, providing a way to make use of the information from hierarchical visual features (Horikawa & Kamitani, 2017). Here, we present a novel image reconstruction method, in which the pixel values of an image are optimized to make its DNN features similar to those decoded from human brain activity at multiple layers. We found that the generated images resembled the stimulus images (both natural images and artificial shapes) and the subjective visual content during imagery. While our model was solely trained with natural images, our method successfully generalized the reconstruction to artificial shapes, indicating that our model indeed ‘reconstructs’ or ‘generates’ images from brain activity, not simply matches to exemplars. A natural image prior introduced by another deep neural network effectively rendered semantically meaningful details to reconstructions by constraining reconstructed images to be similar to natural images. Furthermore, human judgment of reconstructions suggests the effectiveness of combining multiple DNN layers to enhance visual quality of generated images. The results suggest that hierarchical visual information in the brain can be effectively combined to reconstruct perceptual and subjective images.
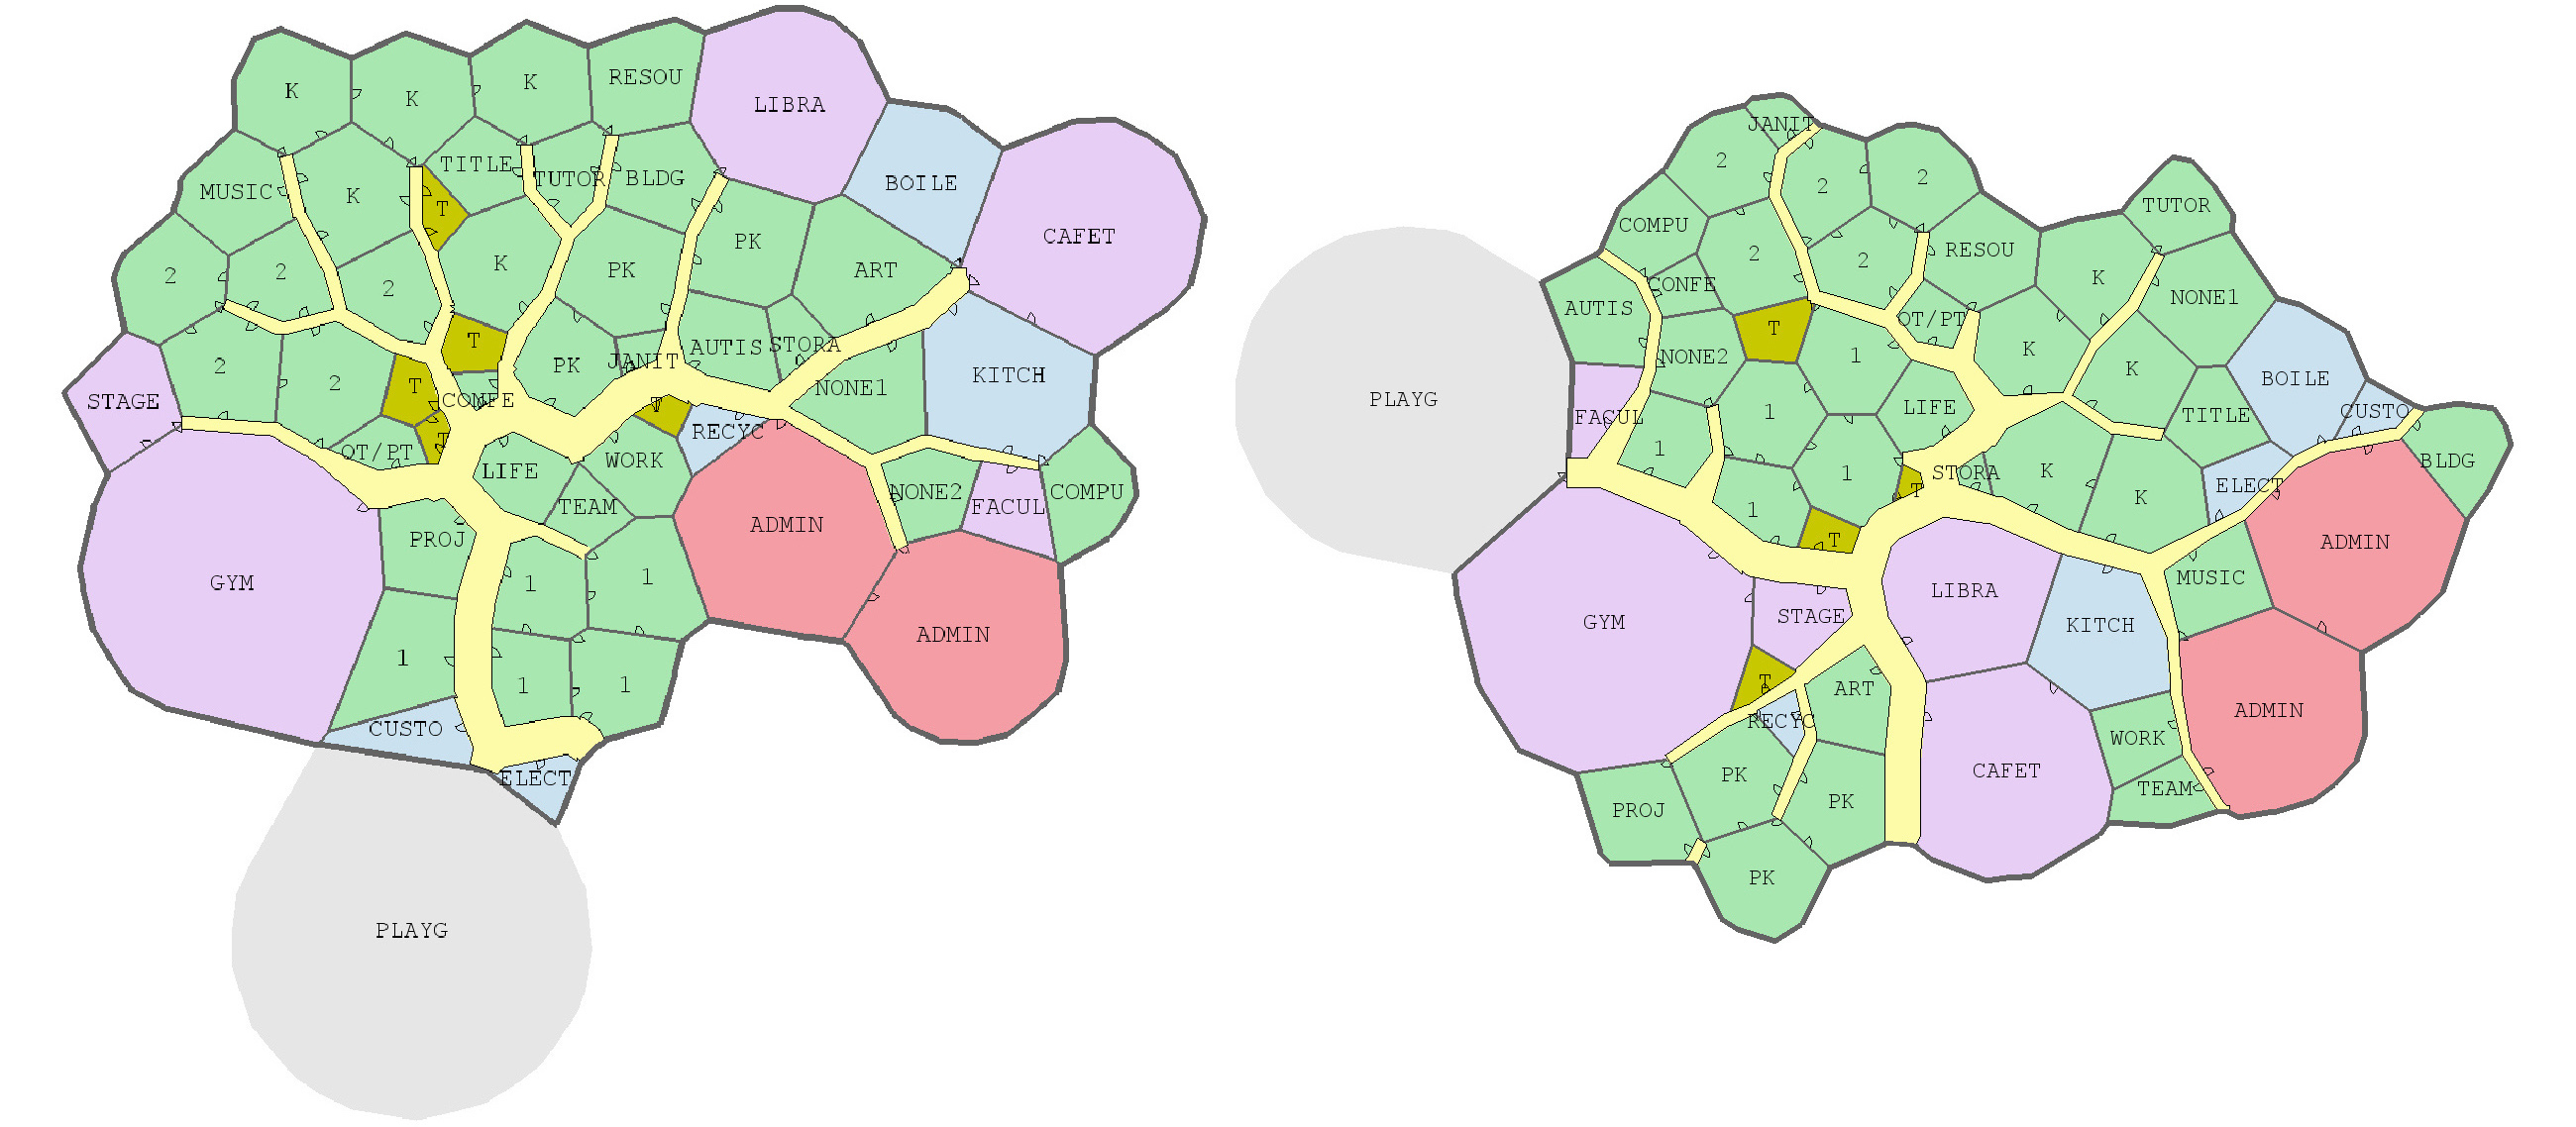
Joel Simon is the genius behind an experimental project exploring optimized school blueprints. Joel used graph-contraction and ant-colony pathing algorithms as growth processes, which could generate elementary school designs optimized for all kinds of characteristics: walking time, hallway usage, outdoor views, and escape routes just to name a few.
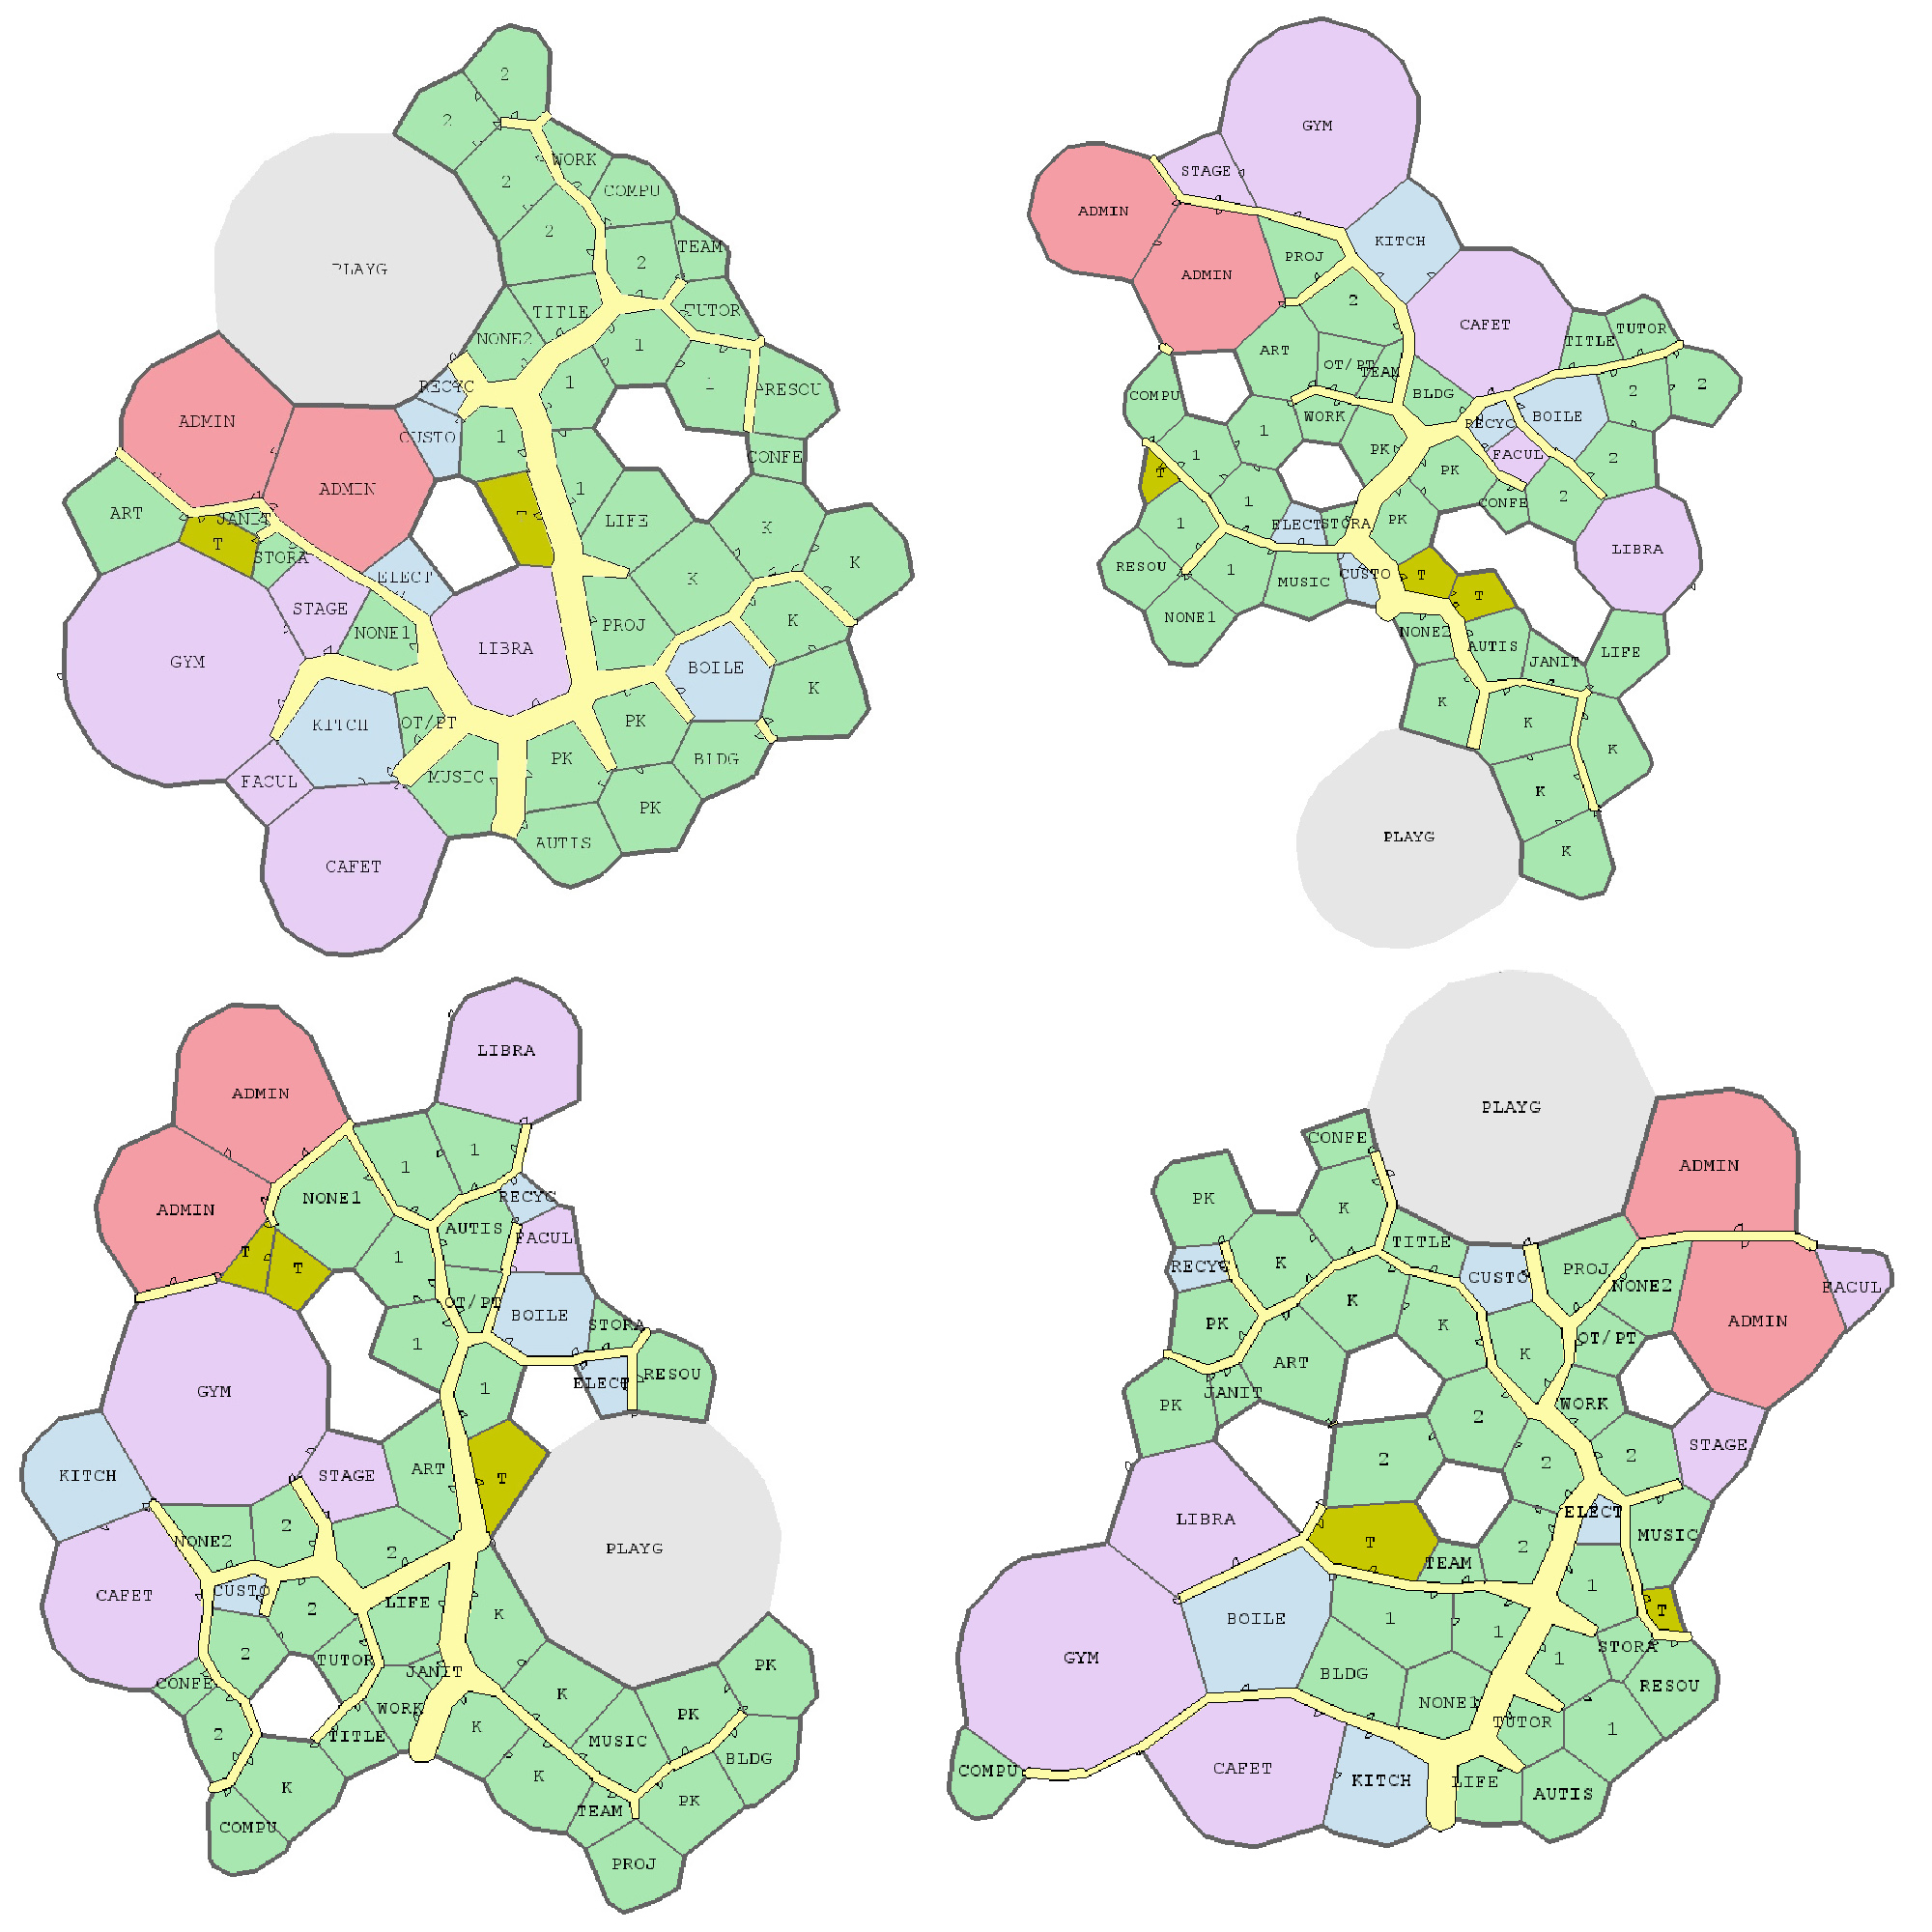
Two generated designs, minimizing the traffic flow (left) as well as escape routes (right) [original]Other designs tried to maximize the number of windows, resulting in seemingly random open courtyards [original]
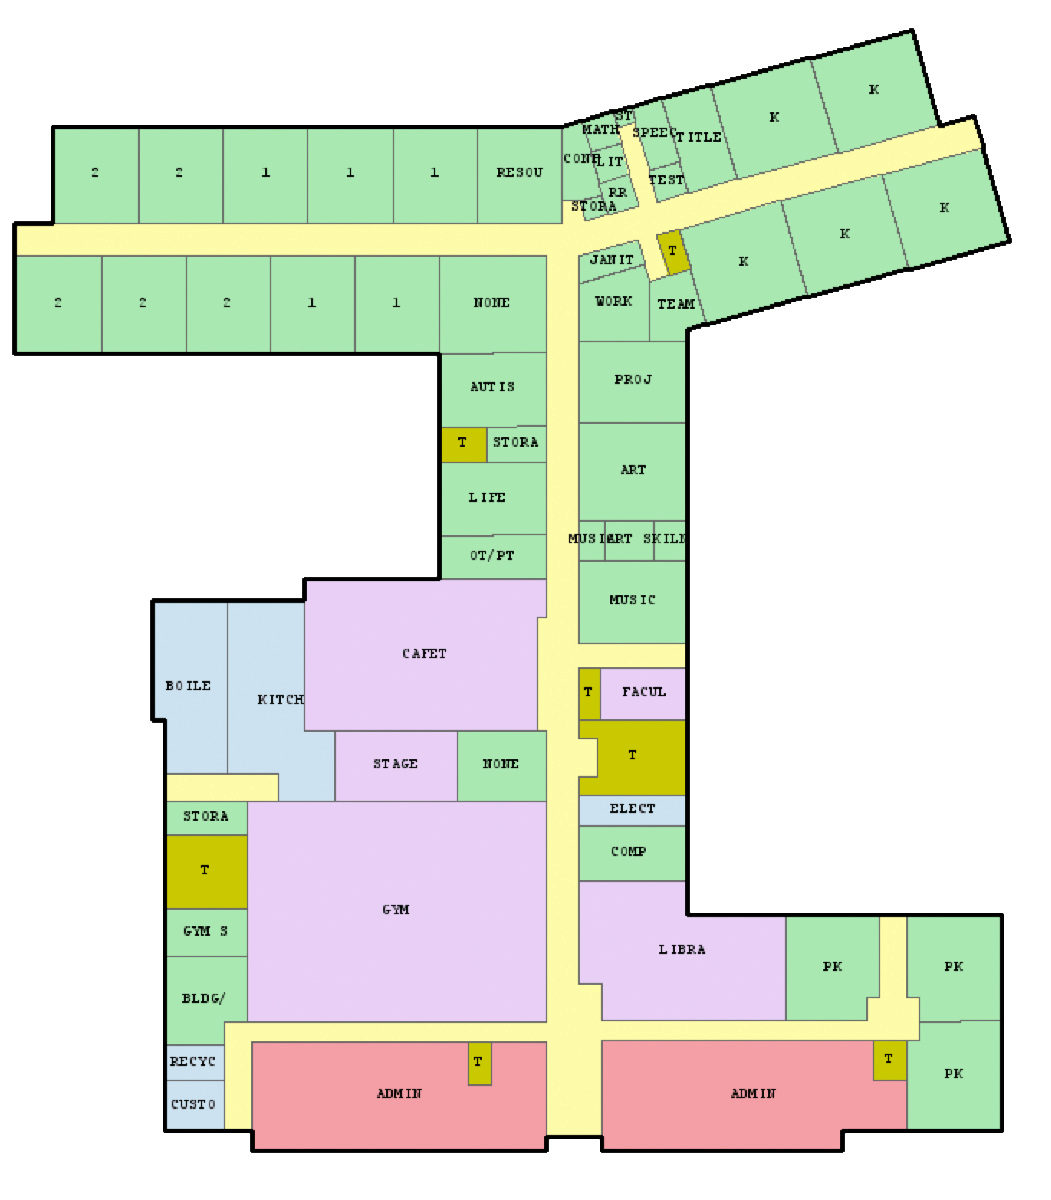
The original floor plan [original]Definitely check out the original write-up if you are interested in the details behind the generation process! Or have a look at some of Joel’s other projects.
I stumbled across this open access book by Rob Hyndman, the god of time series, and George Athanasopoulos, a colleague statistician / econometrician at Monash University in Melbourne Australia.
Hyndman and Athanasopoulos provide a comprehensive introduction to forecasting methods, accessible and relevant among others for business professionals without any formal training in the area. All R examples in the book assume work build on the fpp2 R package. fpp2 includes all datasets referred to in the book and depends on other R packages including forecast and ggplot2.
Some examples of the analyses you can expect to recreate, ignore the agricultural topic for now ; )
One of the example analysis you will recreate by following the book (Figure 3.3)You will be forecasting price data using different analyses and adjustments (Figure 3.4)
I highly recommend this book to any professionals or students looking to learn more about forecasting and time series modelling. There is also a DataCamp course based on this book. If you got value out of this free book, be sure to buy a hardcopy as well.
PyData provides a forum for the international community of users and developers of data analysis tools to share ideas and learn from each other. The communities approach data science using many languages, including (but not limited to) Python, Julia, and R.
April 2018, a PyData conference was held in London, with three days of super interesting sessions and hackathons. While I couldn’t attend in person, I very much enjoy reviewing the sessions at home as all are shared open access on YouTube channel PyDataTV!
In the following section, I will outline some of my favorites as I progress through the channel:
Winning with simple, even linear, models:
One talk that really resonated with me is Vincent Warmerdam‘s talk on “Winning with Simple, even Linear, Models“. Working at GoDataDriven, a data science consultancy firm in the Netherlands, Vincent is quite familiar with deploying deep learning models, but is also midly annoyed by all the hype surrounding deep learning and neural networks. Particularly when less complex models perform equally well or only slightly less. One of his quote’s nicely sums it up:
“Tensorflow is a cool tool, but it’s even cooler when you don’t need it!”
— Vincent Warmerdam, PyData 2018
In only 40 minutes, Vincent goes to show the finesse of much simpler (linear) models in all different kinds of production settings. Among others, Vincent shows:
how to solve the XOR problem with linear models
how to win at timeseries with radial basis features
how to use weighted regression to deal with historical overfitting
how deep learning models introduce a new theme of horror in production
how to create streaming models using passive aggressive updating
how to build a real-time video game ranking system using mere histograms
how to create a well performing recommender with two SQL tables
how to rock at data science and machine learning using Python, R, and even Stan
Zack Nado wrote the best machine learning application I’ve seen so far: a neural network architecture that generates new Pusheen pictures.
This is an orginal Pusheen picture.
In his blog, Zack describes his generative adversarial network (GAN) , a special type of machine learning architecture where two neural networks try to fool each other. Zack first gave the discriminator network some real Pusheen images, so it gets an idea of what Pusheen looks like. Next, the generator network gets a bunch of random numbers so it can generate completely new (fake) images. These generated images are then fed back into the discriminator, so it knows what generated images look like. Zack repeated this process several hundred thousand times, so he obtained a generator network that’s great at making new Pusheen images which the discriminator (nearly) can’t dinstinguish from the original, real ones. Below is the learning process of the generator network visualized:
Samples output by the generator network. It learns distinctive features of “real” Pusheen (e.g., tail, eyes, ears) over time [original]
In the end, the generated images are very much like the real Pusheen. Zack added an interactive module (using Tensorflow.js) to the blog so you can generate some Pusheens yourself. (it didn’t work for me though…) On a final note, Zack wrote the orginal blog both in plain English, for non-experts, and in jargon, for the more experienced data scientists. I highly recommend you read either one of those versions!
Some of the Pusheen’s generated by Zack’s GAN [original]