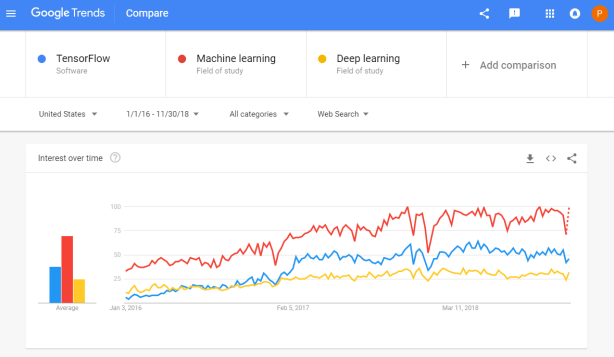
Tensorflow is a open-source machine learning (ML) framework. It’s primarily used to build neural networks, and thus very often used to conduct so-called deep learning through multi-layered neural nets.
Although there are other ML frameworks — such as Caffe or Torch — Tensorflow is particularly famous because it was developed by researchers of Google’s Brain Lab. There are widespread debates on which framework is best, nonetheless, Tensorflow does a pretty good job on marketing itself.
Google search engine searches on Tensorflow in comparison to searches on Machine learing and Deep learning
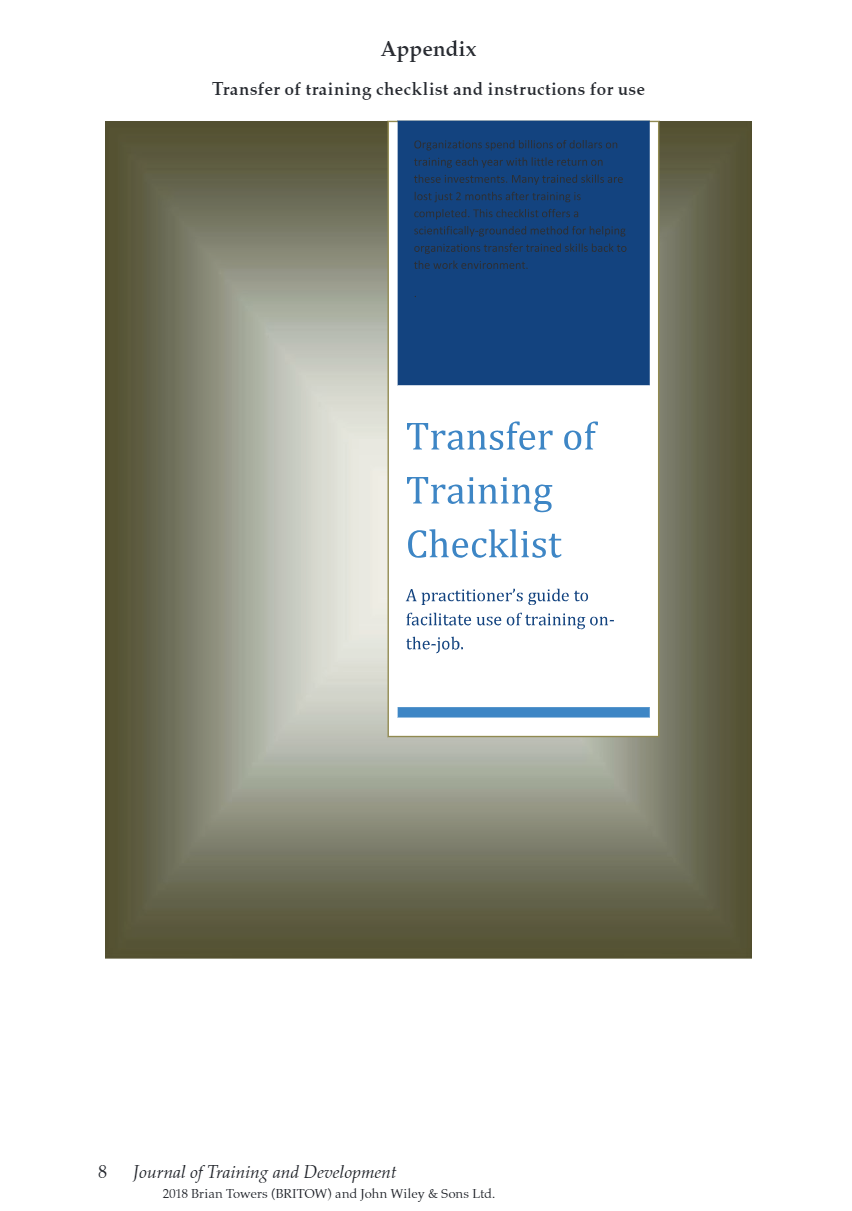
Ashley Hughes, Stephanie Zajac, Jacqueline Spencer, and Eduardo Salas wrote a recent research note for the International Journal of Training and Development. The research note is build around an evidence-based checklist of actionable insights for practitioners that will help to enhance the effectiveness of training interventions. These actionable insights would help to prevent ‘transfer problem’, meaning that trained skills are not being used on the job.
Screenshot of the first page of the published research note, containing the abstract
Screenshot of the appendix of the research note containing the checklist for practitioners.
For the full details and scientific evidence behind each suggested action, I suggest you access the research note. Nevertheless, here’s my summary of their main advice on improving training transfer before, during, and after training implementation:
Before training
Conduct a training needs analysis to align the training’s content and participants with the organizational objectives
Involved stakeholders should be aware of training, understand its importance, and — obviously — be prepared for the training program. The scholars provide seven specific actions here, including the setting of personal training goals, and aligning resources and rewards with the training.
Training attendance should be framed as an opportunity, and the training’s anticipated benefits could be emphasized (e.g. improvement of work processes or on-the-job performance).
A climate which encourages learning should be created, with dedicated time (and opportunities) for post‐training learning and a sense of accountability for using trained knowledge, skills, and abilities.
During training
Piloting the training with a single department or subset of trainees is highly encouraged. This is one way that greatly helps to assess whether the training design is appropriate in terms of content and delivery.
Error‐encouragement framing can influence a trainee’s learning orientation and thus errors made during training should be framed as growth opportunities.
After training
Use of the trained skills should be supported and planned. For instance, participants could be given a small workload reduction to provide opportunities to apply the learned knowledge and skills once they return to their position.
Management and training participants should be held accountable for their use of skills on the job.
Think about using just‐in‐time or refresher training and coaching, if needed.
Assess training effectiveness criteria including training transfer using metrics and analytics. Specifically, the scholars propose that the criteria measured in the training evaluation should correspond to the training needs identified through the training needs analysis that was conducted before the training.
Training evaluation criteria should consider the scope and timeframe of the training. Take into account that distal outcomes such as ROI may take longer to realize.
I recently came across this lovely article where Ali Spittel provides 7 tips for writing cleaner JavaScript code. Enthusiastic about her guidelines, I wanted to translate them to the R programming environment. However, since R is not an object-oriented programming language, not all tips were equally relevant in my opinion. Here’s what really stood out for me.
Suppose we want to create our own custom function to derive the average value of a vector v (please note that there is a base::mean function to do this much more efficiently). We could use the R code below to compute that the average of vector 1 through 10 is 5.5.
avg <- function(v){
    s = 0
    for(i in seq_along(v)) {
        s = s + v[i]
    }
    return(s / length(v))
}

avg(1:10) # 5.5
However, Ali rightfully argues that this code can be improved by making the variable and function names much more explicit. For instance, the refigured code below makes much more sense on a first look, while doing exactly the same.
averageVector <- function(vector){
    sum = 0
    for(i in seq_along(vector)){
        sum = sum + vector[i]
    }
    return(sum / length(vector))
}

averageVector(1:10) #5.5
Of course, you don’t want to make variable and function names unnecessary long (e.g., average would have been a great alternative function name, whereas computeAverageOfThisVector is probably too long). I like Ali’s principle:
Don’t minify your own code; use full variable names that the next developer can understand.
2. Write short functions that only do one thing
Ali argues “Functions are more understandable, readable, and maintainable if they do one thing only. If we have a bug when we write short functions, it is usually easier to find the source of that bug. Also, our code will be more reusable.” It thus helps to break up your code into custom functions that all do one thing and do that thing good!
For instance, our earlier function averageVector actually did two things. It first summated the vector, and then took the average. We can split this into two seperate functions in order to standardize our operations.
sumVector <- function(vector){
    sum = 0
    for(i in seq_along(vector)){
        sum = sum + vector[i]
    }
    return(sum)
}

averageVector <- function(vector){
    sum = sumVector(vector)
    average = sum / length(vector)
    return(average)
}

sumVector(1:10) # 55
averageVector(1:10) # 5.5
If you are writing a function that could be named with an “and” in it — it really should be two functions.
3. Documentation
Personally, I am terrible in commenting and documenting my work. I am always too much in a hurry, I tell myself. However, no more excuses! Anybody should make sure to write good documentation for their code so that future developers, including future you, understand what your code is doing and why!
Ali uses the following great example, of a piece of code with magic numbers in it.
Now, you might immediately recognize the number Pi in this return statement, but others may not. And maybe you will need the value Pi somewhere else in your script as well, but you accidentally use three decimals the next time. Best to standardize and comment!
PI <- 3.14 # PI rounded to two decimal places

areaOfCircle <- function(radius) {
  # Implements the mathematical equation for the area of a circle:
  # Pi times the radius of the circle squared.
  return(PI * radius ** 2)
}
The above is much clearer. And by making PI a variable, you make sure that you use the same value in other places in your script! Unfortunately, R doesn’t handle constants (unchangeable variables), but I try to denote my constants by using ALL CAPITAL variable names such as PI, MAX_GROUP_SIZE, or COLOR_EXPERIMENTAL_GROUP.
Do note that R has a built in variable pi for purposes such as the above.
I love Ali’s general rule that:
Your comments should describe the “why” of your code.
However, more elaborate R programming commenting guidelines are given in the Google R coding guide, stating that:
Functions should contain a comments section immediately below the function definition line. These comments should consist of a one-sentence description of the function; a list of the function’s arguments, denoted by Args:, with a description of each (including the data type); and a description of the return value, denoted by Returns:. The comments should be descriptive enough that a caller can use the function without reading any of the function’s code.
Either way, prevent that your comments only denote “what” your code does:
# EXAMPLE OF BAD COMMENTING ####

PI <- 3.14 # PI

areaOfCircle <- function(radius) {
    # custom function for area of circle
    return(PI * radius ** 2) # radius squared times PI
}
5. Be Consistent
I do not have as strong a sentiment about consistency as Ali does in her article, but I do agree that it’s nice if code is at least somewhat in line with the common style guides. For R, I like to refer to my R resources list which includes several common style guides, such as Google’s or Hadley Wickham’s Advanced R style guide.
Past week, I started this great C++ tutorial: learncpp.com. It has been an amazing learning experience so far, mostly because the tutorial is very hands on, allowing you to immediately self-program all of the code examples.
Several hours in now, section 1.10b explains how to design of your own, first programs. The advice in this seciton seemd pretty universal, thus valuable regardless of the programming language you normally work in. At least, I found it to resonates with my personal experiences so I highly recommend that you take 10 minutes to read it yourself: www.learncpp.com/cpp-tutorial/1-10b-how-to-design-your-first-programs. For those who dislike detailed insights, here are the main pointers:
A little up-front planning saves time and frustration in the long run. Generally speaking, work through these eight steps when starting a new program or project:
Define the problem
Collect the program’s basic requirements (e.g., functionality, constraints)
Define your tools, targets, and backup plan
Break hard problems down into easy problems
Figure out (and list) the sequence of events
Figure out the data inputs and outputs for each task
Write the task details
Connect the data inputs and outputs
Some general words of advice when writing programs:
Keep your programs simple to start. Often new programmers have a grand vision for all the things they want their program to do. “I want to write a role-playing game with graphics and sound and random monsters and dungeons, with a town you can visit to sell the items that you find in the dungeon” If you try to write something too complex to start, you will become overwhelmed and discouraged at your lack of progress. Instead, make your first goal as simple as possible, something that is definitely within your reach. For example, “I want to be able to display a 2d field on the screen”.
Add features over time. Once you have your simple program working and working well, then you can add features to it. For example, once you can display your 2d field, add a character who can walk around. Once you can walk around, add walls that can impede your progress. Once you have walls, build a simple town out of them. Once you have a town, add merchants. By adding each feature incrementally your program will get progressively more complex without overwhelming you in the process.
Focus on one area at a time. Don’t try to code everything at once, and don’t divide your attention across multiple tasks. Focus on one task at a time, and see it through to completion as much as is possible. It is much better to have one fully working task and five that haven’t been started yet than six partially-working tasks. If you split your attention, you are more likely to make mistakes and forget important details.
Test each piece of code as you go. New programmers will often write the entire program in one pass. Then when they compile it for the first time, the compiler reports hundreds of errors. This can not only be intimidating, if your code doesn’t work, it may be hard to figure out why. Instead, write a piece of code, and then compile and test it immediately. If it doesn’t work, you’ll know exactly where the problem is, and it will be easy to fix. Once you are sure that the code works, move to the next piece and repeat. It may take longer to finish writing your code, but when you are done the whole thing should work, and you won’t have to spend twice as long trying to figure out why it doesn’t.
This pearl had been resting in my inbox for quite a while before I was able to add it to my R resources list. Citing its GitHub page, ggstatsplot is an extension of ggplot2 package for creating graphics with details from statistical tests included in the plots themselves and targeted primarily at behavioral sciences community to provide a one-line code to produce information-rich plots. The package is currently maintained and still under development by Indrajeet Patil. Nevertheless, its functionality is already quite impressive. You can download the latest stable version via:
utils::install.packages(pkgs="ggstatsplot")
Or download the development version via:
devtools::install_github(
repo="IndrajeetPatil/ggstatsplot", # package path on GitHubdependencies=TRUE, # installs packages which ggstatsplot depends onupgrade_dependencies=TRUE# updates any out of date dependencies
)
The package currently supports many different statistical plots, including:
This function creates either a violin plot, a box plot, or a mix of two for between-group or between-condition comparisons and additional detailed results from statistical tests can be added in the subtitle. The simplest function call looks like the below, but much more complex information can be added and specified.
set.seed(123) # to get reproducible results
# the functions work approximately the same as ggplot2
ggstatsplot::ggbetweenstats(
data=datasets::iris,
x=Species,
y=Sepal.Length,
messages=FALSE
) +
# and can be adjusted using the same, orginal function calls
ggplot2::coord_cartesian(ylim= c(3, 8)) +ggplot2::scale_y_continuous(breaks= seq(3, 8, by=1))
All pictures copied from the GitHub page of ggstatsplot [original]
ggscatterstats
Not all plots are ggplot2-compatible though, for instance, ggscatterstats is not. Nevertheless, it produces a very powerful plot in my opinion.
All pictures copied from the GitHub page of ggstatsplot [original]
ggcormat
ggcorrmat is also quite impressive, producing correlalograms with only minimal amounts of code as it wraps around ggcorplot. The defaults already produces publication-ready correlation matrices:
ggstatsplot::ggcorrmat(
data=datasets::iris,
corr.method="spearman",
sig.level=0.005,
cor.vars=Sepal.Length:Petal.Width,
cor.vars.names= c("Sepal Length", "Sepal Width", "Petal Length", "Petal Width"),
title="Correlalogram for length measures for Iris species",
subtitle="Iris dataset by Anderson",
caption= expression(
paste(
italic("Note"),
": X denotes correlation non-significant at ",
italic("p "),
"< 0.005; adjusted alpha"
)
)
)
All pictures copied from the GitHub page of ggstatsplot [original]
ggcoefstats
Finally, ggcoefstats is a wrapper around GGally::ggcoef, creating a plot with the regression coefficients’ point estimates as dots with confidence interval whiskers. Here’s an example with some detailed specifications:
ggstatsplot::ggcoefstats(
x=stats::lm(formula=mpg~am*cyl,
data=datasets::mtcars),
point.color="red",
vline.color="#CC79A7",
vline.linetype="dotdash",
stats.label.size=3.5,
stats.label.color= c("#0072B2", "#D55E00", "darkgreen"),
title="Car performance predicted by transmission and cylinder count",
subtitle="Source: 1974 Motor Trend US magazine"
) +ggplot2::scale_y_discrete(labels= c("transmission", "cylinders", "interaction")) +ggplot2::labs(x="regression coefficient",
y=NULL)
All pictures copied from the GitHub page of ggstatsplot [original]I for one am very curious to see how Indrajeet will further develop this package, and whether academics will start using it as a default in publishing.