Zack Nado wrote the best machine learning application I’ve seen so far: a neural network architecture that generates new Pusheen pictures.
This is an orginal Pusheen picture.
In his blog, Zack describes his generative adversarial network (GAN) , a special type of machine learning architecture where two neural networks try to fool each other. Zack first gave the discriminator network some real Pusheen images, so it gets an idea of what Pusheen looks like. Next, the generator network gets a bunch of random numbers so it can generate completely new (fake) images. These generated images are then fed back into the discriminator, so it knows what generated images look like. Zack repeated this process several hundred thousand times, so he obtained a generator network that’s great at making new Pusheen images which the discriminator (nearly) can’t dinstinguish from the original, real ones. Below is the learning process of the generator network visualized:
Samples output by the generator network. It learns distinctive features of “real” Pusheen (e.g., tail, eyes, ears) over time [original]
In the end, the generated images are very much like the real Pusheen. Zack added an interactive module (using Tensorflow.js) to the blog so you can generate some Pusheens yourself. (it didn’t work for me though…) On a final note, Zack wrote the orginal blog both in plain English, for non-experts, and in jargon, for the more experienced data scientists. I highly recommend you read either one of those versions!
Some of the Pusheen’s generated by Zack’s GAN [original]
In optimizing their transportation services, Uber uses evolutionary strategies and genetic algorithms to train deep neural networks through reinforcement learning. A lot of difficult words in one sentence; you can imagine the complexity of the process.
Because it is particularly difficult to observe the underlying dynamics of this learning process in neural network optimization, Uber built VINE – a Visual Inspector for NeuroEvolution. VINE helps to discover how evolutionary strategies and genetic optimizing are performing under the hood. In a recent article, they demonstrate how VINE works on the MujocoHumanoid Locomotion task.
[…] In the Humanoid Locomotion Task, each pseudo-offspring neural network controls the movement of a robot, and earns a score, called its fitness, based on how well it walks. [Evolutionary principles] construct the next parent by aggregating the parameters of pseudo-offspring based on these fitness scores […]. The cycle then repeats.
VINE plots parent neural networks and their pseudo-offspring according to their performance. Users can then interact with these plots to:
visualize parents, top performance, and/or the entire pseudo-offspring cloud of any generation,
compare between and within generation performance,
and zoom in on any pseudo-offspring (points) in the plot to display performance information.
The GIFs below demonstrate what VINE is capable of displaying:
The evolution of performance over generations. The color changes in each generation. Within a generation, the color intensity of each pseudo-offspring is based on the percentile of its fitness score in that generation (aggregated into five bins). [original]Vine allows user to deep dive into each single generation, comparing generations and each pseudo-offspring within them [original]VINE can be found at this link. It is lightweight, portable, and implemented in Python.
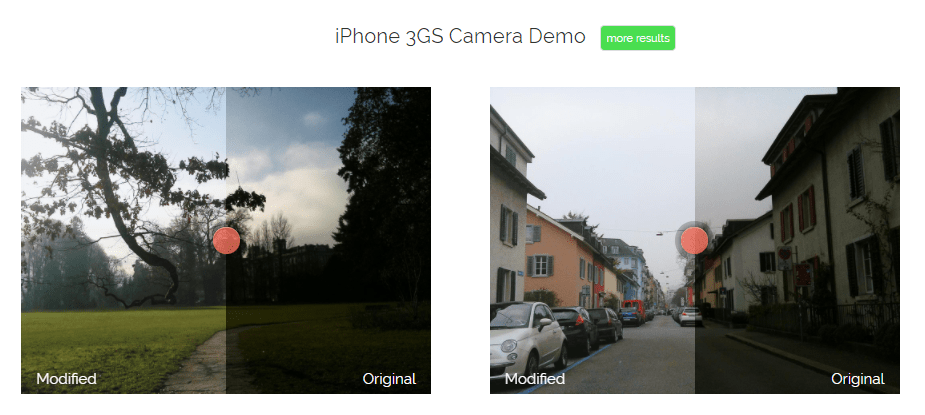
In the video below, one of my favorite YouTube channels (Two Minute Papers) discusses a new super resolution project where academic scholars taught a neural network to improve low quality photo’s. The researchers took the same picture with multiple camera’s of varying quality and allowed a neural network to learn how the lowest quality pictures can be adjusted to more closely resemble their high quality counterparts. A very interesting approach and the results are just mind-boggling:
Google has announced to provide open access to its artificial intelligence and machine learning courses. On their overview page, you will find many educational resources from machine learning experts at Google. They announced to share AI and machine learning lessons, tutorials and hands-on exercises for people at all experience levels. Simply filter through the resources and start learning, building and problem-solving.
For instance, up your game straight away with this 15-hour Machine Learning crash course. Zuri Kemp – who leads Google’s machine learning education program – said that over 18,000 Googlers have already enrolled in the course. Designed by the engineering education team, the courses explores loss functions and gradient descent and teached you to build your own neural network in Tensorflow.
The field of computer vision tries to replicate our human visual capabilities, allowing computers to perceive their environment in a same way as you and I do. The recent breakthroughs in this field are super exciting and I couldn’t but share them with you.
In the TED talk below by Joseph Redmon (PhD at the University of Washington) showcases the latest progressions in computer vision resulting, among others, from his open-source research on Darknet – neural network applications in C. Most impressive is the insane speed with which contemporary algorithms are able to classify objects. Joseph demonstrates this by detecting all kinds of random stuff practically in real-time on his phone! Moreover, you’ve got to love how well the system works: even the ties worn in the audience are classified correctly!
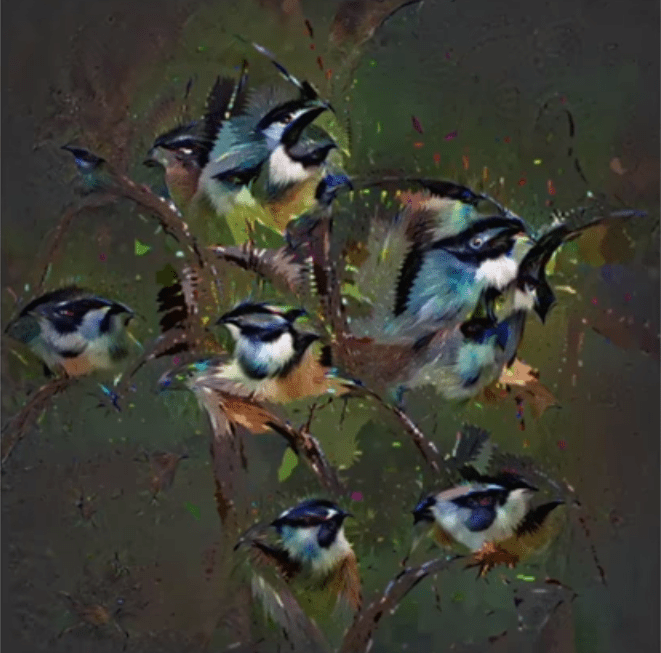
The second talk, below, is more scientific and maybe even a bit dry at the start. Blaise Aguera y Arcas (engineer at Google) starts with a historic overview brain research but, fortunately, this serves a cause, as ~6 minutes in Blaise provides one of the best explanations I have yet heard of how a neural network processes images and learns to perceive and classify the underlying patterns. Blaise continues with a similarly great explanation of how this process can be reversed to generate weird, Asher-like images, one could consider creative art:
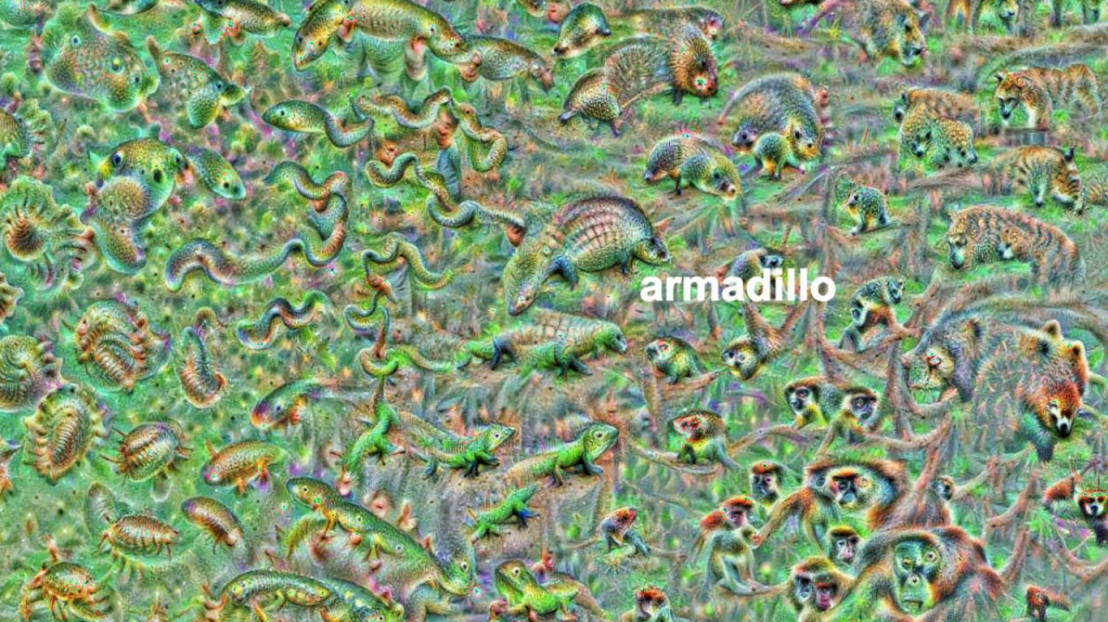
An example of a reversed neural network thus “estimating” an image of a bird [via Youtube]Blaise’s colleagues at Google took this a step further and used t-SNE to visualize the continuous space of animal concepts as perceived by their neural network, here a zoomed in part on the Armadillo part of the map, apparently closely located to fish, salamanders, and monkeys?
A zoomed view of part of a t-SNE map of latent animal concepts generated by reversing a neural network [via Youtube]We’ve seen these latent spaces/continua before. This example Andrej Karpathy shared immediately comes to mind:
If you want to learn more about this process of image synthesis through deep learning, I can recommend the scientific papers discussed by one of my favorite Youtube-channels, Two-Minute Papers. Karoly’s videos, such as the ones below, discuss many of the latest developments:
Let me know if you have any other video’s, papers, or materials you think are worthwhile!
Things can get confusing quite quickly if you’re a layman. People boast about boosting while deep, brain-like networks are used to play child’s games. Data guru’s speak of mighty, though random woodlands and the media simultaneously praise and criticize IBM Watson. To create even more confusion, consultancy firms introduce a new type of analytics every year, each one more valuable than its predecessor. I am not even kidding, I counted seveneightnineten eleven types: descriptive, diagnostic, exploratory, inferential, strategic, causal, enterprise, advanced, predictive, prescriptive, adaptive, and cognitive analytics, roughly in that order of complexity.
The resulting confusion I experience firsthand in my work. In my workshops, people would ask questions like “How can I use data mining to make our dashboards to morepredictive?” or“How can I build neural networks to understand our customer needs?”. Similarly, I’ve heard managers ask for more “cognitive solutions” or “one of those fancy neural networks“. However, things can get pretty ugly, pretty soon, once unnecessary complexity is introduced without good reasons (e.g., superior performance, processing speed), appropriate foundations (e.g., accurate, valid, and sufficient data), or good research designs (e.g., control conditions, random assignment, out-of-sample validation).
It is high time to demystify the data domain. If people outside the direct domain know what’s what, they will better understand what can and can’t be done with data. Moreover, they will not be as easily fooled by the cognitive AI mumbojumbo of consultants. A recent blog made me very happy. David Robinson — data scientist at StackOverflow — proposes very simple definitions of three interrelated domains (data science, machine learning, and artificial intelligence) and highlights their differences. If you haven’t yet, do read it, but to summarize David’s take:
Data science produces insights
Machine learning produces predictions
Artificial intelligence produces actions
These definitions are overly simplistic, David acknowledges, and not without their flaws: “A fortune teller makes predictions, but we’d never say that they’re doing machine learning!”. However, I feel its a great first attempt at demystification. Particularly, the applied example with which David continues make matters more clear:
Suppose we were building a self-driving car, and were working on the specific problem of stopping at stop signs. We would need skills drawn from all three of these fields.
Machine learning: The car has to recognize a stop sign using its cameras. We construct a dataset of millions of photos of streetside objects, and train an algorithm to predict which have stop signs in them.
Artificial intelligence: Once our car can recognize stop signs, it needs to decide when to take the action of applying the brakes. It’s dangerous to apply them too early or too late, and we need it to handle varying road conditions (for example, to recognize on a slippery road that it’s not slowing down quickly enough), which is a problem of control theory.
Data science: In street tests, we find that the car’s performance isn’t good enough, with some false negatives in which it drives right by a stop sign. After analyzing the street test data, we gain the insight that the rate of false negatives depends on the time of day: it’s more likely to miss a stop sign before sunrise or after sunset. We realize that most of our training data included only objects in full daylight, so we construct a better dataset including nighttime images and go back to the machine learning step.
This got me thinking about how I would explain the field to a layman. In Human Resource Management (my PhD domain), there is enormous confusion around what’s what. When HR professionals speak of analytics they can mean about anything from a group average or a bar chart up to a deep neural network. I hoped that a simple diagram could help solve some of the confusion in terminology. Here’s my attempt:
A process diagram in order to demystify the fancy analytical terminology.
Note that this diagram reflects my personal, implicit definitions of the concepts. Hence, in many ways, it may be biased, incorrect, or plain stupid. Fortunately, the r/datascience and r/MachineLearning communities were very willing to help me improve it. I should also stress that David’s blog inspired the attempt in the first place. While the diagram still greatly oversimplifies matters (and is in conflict with the purist academic definitions), I hope its helps as a layman’s introduction to the field.
How to read it? From left to right, we start out with raw data. Often, we’d first transform this data into usable features/variables: discriminatory characteristics of the objects were trying to analyze. On the one hand, a researcher may engineer these features. For instance, by some (statistical) transformation such as taking the average X within groups or reducing the number of categories for Z. On the other hand, unsupervised machine learning techniques may be applied to (semi-)automatically engineer features by identifying relevant clusters or dimensions in the data.
Next, the features can be input into statistical analysis. Taking the upper path, both unsupervised and supervised machine learning techniques can be used to build models that can be interpreted to gain insights about phenomena. This process is what business people usually mean when they say “analytics“. Mostly, it involves descriptive, causal or inferential analyses in order to gain insights into some process or phenomenon. Taking the lower path, supervised learning may be applied build a predictive model and retrieve predictions for a dependent variable. These predictions may also be evaluated using further analysis to retrieve insights. For instance, to gain understanding about what’s driving the predictions or how the predictions may be leveraged in practice.
Finally, both predictions and insights may form the basis of actions, which can be taken by a human agent or by a computer agent. In the latter case, we would deal with AI by some definitions.
There is one more route in the diagram, going directly from the raw data to the predictions: deep learning. Here, a neural network may take in complex data (e.g., text, images, sound) and engineer relevant features autonomously to base predictions on.
Disclaimer: The diagram is a major oversimplification! Particularly the placement of and overlap between the domains in this diagram is a simplification and not very good by purist, academic standards. For instance, despite being a extremely important field of innovation, I excluded reinforcement learning as I was unable to place it without making the figure considerably more complex. Similarly, the others domains do not have as clear demarcations as this figure suggests and their placement is by my definition of them. Data science, in my opinion, reflects the diffusion of insights or knowledge from data, particularly the (human) decisions and actions made in that process. Much of data science relies on machine learning, which involves how algorithms learn a model of reality from data, observations, or experiences. This learning can occur in different forms (e.g., supervised, unsupervised, deep, and reinforcement learning) and, unlike David’s definition, thus not always output predictions (e.g., also dimensions, clusters). Finally, machine learning is a specific branch of artificial intelligence, a label that has had many definitions. In my eyes, it includes any (partially) automated process where seemingly intelligent actions are automatically executed based on decision rules. An action can be as simple as a single if-then statement or as complex as a smart fridge ordering new milk. Whether AI is or should be considered a part of data science is food for a different discussion. For much more straightforward definitions of the fields, please consult this slide shared by u/mmcmtl:
If you have any thoughts on how the above diagram and/or blog could or should be improved, feel free to comment below, reach out, or share your own attempts!