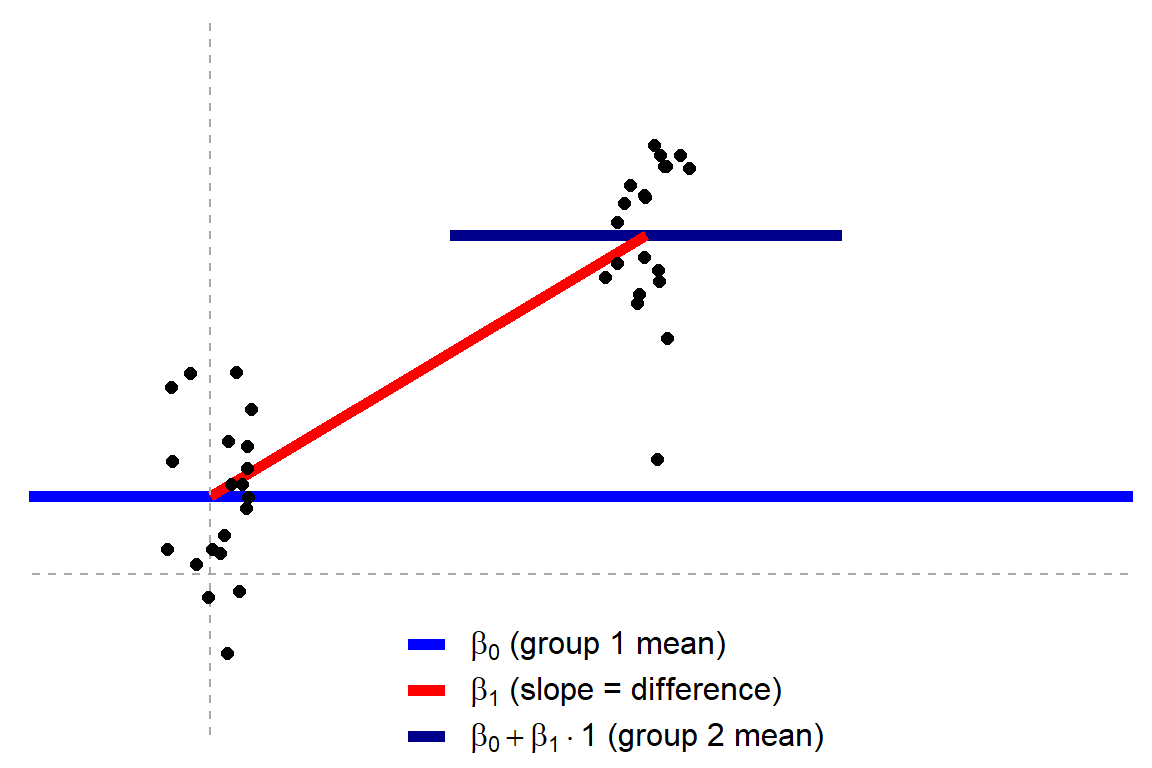
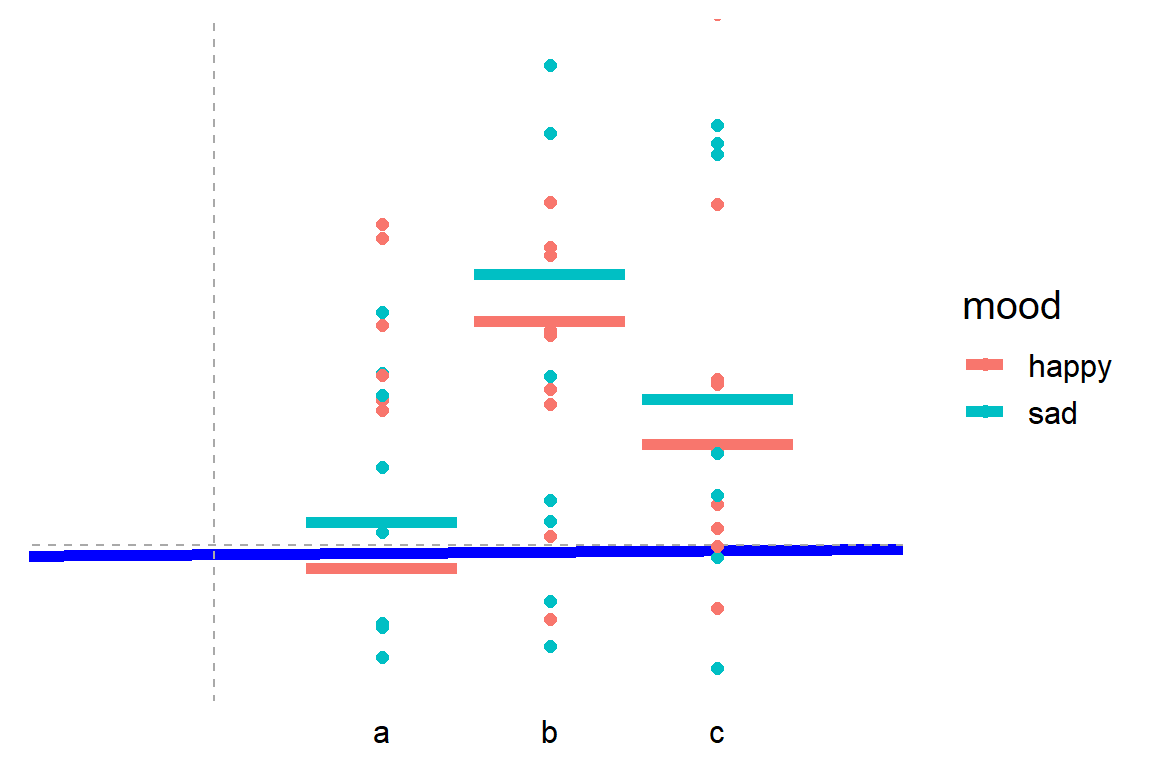
Jonas’ original blog uses R programming to visually show how the tests work, what the linear models look like, and how different approaches result in the same statistics.
How do scurvy, astronomy, alchemy and data science relate to each other?
In this goto conference presentation, Lucas Vermeer — Director of Experimentation at Booking.com — uses some amazing storytelling to demonstrate how the value of data (science) is largely by organizations capability to gather the right data — the data they actually need.
It’s a definite recommendation to watch for data scientists and data science leaders out there.
Here are the slides, and they contain some great oneliners:
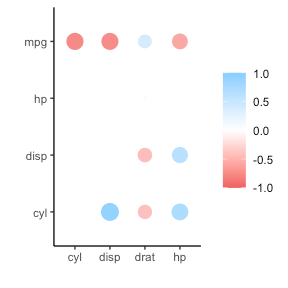
In most (observational) research papers you read, you will probably run into a correlation matrix. Often it looks something like this:
In Social Sciences, like Psychology, researchers like to denote the statistical significance levels of the correlation coefficients, often using asterisks (i.e., *). Then the table will look more like this:
Regardless of my personal preferences and opinions, I had to make many of these tables for the scientific (non-)publications of my Ph.D..
I remember that, when I first started using R, I found it quite difficult to generate these correlation matrices automatically.
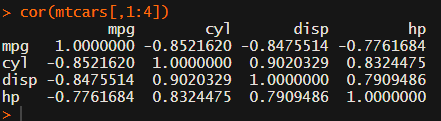
Yes, there is the cor function, but it does not include significance levels.
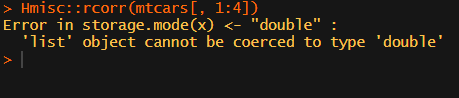
Then there the (in)famous Hmisc package, with its rcorr function. But this tool provides a whole new range of issues.
What’s this storage.mode, and what are we trying to coerce again?
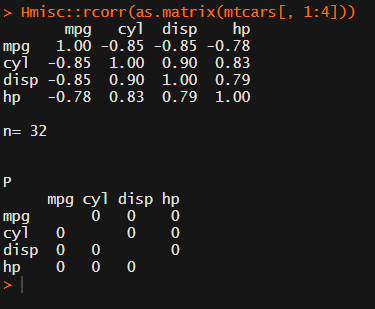
Soon you figure out that Hmisc::rcorr only takes in matrices (thus with only numeric values). Hurray, now you can run a correlation analysis on your dataframe, you think…
Yet, the output is all but publication-ready!
You wanted one correlation matrix, but now you have two… Double the trouble?
[UPDATED] To spare future scholars the struggle of the early day R programming, Laura Lambert and I created an R package corrtable, which includes the helpful function correlation_matrix.
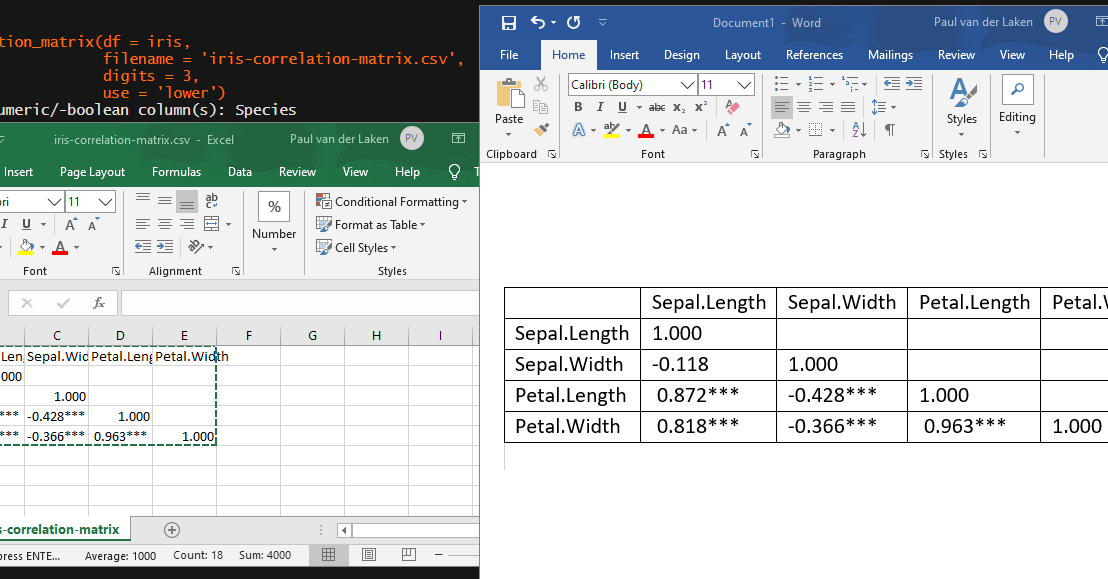
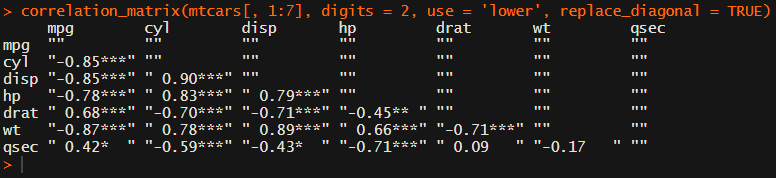
This correlation_matrix takes in a dataframe, selects only the numeric (and boolean/logical) columns, calculates the correlation coefficients and p-values, and outputs a fully formatted publication-ready correlation matrix!
For instance, you can use only 2 decimals. You can focus on the lower triangle (as the lower and upper triangle values are identical). And you can drop the diagonal values:
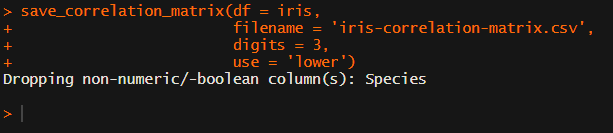
Or maybe you are interested in a different type of correlation coefficients, and not so much in significance levels:
Cohen’s d (wiki) is a statistic used to indicate the standardised difference between two means. Resarchers often use it to compare the averages between groups, for instance to determine that there are higher outcomes values in a experimental group than in a control group.
Researchers often use general guidelines to determine the size of an effect. Looking at Cohen’s d, psychologists often consider effects to be small when Cohen’s d is between 0.2 or 0.3, medium effects (whatever that may mean) are assumed for values around 0.5, and values of Cohen’s d larger than 0.8 would depict large effects (e.g., University of Bath).
The two groups’ distributions belonging to small, medium, and large effects visualized
By the way, Kristoffer hosts many other interesting visualization tools (most made with JavaScript’s D3 library) on statistics and statistical phenomena on his website, have a look!
By adjusting the three elements in this simple framework, you can build any type of machine learning program.
In the tutorial, Eric shows you how to implement this same framework in Python (using jax) and implement linear regression, logistic regression, and artificial neural networks all in the same way (using gradient descent).
I can’t even begin to explain it as well as Eric does himself, so I highly recommend you watch and code along with the Youtube tutorial (~1 hour):
Have you ever wondered what goes on behind the scenes of a deep learning framework? Or what is going on behind that pre-trained model that you took from Kaggle? Then this tutorial is for you! In this tutorial, we will demystify the internals of deep learning frameworks – in the process equipping us with foundational knowledge that lets us understand what is going on when we train and fit a deep learning model. By learning the foundations without a deep learning framework as a pedagogical crutch, you will walk away with foundational knowledge that will give you the confidence to implement any model you want in any framework you choose.


