In a recent post, Claus shared the link to a GitHub repository where he hosts some of the R programming code with which Claus made the graphics for his dataviz book. The repository is named practical ggplot2, after the R package Clause used to make many of his visuals.
Check it out, the page contains some pearls and the code behind them, which will help you learn to create fabulous visualizations yourself. Some examples:
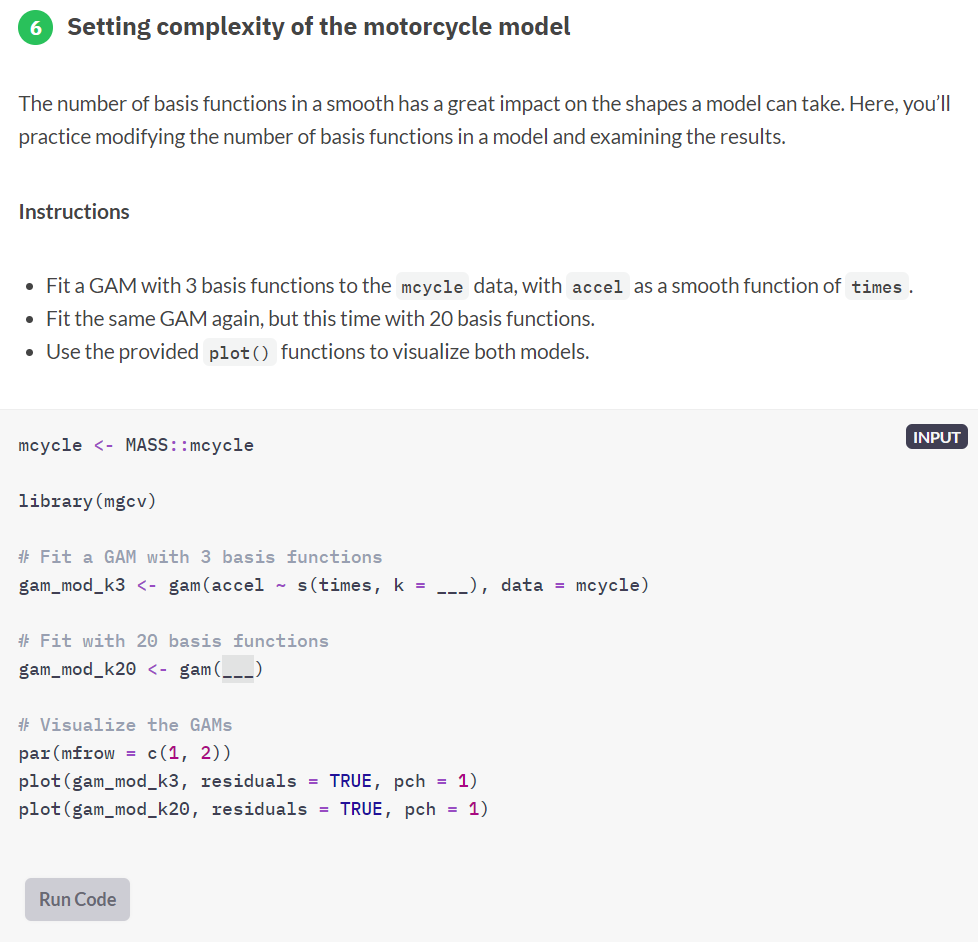
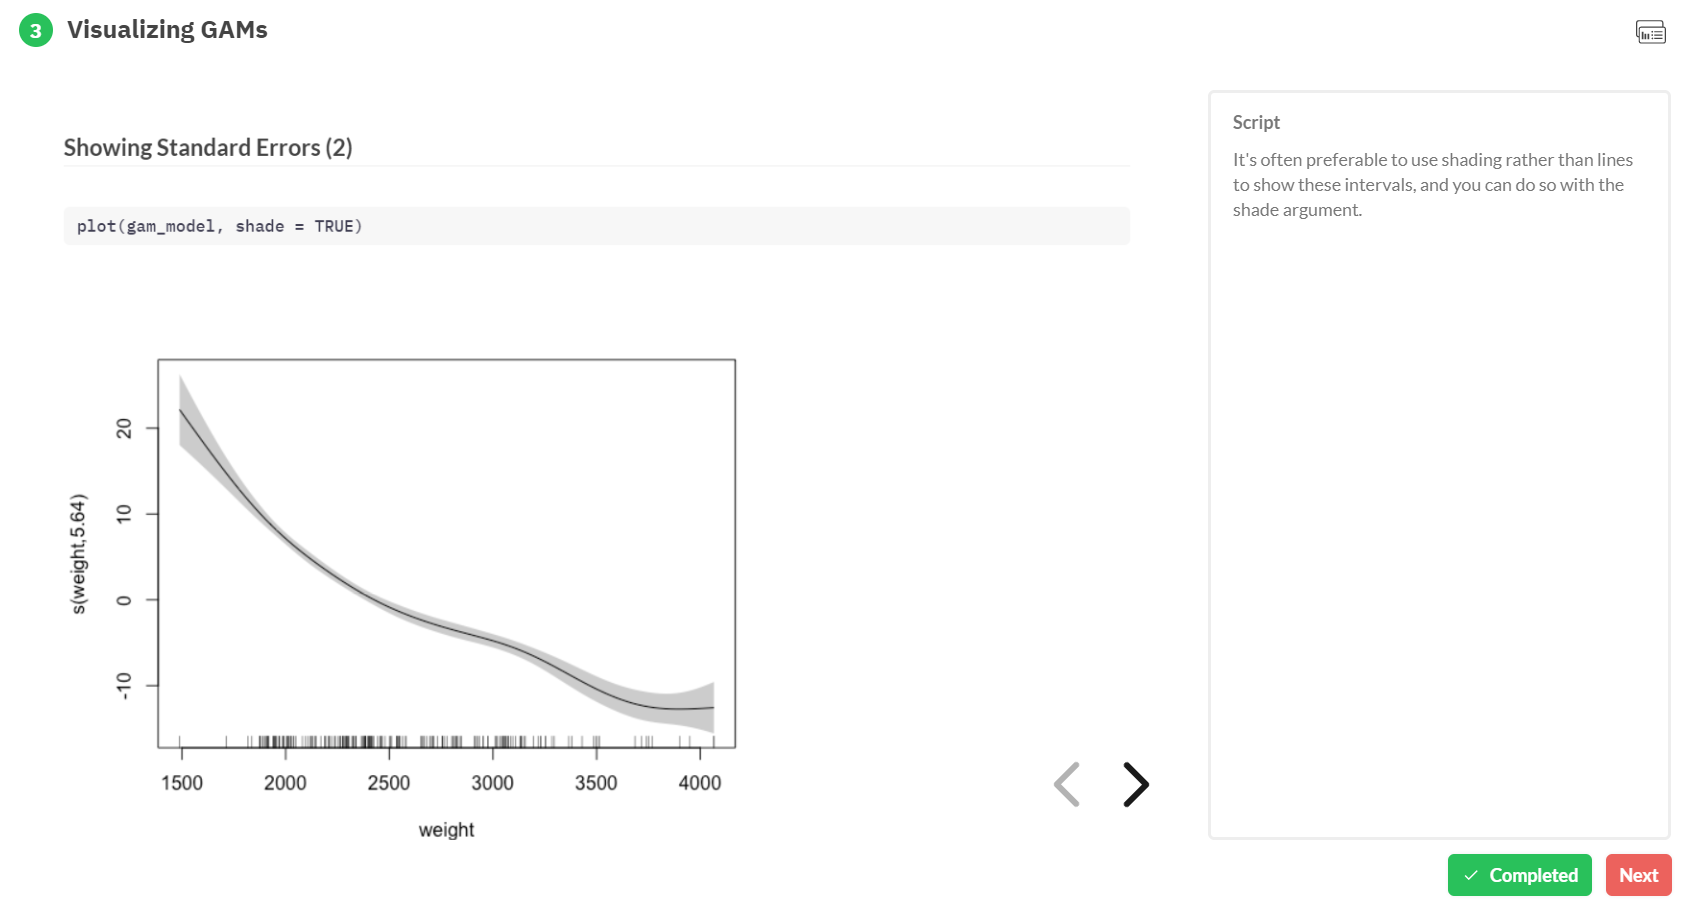
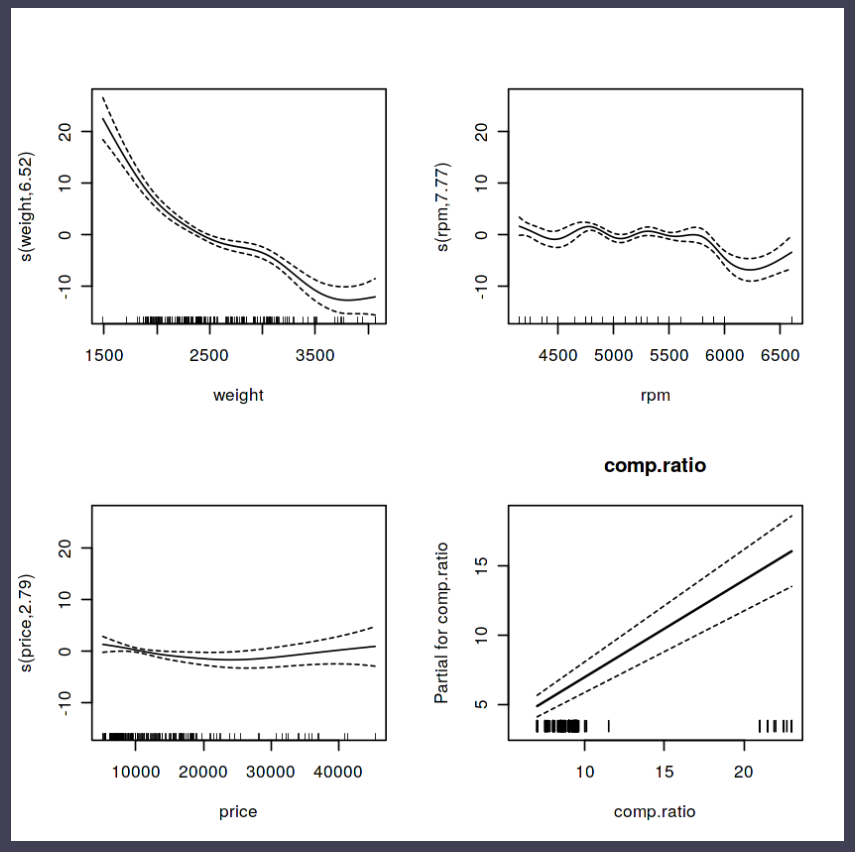
Generalized Additive Models — or GAMs in short — have been somewhat of a mystery to me. I’ve known about them, but didn’t know exactly what they did, or when they’re useful. That came to an end when I found out about this tutorial by Noam Ross.
In this beautiful, online, interactive course, Noam allows you to program several GAMs yourself (in R) and to progressively learn about the different functions and features. I am currently halfway through, but already very much enjoy it.
If you’re already familiar with linear models and want to learn something new, I strongly recommend this course!
This overview is curated in the sense that all resources are rated by CourseDuck’s users. These ratings seem quite reliable, at least, I personally enjoyed their top-3 resources sometime the past years:
Note that all these courses, as well as the curated overview, come free of charge! A great resource for starting data scientists or upcoming pythonistas!
Disclaimer: This page contains one or more links to Amazon. Any purchases made through those links provide us with a small commission that helps to host this blog.
Data visualization and the (in)effective communication of information are salient topics on this blog. I just love to read and write about best practices related to data visualization (or bad practices), or to explore novel types of complex graphs. However, I am not always online, and I am equally fond of reading about data visualization offline.
These amazing books about data visualization are written by some of the leading experts in the dataviz scene:
Josh Starmer is assistant professor at the genetics department of the University of North Carolina at Chapel Hill.
But more importantly: Josh is the mastermind behind StatQuest!
StatQuest is a Youtube channel (and website) dedicated to explaining complex statistical concepts — like data distributions, probability, or novel machine learning algorithms — in simple terms.
Once you watch one of Josh’s “Stat-Quests”, you immediately recognize the effort he put into this project. Using great visuals, a just-about-right pace, and relateable examples, Josh makes statistics accessible to everyone. For instance, take this series on logistic regression:
And do you really know what happens under the hood when you run a principal component analysis? After this video you will:
Or are you more interested in learning the fundamental concepts behind machine learning, then Josh has some videos for you, for instance on bias and variance or gradient descent:
With nearly 200 videos and counting, StatQuest is truly an amazing resource for students ‘and teachers on topics related to statistics and data analytics. For some of the concepts, Josh even posted videos running you through the analysis steps and results interpretation in the R language.
StatQuest started out as an attempt to explain statistics to my co-workers – who are all genetics researchers at UNC-Chapel Hill. They did these amazing experiments, but they didn’t always know what to do with the data they generated. That was my job. But I wanted them to understand that what I do isn’t magic – it’s actually quite simple. It only seems hard because it’s all wrapped up in confusing terminology and typically communicated using equations. I found that if I stripped away the terminology and communicated the concepts using pictures, it became easy to understand.
Over time I made more and more StatQuests and now it’s my passion on YouTube.
With great pleasure I’ve studied and worked in the field of people analytics, where we seek to leverage employee, management-, and business information to better organize and manage our personnel. Here, data has proven valuable itself indispensible for the organization of the future.
Data and analytics have not traditionally been high on the list of HR professionals. Fortunately, there is an increased awareness that the 21st century (HR) manager has to be data-savvy. But where to start learning? The plentiful available resources can be daunting…
Have a look at these 100+ amazing books for (starting) people analytics specialists. My personal recommendations are included as pictures, but feel free to ask for more detailed suggestions!
Categories (clickable)
Behavioural Psychology: focus on behavioural psychology and economics, including decision-making and the biases therein.
Technology: focus on the implications of new technology….
Ethics: … on society and humanity, and what can go wrong.
Digital & Data-driven HR: … for the future of work, workforce, and organization. Includes people analytics case studies.
Management: focus on industrial and organizational psychology, HR, leadership, and business strategy.
Statistics: focus on the technical books explaining statistical concepts and applied data analysis.
People analytics: …. more technical books on how to conduct people analytics studies step-by-step in (statistical) software.
Programming: … technical books specifically aimed at (statistical) programming and data analysis.
Communication: focus on information exchange, presentation, and data visualization.
Disclaimer: This page contains one or more links to Amazon. Any purchases made through those links provide us with a small commission that helps to host this blog.
I want to thank the active people analytics community, publishing in management journals, but also on social media. I knew Littral Shemer Haim already hosted a people analytics reading list, and so did Analytics in HR (Erik van Vulpen) and Workplaceif (Manoj Kumar). After Jared Valdron called for book recommendation on people analytics on LinkedIn, and nearly 60 people replied, I thought let’s merge these overviews.
Hence, a big thank you and acknowledgement to all those who’ve contributed directly or indirectly. I hope this comprehensive merged overview is helpful.