I really like generative art, or so-called algorithmic art. Basically, it means you take a pattern or a complex system of rules, and apply it to create something new following those patterns/rules.
When I finished my PhD, I got a beautiful poster of where the k-nearest neighbors algorithms was used to generate a set of connected points.
As we recently moved into our new house, I decided I wanted to have a brother for the knn-poster. So I did some research in algorithms I wanted to use to generate a painting. I found some very cool ones, of which I unforunately can’t recollect the artists anymore:
Note: these are NOT mine
However, I preferred to make one myself. So we again turned to the work of the author that made the knn-poster: Marcus Volz.
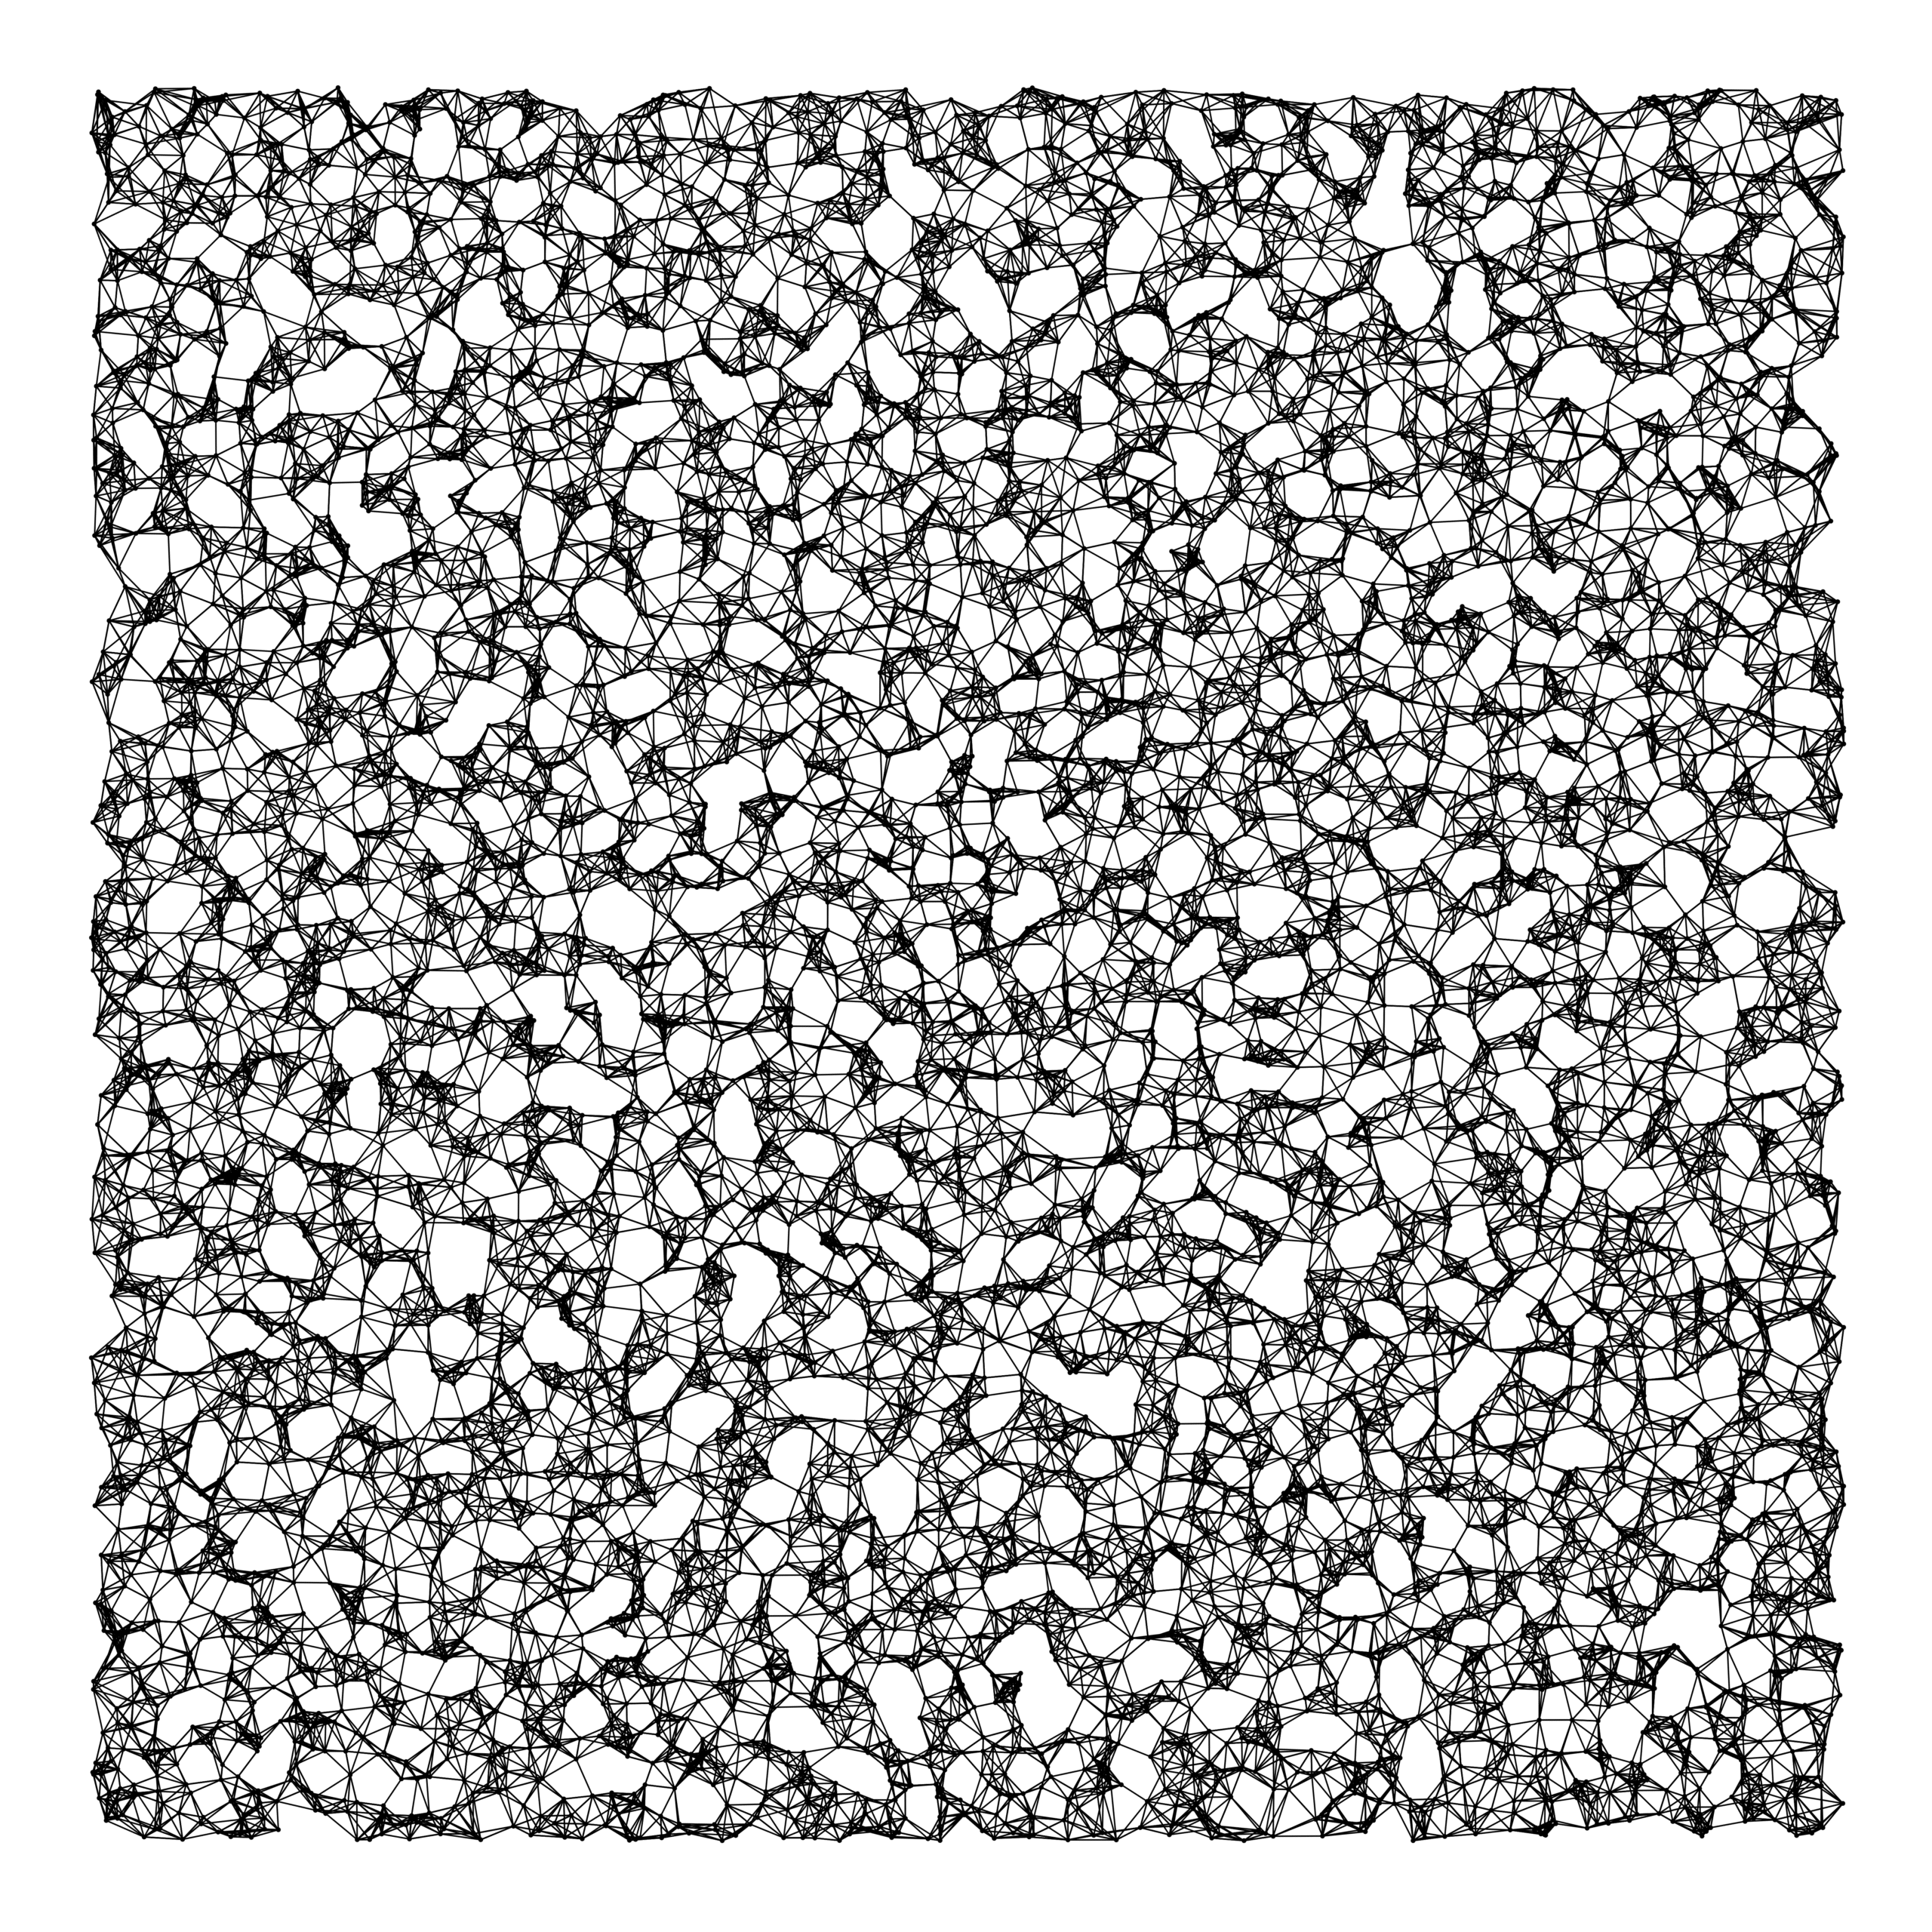
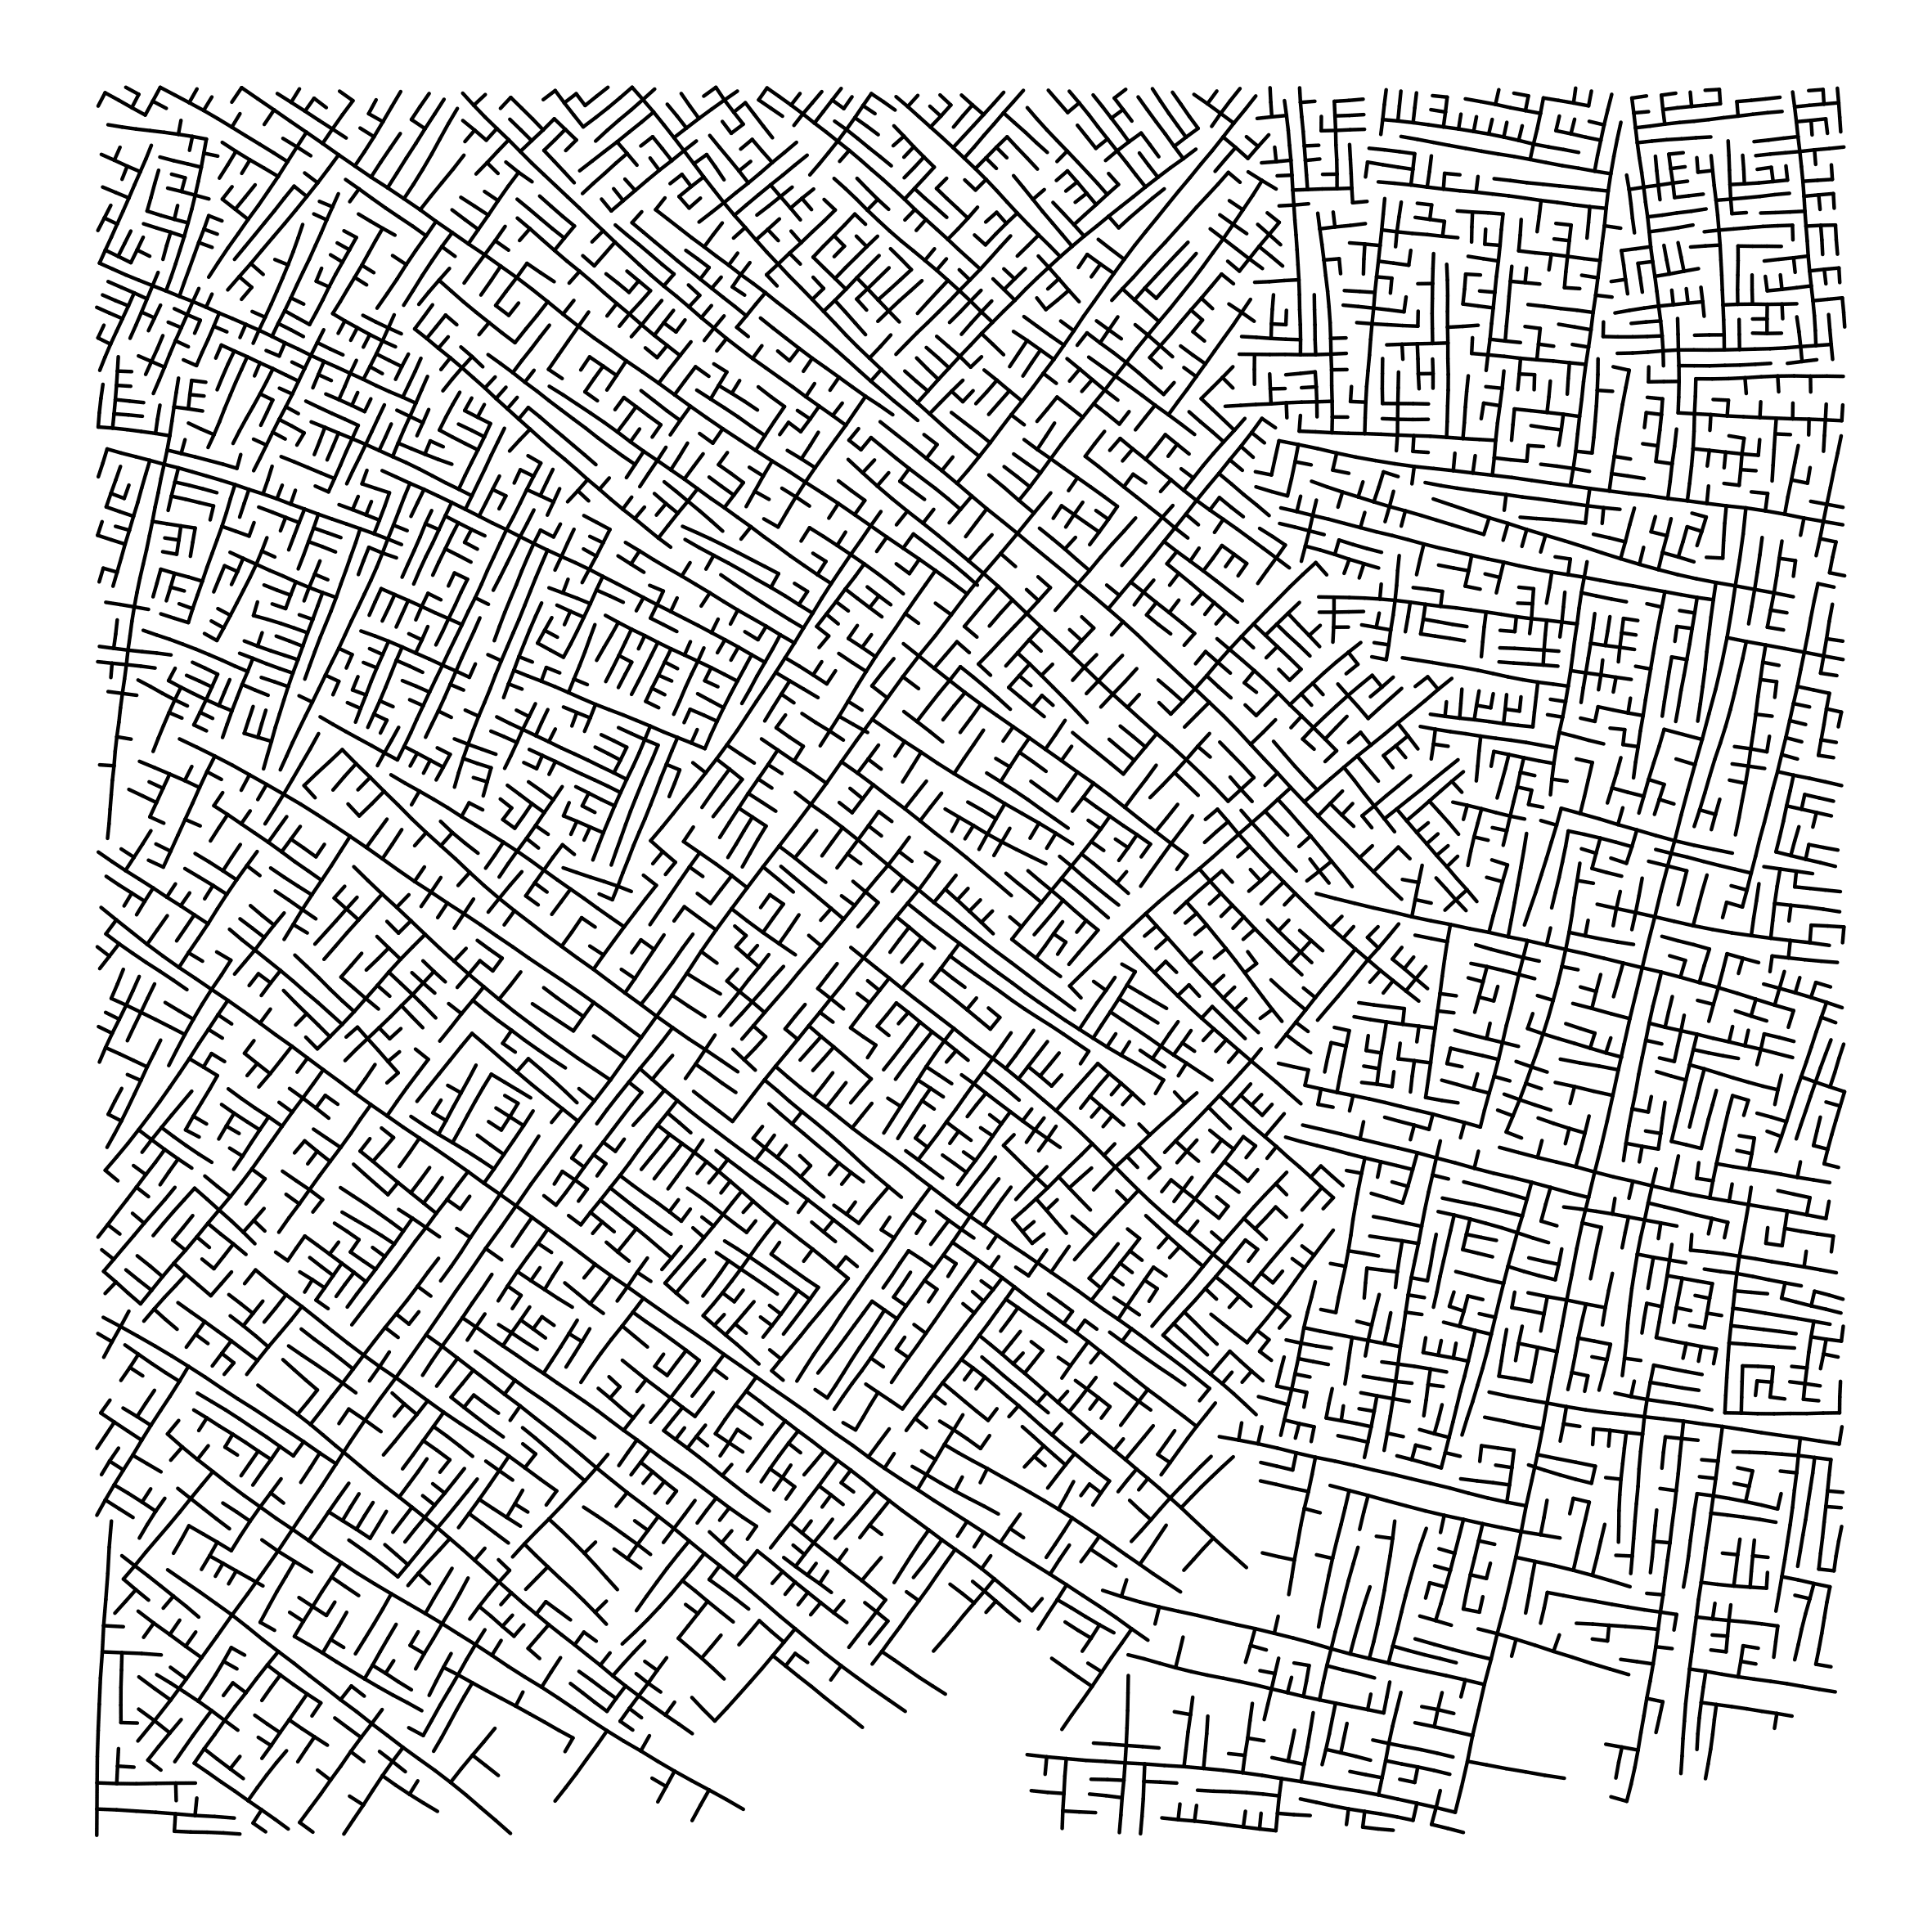
He has written (in R) many other algorithms. And we found that one specifically nicely matched the knn-poster. His metropolis – or generative city:
However, I wanted to make one myself, so I download Marcus code, and tweaked it a bit. Most importantly, I made it start in the center, made it fill up the whole space, and I made it run more efficient so I could generate a couple dozen large cities quickly, and pick the one I liked most. Here’s the end result:
If you are looking for a project to build a bot or AI application, look no further.
Enter the stage, PyBoy, a Nintendo Game Boy (DMG-01 [1989]) written in Python 2.7. The implementation runs in almost pure Python, but with dependencies for drawing graphics and getting user interactions through SDL2 and NumPy.
PyBoy is great for your AI robot projects as it is loadable as an object in Python. This means, it can be initialized from another script, and be controlled and probed by the script. You can even use multiple emulators at the same time, just instantiate the class multiple times.
The imagery suggests you can play anything from classic Super Mario to Pokemon. I suggest you start with the github, background report and PyBoy documentation right away.
I love how people are using data and data science to fight fake news these days (see also Identifying Dirty Twitter Bots), and I recently came across another great example.
Conspirador Norteño (real name unkown) is a member of what they call #TheResistance. It’s a group of data scientists discovering and analyzing so-called botnets – networks of artificial accounts on social media websites, like Twitter.
TheResistance uses quantitative analysis to unveil large groups of fake accounts, spreading potential fake news, or fake-endorsing the (fake) news spread by others.
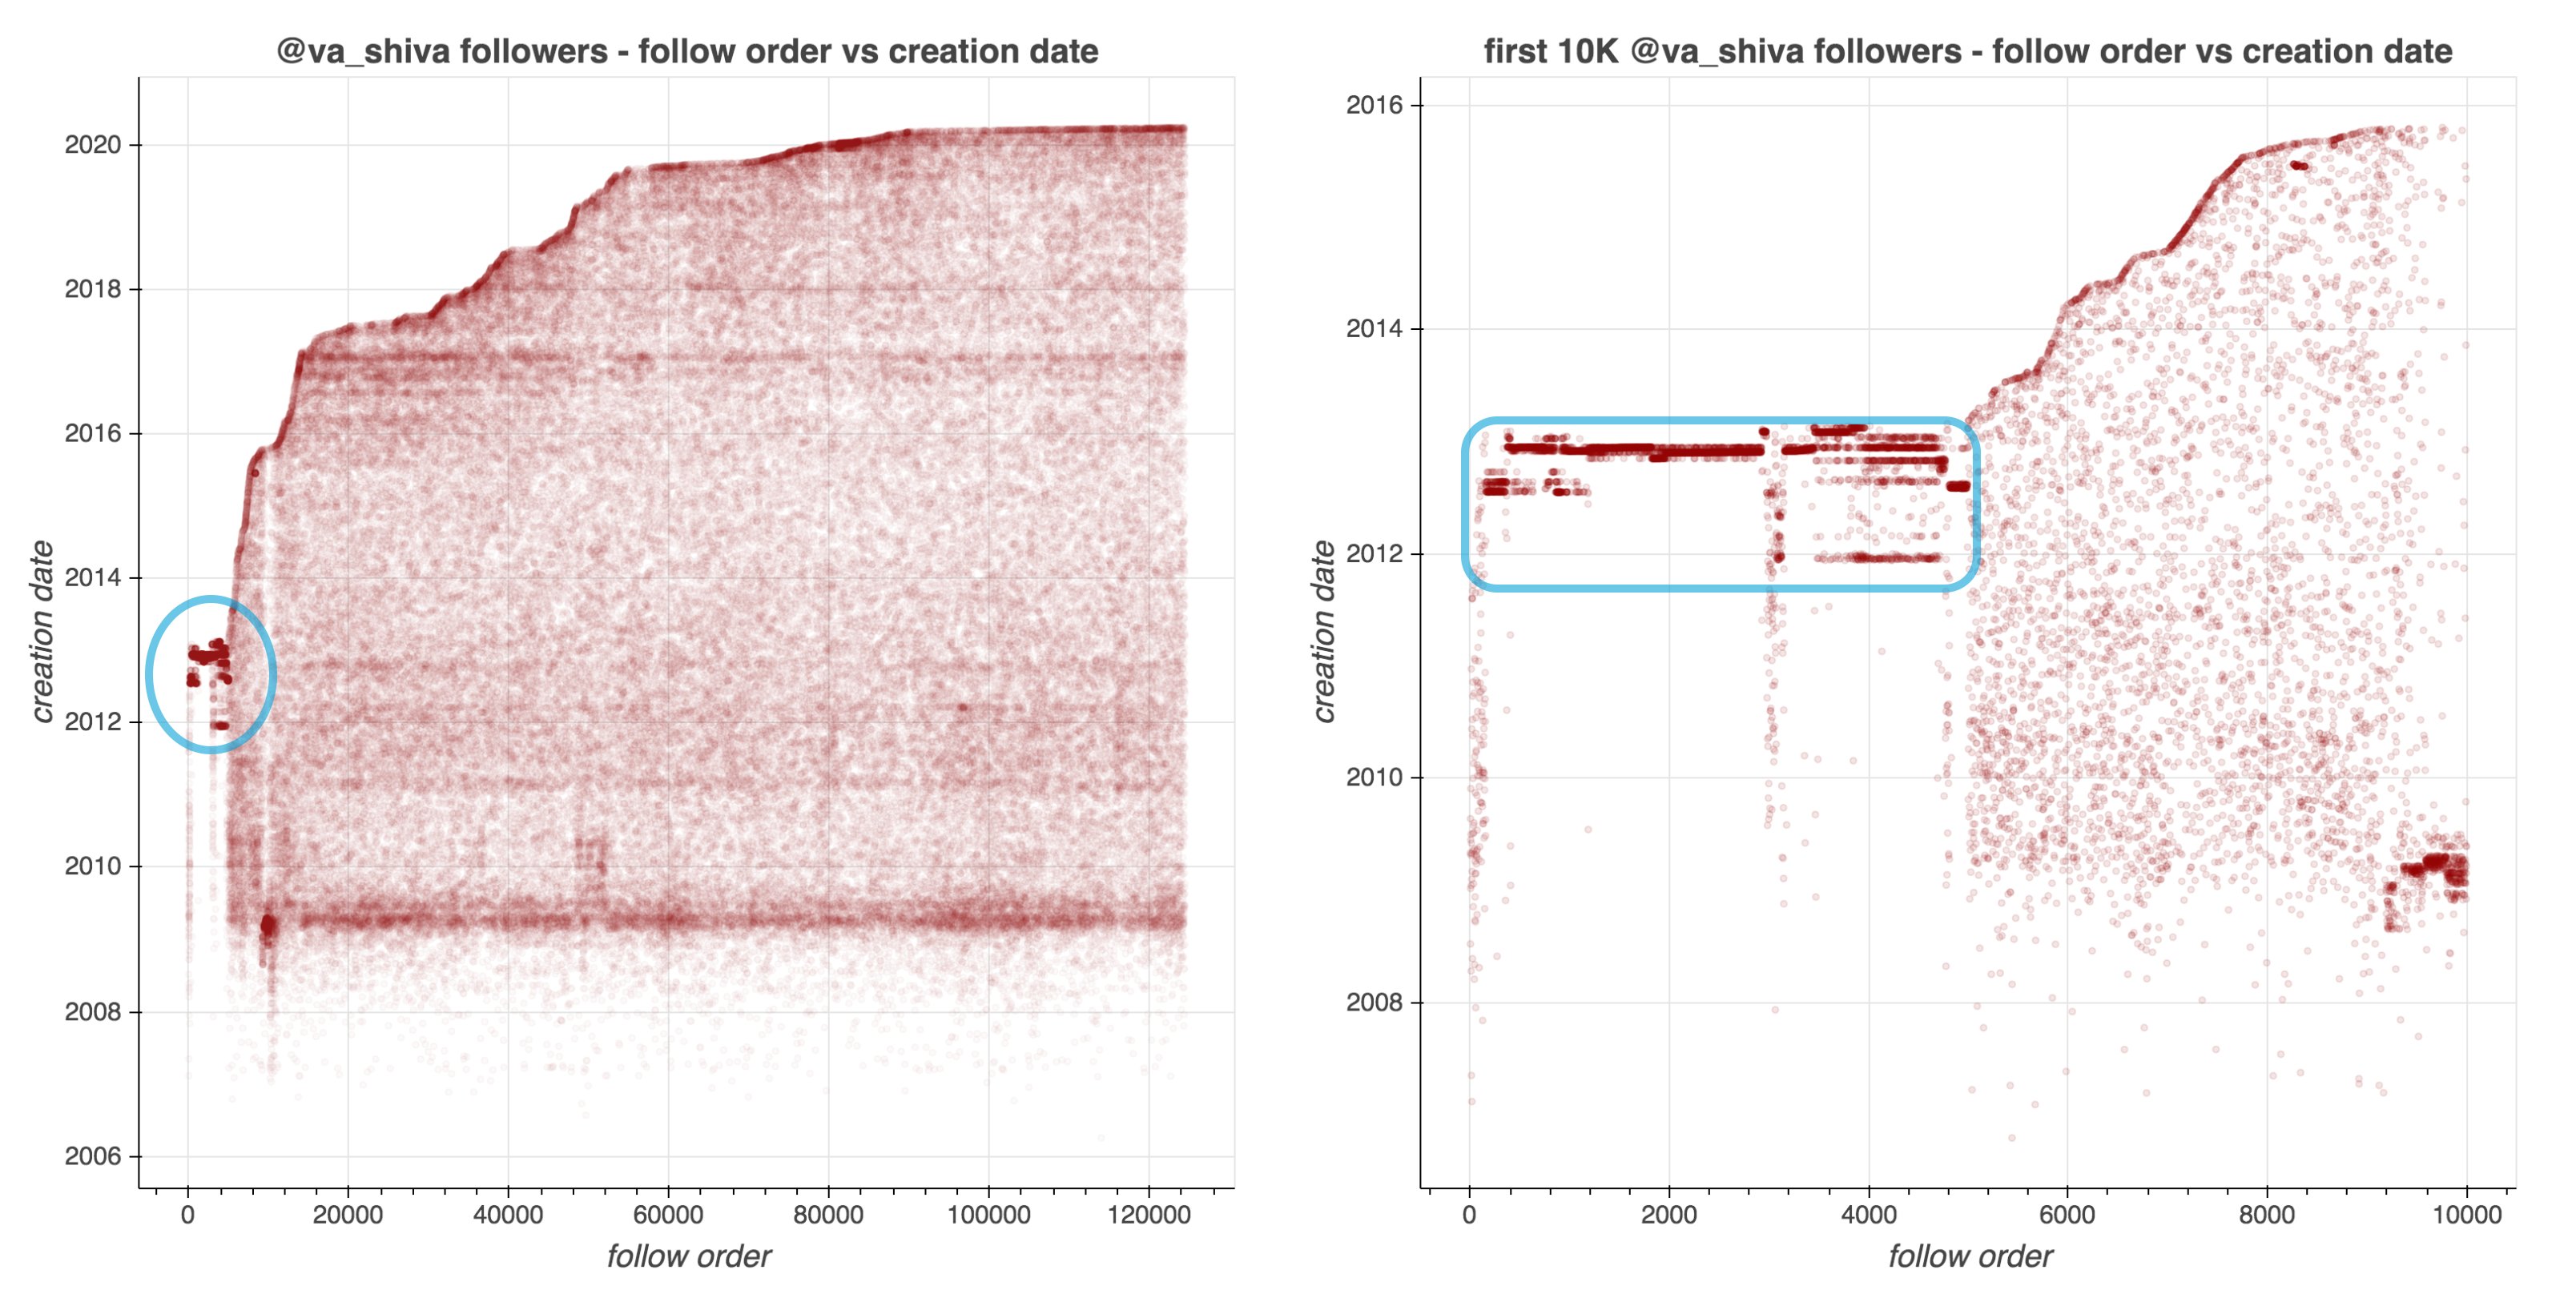
In a recent Twitter thread, Norteno shows how they discovered that many of Dr. Shiva Ayyadurai (self-proclaimed Inventor of Email) his early followers are likely bots.
They looked at the date of these accounts started following Shiva, offset by the date of their accounts’ creation. A remarkeable pattern appeared:
Although @va_shiva‘s recent followers look unremarkable, a significant majority of his first 5000 followers appear to have been created in batches and to have subsequently followed @va_shiva in rapid succession.
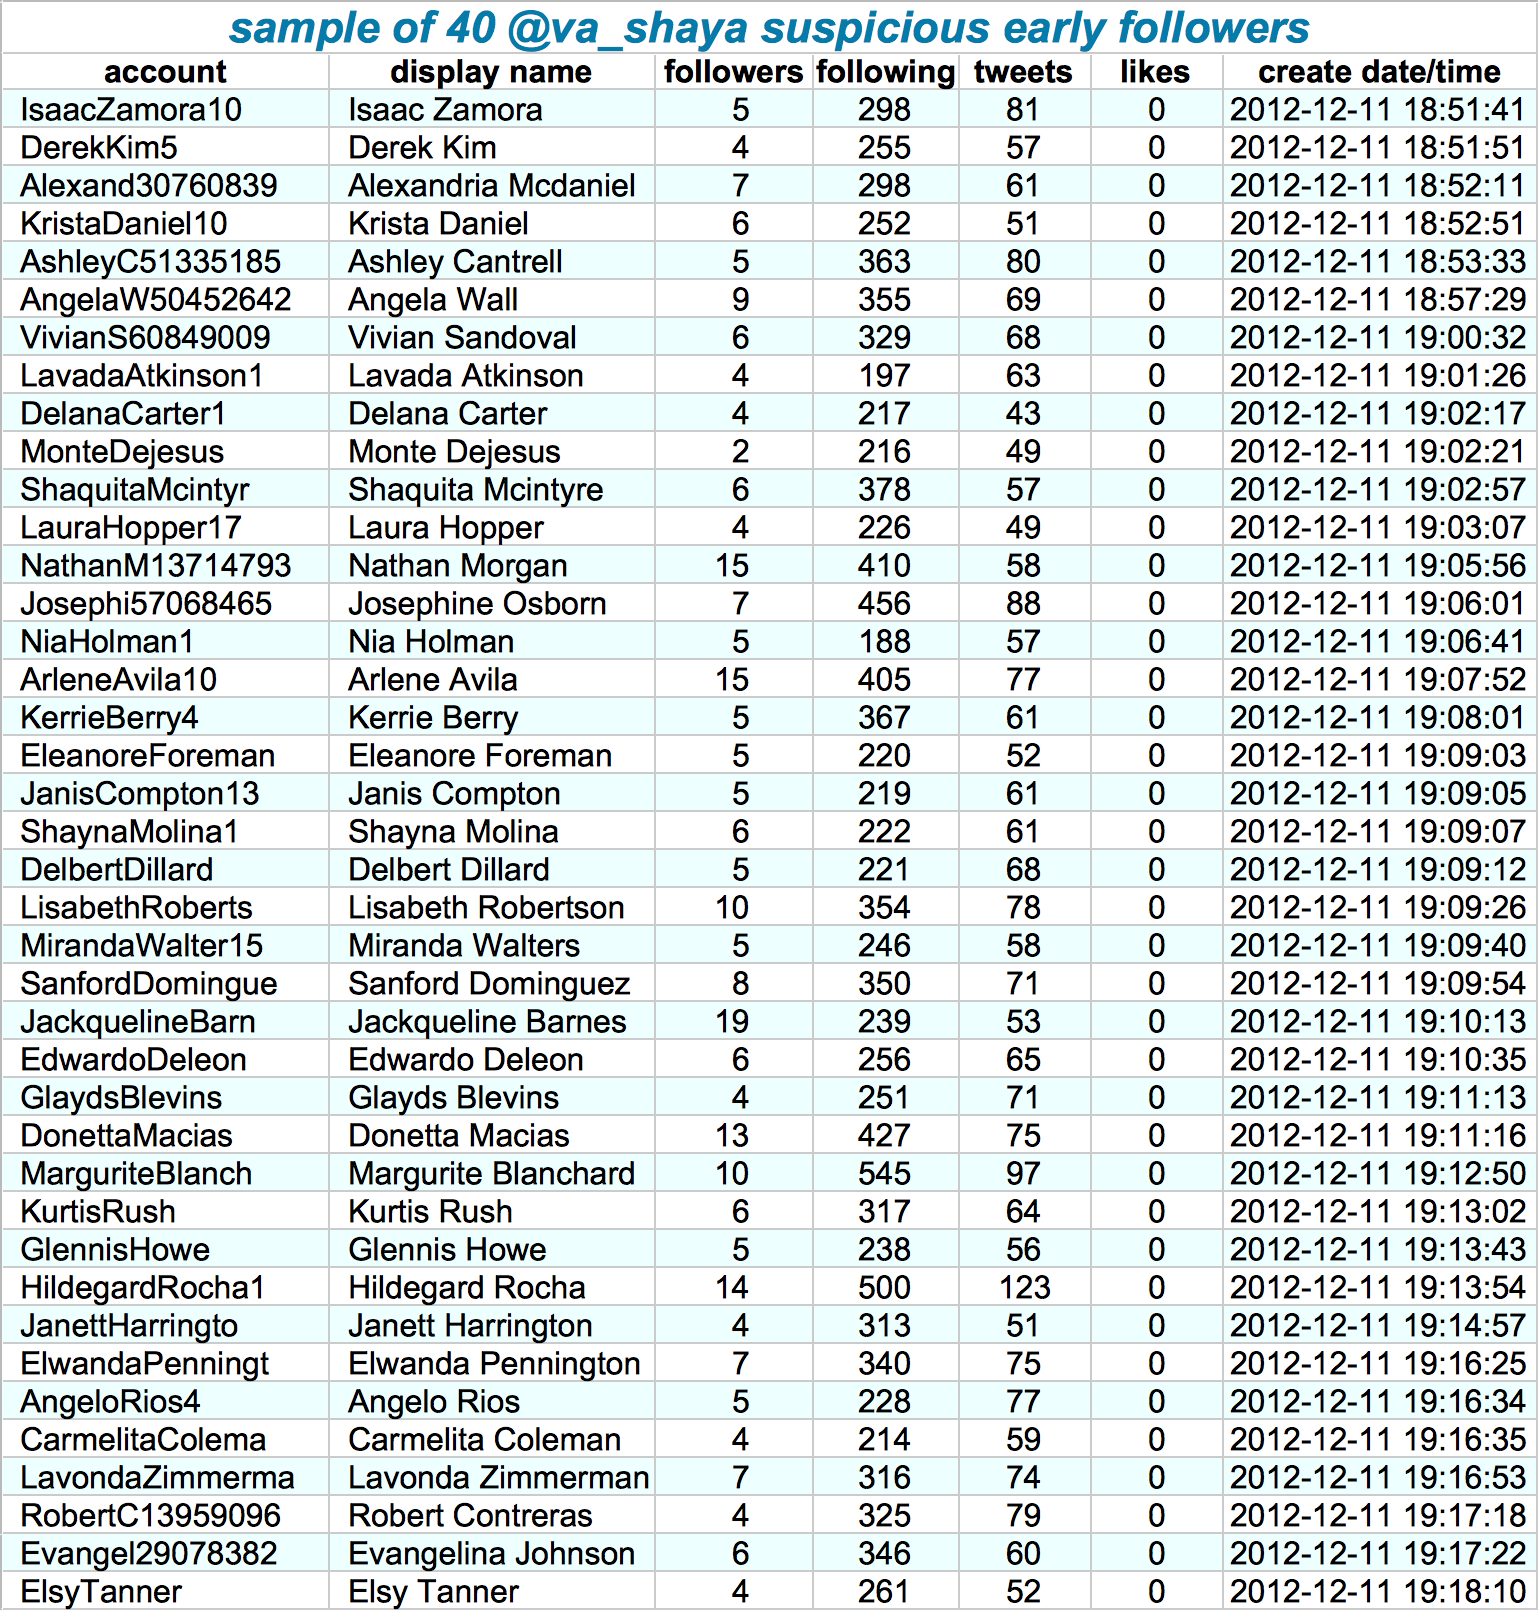
Looking at those followers in more detail, other suspicious patterns emerge. Their names follow a same pattern, they have an about equal amount of followers, followings, tweets, and (no) likes. Moreover, they were created only seconds apart. Many of them seem to follow each other as well.
If that wasn’t enough proof of something’s off, here’s a variety of their tweets… Not really what everyday folks would tweet right? Plus similar patterns again across acounts.
At first, I thought, so what? This Shiva guy probably just set up some automated (Python?) scripts to make Twitter account and follow him. Good for him. It worked out, as his most recent 10k followers followed him organically.
However, it becomes more scary if you notice this Shiva guy is (succesfully) promoting the firing of people working for the government:
— Dr.SHIVA Ayyadurai, MIT PhD. Inventor of Email (@va_shiva) April 13, 2020
Anyways, wanted to share this simple though cool approach to finding bots & fake news networks on social media. I hope you liked it, and would love to hear your thoughts in the comments!
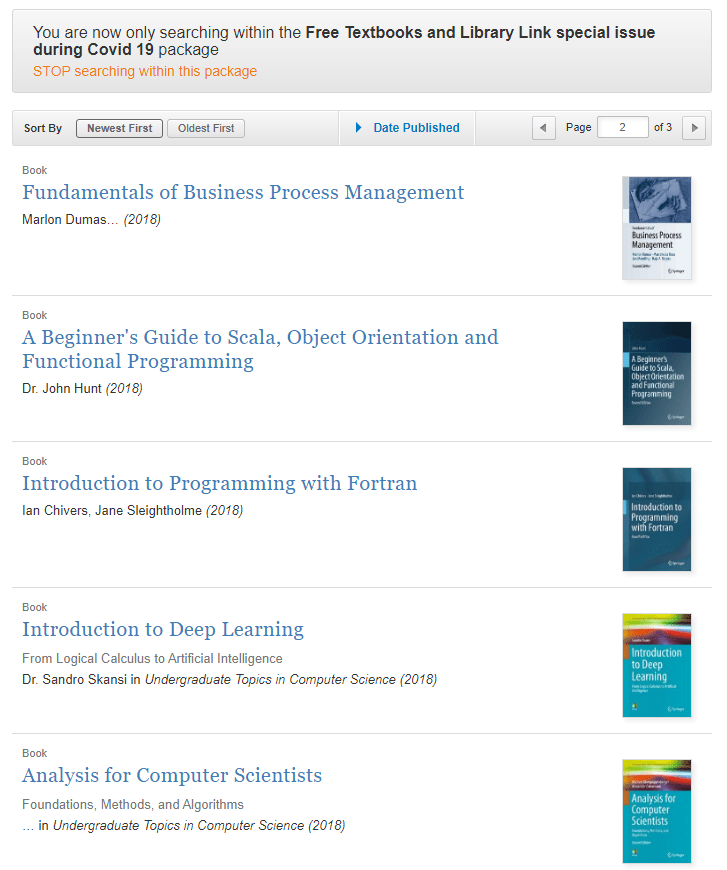
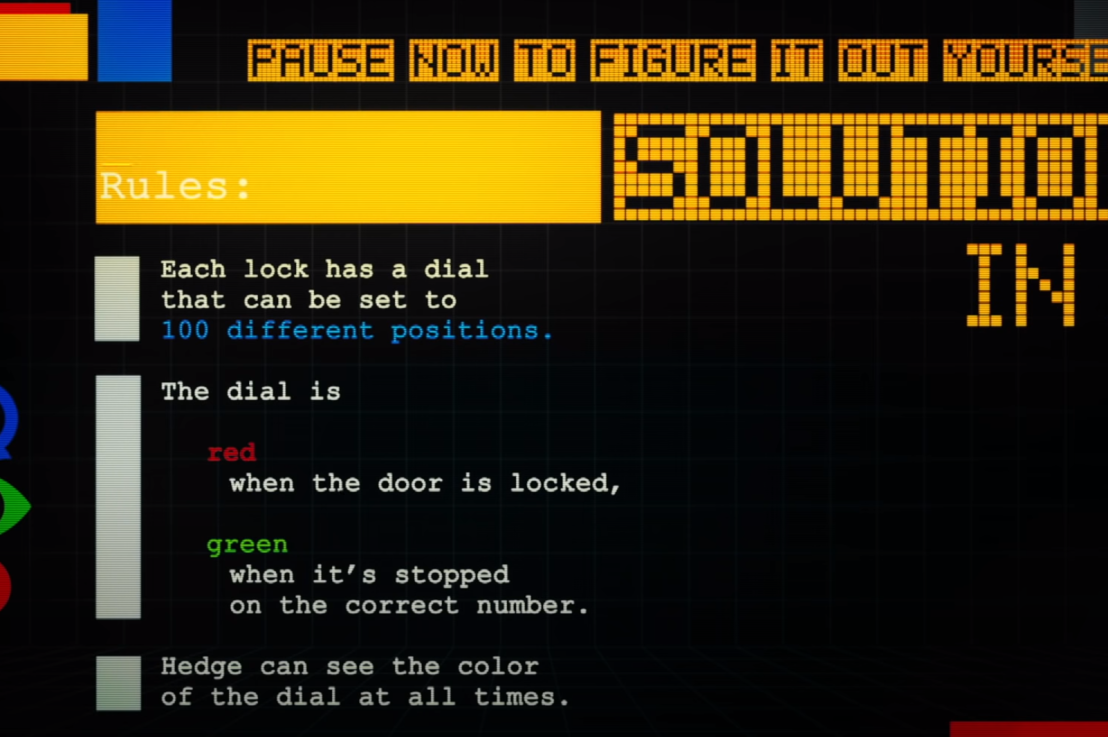
I stumbled across this TED Ed YouTube playlist called Think Like A Coder. It’s an amusing 10-episode video introduction for those new to programming and coding.
The series follows Ethic, a girl who wakes up in a prison, struck by amnesia, and thus without a clue how she got there. She meets Hedge, a robot she can program to help her escape and, later, save the world. However, she needs to learn how to code the Hedge’s instructions, and write efficient computer programs. Ethic and Hedge embark on a quest to collect three artifacts and must solve their way through a series of programming puzzles.
Episode 1 covers loops.
The adventure begins!
Episode 1: Ethic awakens in a mysterious cell. Can she and robot Hedge solve the programming puzzles blocking their escape?
I recently visited a data science meetup where one of the speakers — Harm Bodewes — spoke about playing out the Monty Hall problem with his kids.
TheMonty Hall problemis probability puzzle. Based on the American television game show Let’s Make a Deal and its host, named Monty Hall:
You’re given the choice of three doors.
Behind one door sits a prize: a shiny sports car.
Behind the others doors, something shitty, like goats.
You pick a door — say, door 1.
Now, the host, who knows what’s behind the doors, opens one of the other doors — say, door 2 — which reveals a goat.
The host then asks you: Do you want to stay with door 1, or would you like to switch to door 3?
The probability puzzle here is:
Is switching doors the smart thing to do?
Back to my meetup.
Harm — the presenter — had ran the Monty Hall experiment with his kids.
Twenty-five times, he had hidden candy under one of three plastic cups. His kids could then pick a cup, he’d remove one of the non-candy cups they had not picked, and then he’d proposed them to make the switch.
The results he had tracked, and visualized in a simple Excel graph. And here he was presenting these results to us, his Meetup audience.
People (also statisticans) had been arguing whether it is best to stay or switch doors for years. Yet, here, this random guy ran a play-experiment and provided very visual proof removing any doubts you might have yourself.
You really need to switch doors!
At about the same time, I came across this Github repo by Saghir, who had made some vectorised simulations of the problem in R. I thought it was a fun excercise to simulate and visualize matters in two different data science programming languages — Python & R — and see what I’d run in to.
So I’ll cut to the chase.
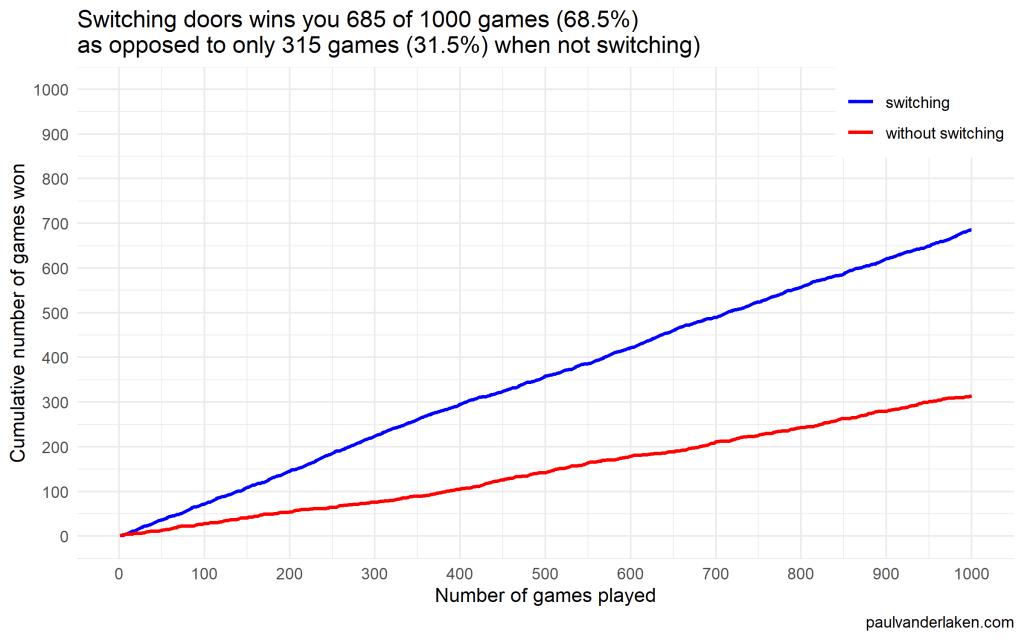
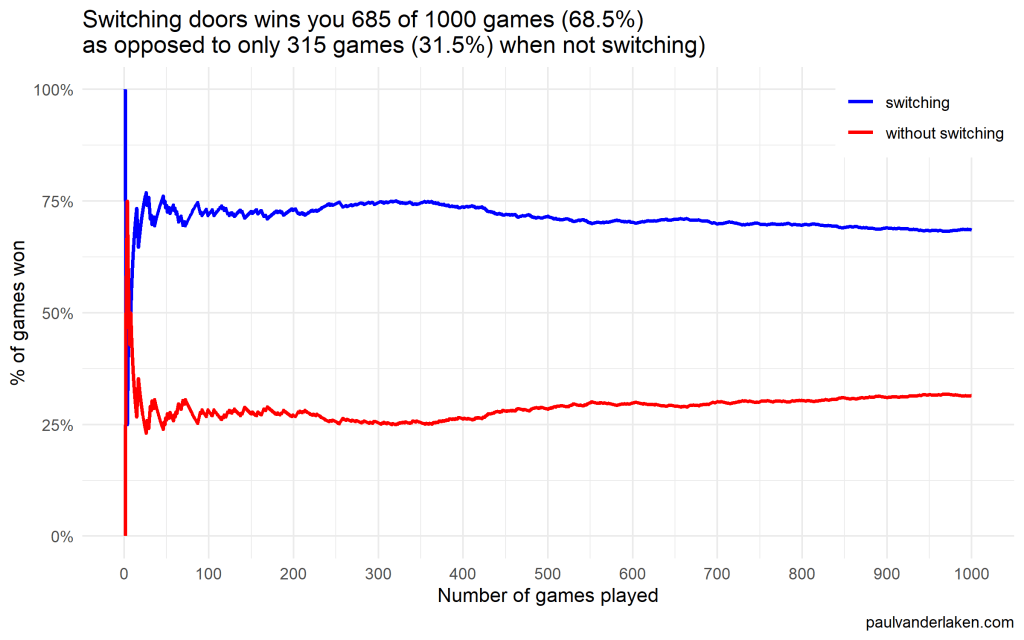
As we play more and more games against Monty Hall, it becomes very clear that you really, really, really need to switch doors in order to maximize the probability of winning a car.
Actually, the more games we play, the closer the probability of winning in our sample gets to the actual probability.
Even after 1000 games, the probabilities are still not at their actual values. But, ultimately…
If you stick to your door, you end up with the car in only 33% of the cases.
If you switch to the other door, you end up with the car 66% of the time!
Simulation Code
In both Python and R, I wrote two scripts. You can find the most recent version of the code on my Github. However, I pasted the versions of March 4th 2020 below.
The first script contains a function simulating a single game of Monty Hall. A second script runs this function an X amount of times, and visualizes the outcomes as we play more and more games.
Python
simulate_game.py
import random

def simulate_game(make_switch=False, n_doors=3, seed=None):
    '''
    Simulate a game of Monty Hall
    For detailed information: https://en.wikipedia.org/wiki/Monty_Hall_problem
    Basically, there are several closed doors and behind only one of them is a prize.
    The player can choose one door at the start.
    Next, the game master (Monty Hall) opens all the other doors, but one.
    Now, the player can stick to his/her initial choice or switch to the remaining closed door.
    If the prize is behind the player's final choice he/she wins.

    Keyword arguments:
    make_switch -- a boolean value whether the player switches after its initial choice and Monty Hall opening all other non-prize doors but one (default False)
    n_doors -- an integer value > 2, for the number of doors behind which one prize and (n-1) non-prizes (e.g., goats) are hidden (default 3)
    seed -- a seed to set (default None)
    '''

    # check the arguments
    if type(make_switch) is not bool:
        raise TypeError("`make_switch` must be boolean")
    if type(n_doors) is float:
        n_doors = int(n_doors)
        raise Warning("float value provided for `n_doors`: forced to integer value of", n_doors)
    if type(n_doors) is not int:
        raise TypeError("`n_doors` needs to be a positive integer > 2")
    if n_doors < 2:
        raise ValueError("`n_doors` needs to be a positive integer > 2")

    # if a seed was provided, set it
    if seed is not None:
        random.seed(seed)

    # sample one index for the door to hide the car behind
    prize_index = random.randint(0, n_doors - 1)

    # sample one index for the door initially chosen by the player
    choice_index = random.randint(0, n_doors - 1)

    # we can test for the current result
    current_result = prize_index == choice_index

    # now Monty Hall opens all doors the player did not choose, except for one door
    # next, he asks the player if he/she wants to make a switch
    if (make_switch):
        # if we do, we change to the one remaining door, which inverts our current choice
        # if we had already picked the prize door, the one remaining closed door has a nonprize
        # if we had not already picked the prize door, the one remaining closed door has the prize
        return not current_result
    else:
        # the player sticks with his/her original door,
        # which may or may not be the prize door
        return current_result
visualize_game_results.py
from simulate_game import simulate_game
from random import seed
from numpy import mean, cumsum
from matplotlib import pyplot as plt
import os

# set the seed here
# do not set the `seed` parameter in `simulate_game()`,
# as this will make the function retun `n_games` times the same results
seed(1)

# pick number of games you want to simulate
n_games = 1000

# simulate the games and store the boolean results
results_with_switching = [simulate_game(make_switch=True) for _ in range(n_games)]
results_without_switching = [simulate_game(make_switch=False) for _ in range(n_games)]

# make a equal-length list showing, for each element in the results, the game to which it belongs
games = [i + 1 for i in range(n_games)]

# generate a title based on the results of the simulations
title = f'Switching doors wins you {sum(results_with_switching)} of {n_games} games ({mean(results_with_switching) * 100:.1f}%)' + \
    '\n' + \
    f'as opposed to only {sum(results_without_switching)} games ({mean(results_without_switching) * 100:.1f}%) when not switching'

# set some basic plotting parameters
w = 8
h = 5

# make a line plot of the cumulative wins with and without switching
plt.figure(figsize=(w, h))
plt.plot(games, cumsum(results_with_switching), color='blue', label='switching')
plt.plot(games, cumsum(results_without_switching), color='red', label='no switching')
plt.axis([0, n_games, 0, n_games])
plt.title(title)
plt.legend()
plt.xlabel('Number of games played')
plt.ylabel('Cumulative number of games won')
plt.figtext(0.95, 0.03, 'paulvanderlaken.com', wrap=True, horizontalalignment='right', fontsize=6)

# you can uncomment this to see the results directly,
# but then python will not save the result to your directory
# plt.show()
# plt.close()

# create a directory to store the plots in
# if this directory does not yet exist
try:
    os.makedirs('output')
except OSError:
    None
plt.savefig('output/monty-hall_' + str(n_games) + '_python.png')
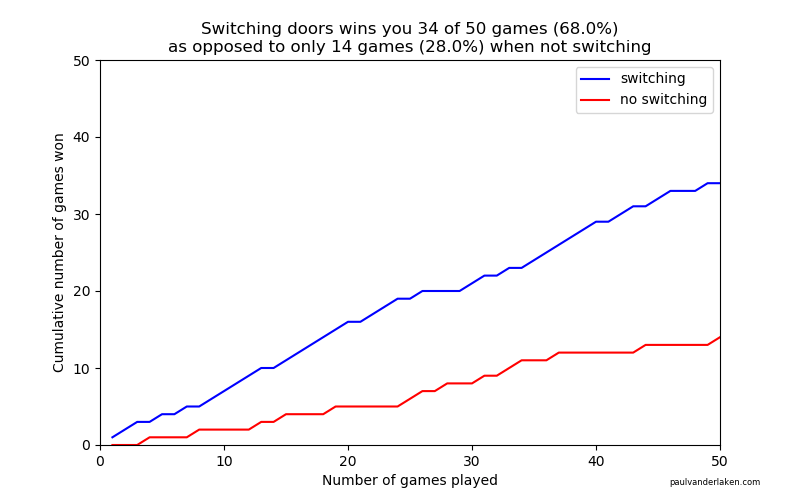
Visualizations (matplotlib)
R
simulate-game.R
Note that I wrote a second function, simulate_n_games, which just runs simulate_game an N number of times.
#' Simulate a game of Monty Hall
#' For detailed information: https://en.wikipedia.org/wiki/Monty_Hall_problem
#' Basically, there are several closed doors and behind only one of them is a prize.
#' The player can choose one door at the start.
#' Next, the game master (Monty Hall) opens all the other doors, but one.
#' Now, the player can stick to his/her initial choice or switch to the remaining closed door.
#' If the prize is behind the player's final choice he/she wins.
#'
#' @param make_switch A boolean value whether the player switches after its initial choice and Monty Hall opening all other non-prize doors but one. Defaults to `FALSE`
#' @param n_doors An integer value > 2, for the number of doors behind which one prize and (n-1) non-prizes (e.g., goats) are hidden. Defaults to `3L`
#' @param seed A seed to set. Defaults to `NULL`
#'
#' @return A boolean value indicating whether the player won the prize
#'
#' @examples
#' simulate_game()
#' simulate_game(make_switch = TRUE)
#' simulate_game(make_switch = TRUE, n_doors = 5L, seed = 1)
simulate_game = function(make_switch = FALSE, n_doors = 3L, seed = NULL) {

  # check the arguments
  if (!is.logical(make_switch) | is.na(make_switch)) stop("`make_switch` needs to be TRUE or FALSE")
  if (is.double(n_doors)) {
    n_doors = as.integer(n_doors)
    warning(paste("double value provided for `n_doors`: forced to integer value of", n_doors))
  }
  if (!is.integer(n_doors) | n_doors < 2) stop("`n_doors` needs to be a positive integer > 2")

  # if a seed was provided, set it
  if (!is.null(seed)) set.seed(seed)

  # create a integer vector for the door indices
  doors = seq_len(n_doors)

  # create a boolean vector showing which doors are opened
  # all doors are closed at the start of the game
  isClosed = rep(TRUE, length = n_doors)

  # sample one index for the door to hide the car behind
  prize_index = sample(doors, size = 1)

  # sample one index for the door initially chosen by the player
  # this can be the same door as the prize door
  choice_index = sample(doors, size = 1)

  # now Monty Hall opens all doors the player did not choose
  # except for one door
  # if we have already picked the prize door, the one remaining closed door has a nonprize
  # if we have not picked the prize door, the one remaining closed door has the prize
  if (prize_index == choice_index) {
    # if we have the prize, Monty Hall can open all but two doors:
    #   ours, which we remove from the options to sample from and open
    #   and one goat-conceiling door, which we do not open
    isClosed[sample(doors[-prize_index], size = n_doors - 2)] = FALSE
  } else {
    # else, Monty Hall can also open all but two doors:
    #   ours
    #   and the prize-conceiling door
    isClosed[-c(prize_index, choice_index)] = FALSE
  }

  # now Monty Hall asks us whether we want to make a switch
  if (make_switch) {
    # if we decide to make a switch, we can pick the closed door that is not our door
    choice_index = doors[isClosed][doors[isClosed] != choice_index]
  }

  # we return a boolean value showing whether the player choice is the prize door
  return(choice_index == prize_index)
}


#' Simulate N games of Monty Hall
#' Calls the `simulate_game()` function `n` times and returns a boolean vector representing the games won
#'
#' @param n An integer value for the number of times to call the `simulate_game()` function
#' @param seed A seed to set in the outer loop. Defaults to `NULL`
#' @param ... Any parameters to be passed to the `simulate_game()` function.
#' No seed can be passed to the simulate_game function as that would result in `n` times the same result
#'
#' @return A boolean vector indicating for each of the games whether the player won the prize
#'
#' @examples
#' simulate_n_games(n = 100)
#' simulate_n_games(n = 500, make_switch = TRUE)
#' simulate_n_games(n = 1000, seed = 123, make_switch = TRUE, n_doors = 5L)
simulate_n_games = function(n, seed = NULL, make_switch = FALSE, ...) {
  # round the number of iterations to an integer value
  if (is.double(n)) {
    n = as.integer(n)
  }
  if (!is.integer(n) | n < 1) stop("`n_games` needs to be a positive integer > 1")
  # if a seed was provided, set it
  if (!is.null(seed)) set.seed(seed)
  return(vapply(rep(make_switch, n), simulate_game, logical(1), ...))
}
visualize-game-results.R
Note that we source in the simulate-game.R file to get access to the simulate_game and simulate_n_games functions.
Also note that I make a second plot here, to show the probabilities of winning converging to their real-world probability as we play more and more games.
source('R/simulate-game.R')

# install.packages('ggplot2')
library(ggplot2)

# set the seed here
# do not set the `seed` parameter in `simulate_game()`,
# as this will make the function return `n_games` times the same results
seed = 1

# pick number of games you want to simulate
n_games = 1000

# simulate the games and store the boolean results
results_without_switching = simulate_n_games(n = n_games, seed = seed, make_switch = FALSE)
results_with_switching = simulate_n_games(n = n_games, seed = seed, make_switch = TRUE)

# store the cumulative wins in a dataframe
results = data.frame(
  game = seq_len(n_games),
  cumulative_wins_without_switching = cumsum(results_without_switching),
  cumulative_wins_with_switching = cumsum(results_with_switching)
)

# function that turns values into nice percentages
format_percentage = function(values, digits = 1) {
  return(paste0(formatC(values * 100, digits = digits, format = 'f'), '%'))
}

# generate a title based on the results of the simulations
title = paste(
  paste0('Switching doors wins you ', sum(results_with_switching), ' of ', n_games, ' games (', format_percentage(mean(results_with_switching)), ')'),
  paste0('as opposed to only ', sum(results_without_switching), ' games (', format_percentage(mean(results_without_switching)), ') when not switching)'),
  sep = '\n'
)

# set some basic plotting parameters
linesize = 1 # size of the plotted lines
x_breaks = y_breaks = seq(from = 0, to = n_games, length.out = 10 + 1) # breaks of the axes
y_limits = c(0, n_games) # limits of the y axis - makes y limits match x limits
w = 8 # width for saving plot
h = 5 # height for saving plot
palette = setNames(c('blue', 'red'), nm = c('switching', 'without switching')) # make a named color scheme

# make a line plot of the cumulative wins with and without switching
ggplot(data = results) +
  geom_line(aes(x = game, y = cumulative_wins_with_switching, col = names(palette[1])), size = linesize) +
  geom_line(aes(x = game, y = cumulative_wins_without_switching, col = names(palette[2])), size = linesize) +
  scale_x_continuous(breaks = x_breaks) +
  scale_y_continuous(breaks = y_breaks, limits = y_limits) +
  scale_color_manual(values = palette) +
  theme_minimal() +
  theme(legend.position = c(1, 1), legend.justification = c(1, 1), legend.background = element_rect(fill = 'white', color = 'transparent')) +
  labs(x = 'Number of games played') +
  labs(y = 'Cumulative number of games won') +
  labs(col = NULL) +
  labs(caption = 'paulvanderlaken.com') +
  labs(title = title)

# save the plot in the output folder
# create the output folder if it does not exist yet
if (!file.exists('output')) dir.create('output', showWarnings = FALSE)
ggsave(paste0('output/monty-hall_', n_games, '_r.png'), width = w, height = h)


# make a line plot of the rolling % win chance with and without switching
ggplot(data = results) +
  geom_line(aes(x = game, y = cumulative_wins_with_switching / game, col = names(palette[1])), size = linesize) +
  geom_line(aes(x = game, y = cumulative_wins_without_switching / game, col = names(palette[2])), size = linesize) +
  scale_x_continuous(breaks = x_breaks) +
  scale_y_continuous(labels = function(x) format_percentage(x, digits = 0)) +
  scale_color_manual(values = palette) +
  theme_minimal() +
  theme(legend.position = c(1, 1), legend.justification = c(1, 1), legend.background = element_rect(fill = 'white', color = 'transparent')) +
  labs(x = 'Number of games played') +
  labs(y = '% of games won') +
  labs(col = NULL) +
  labs(caption = 'paulvanderlaken.com') +
  labs(title = title)


# save the plot in the output folder
# create the output folder if it does not exist yet
if (!file.exists('output')) dir.create('output', showWarnings = FALSE)
ggsave(paste0('output/monty-hall_perc_', n_games, '_r.png'), width = w, height = h)
Visualizations (ggplot2)
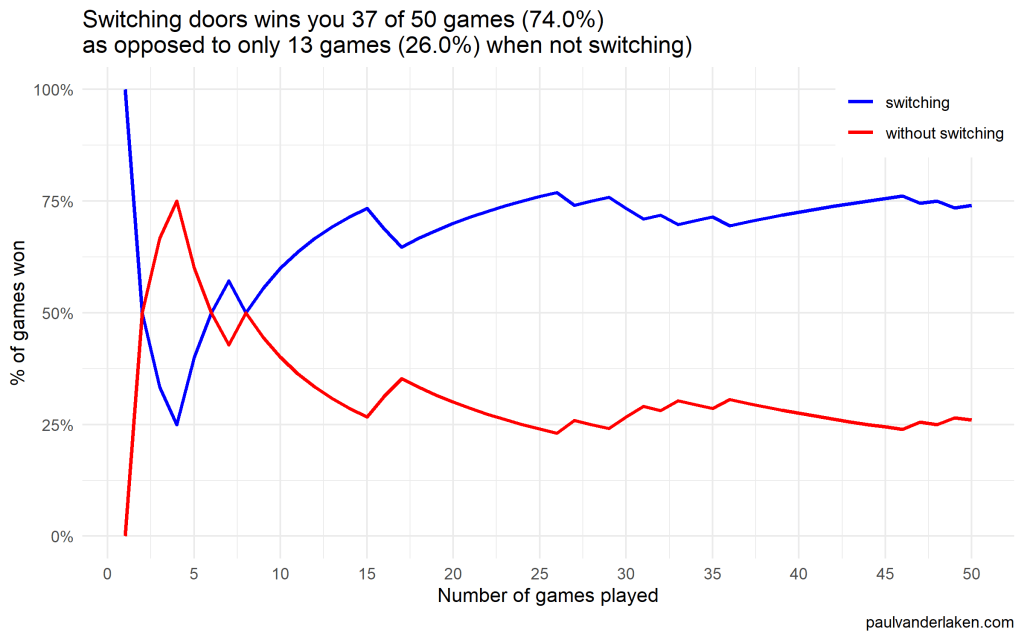
I specifically picked a seed (the second one I tried) in which not switching looked like it was better during the first few games played.
In R, I made an additional plot that shows the probabilities converging.
As we play more and more games, our results move to the actual probabilities of winning:
After the first four games, you could have erroneously concluded that not switching would result in better chances of you winning a sports car. However, in the long run, that is definitely not true.
I was actually suprised to see that these lines look to be mirroring each other. But actually, that’s quite logical maybe… We already had the car with our initial door guess in those games. If we would have sticked to that initial choice of a door, we would have won, whereas all the cases where we switched, we lost.
Keep me posted!
I hope you enjoyed these simulations and visualizations, and am curious to see what you come up with yourself!
For instance, you could increase the number of doors in the game, or the number of goat-doors Monty Hall opens. When does it become a disadvantage to switch?